


1. Introduction
In contemporary dynamic and ever-evolving automobile industry landscape, the ability to make informed decisions has become a critical factor in an organization's success. In fact, in the selling process of a vehicle, the most important issue is to determine the most affordable price without giving a price below the value of the car [1]. Neither too high nor too slow is a good situation. In the use of data-driven decision-making, companies in the top third of their industry are, on average, 5% more productive and 6% more profitable than their competitors [2]. One of the most significant challenges faced by businesses of all sizes is forecasting sales accurately. Accurate sales predictions empower companies to optimize their operations, streamline inventory management, and allocate resources efficiently. However, traditional methods of sales forecasting often fall short in providing the precision and adaptability needed in today's fast-paced used car markets.
Studies have shown that price prediction for used cars is an essential task [3]. Recently, demand for used automobiles has increased, while demand for new cars has decreased drastically [4]. In fact, the used automobile market has grown to become one of the fastest growing industries in the world in recent years [5]. Sadly, problems and distrust are kind of dominating the used car markets nowadays. Quality Uncertainty and the Market Mechanism offered insight into why the used car market is plagued by distrust among the buyers and the sellers of cars [6] The primary reason for uncertainty is that the buyers and the sellers have different knowledge about the quality of the car [7].
This is where machine learning, a powerful subset of artificial intelligence, has emerged as a game-changing tool for businesses. Machine learning models can analyse vast amounts of historical data, detect patterns, and generate forecasts with remarkable accuracy. In the realm of sales, the integration of machine learning techniques has revolutionized the way organizations approach sales prediction, making it a pivotal aspect of their decision-making processes. Therefore, the prediction can help a lot for people who has a will to buy a second-hand car for reference [8]. In this article, we mainly focus on the eXtreme Gradient Boosting(XGBoost) tree algorithm to build the prediction model after we test various commonly used machine learning algorithms. Experimental results confirm that ForeXGBoost yields a high prediction accuracy with a short running time since we leverage parallel computing to greatly reduce the training overhead. ForeXGBoost can be generalized to other data-driven prediction tasks, especially those involve time-series data [9]. Plus, we will also compare XGBoost algorithm to other algorithms.
This study explores the application of machine learning models in the context of used cars sales prediction, specifically in Britian. Automobile market behavior is of significant interest because of the substantial impacts of automobile production and use on a variety of public policy concerns including trade flows, business cycles, energy demand, and air pollution. We will delve into the various methods and algorithms employed, their benefits, and the challenges associated with implementing them in real-world business scenarios. Furthermore, we will discuss the transformative impact that predictive sales modelling can have on businesses, from enhancing customer satisfaction to optimizing marketing strategies and inventory management. Most importantly, we will focus on factors that contribute to the sales price fluctuation of used cars, such as make and model, age, mileage, condition, market demand, colour and so on. As embarks on this journey into the world of machine learning-powered sales prediction, we will witness the fusion of cutting-edge technology with timeless business acumen, shaping the future of commerce in an increasingly data-driven world.
2. Data and method
The data we have used can be downloaded from https://www.kaggle.com/datasets/adityadesai13/used-car-dataset-ford-and-mercedes. The dataset collects over 110,000 sets of data from eleven different brands in the UK used car market. Models, year, price, transmission, mileage, fuel type, tax, mpg, engine size are included in each data set, and we use these nine different assessments to make predictions about the data. (However, when we first encountered the data, we realized that there were very many gaps as well as ambiguities in the data, which requires more detailed and thorough processing of the data to obtain more standardized and reliable data. These processes will be explained in more detail later.) Thankfully, each of the nine metrics that are available are instructive for used car price forecasting. When we put ourselves in the shoes of a used car buyer, we realize that all of these metrics are of concern to us when we are screening used car. The data source we used puts data from eleven different brands in eleven different tables. There were some problems with the tables, including, but not limited to, the presence of a large number of default and uncertain values, the presence of two columns describing the same characteristics, and so on. In order to ensure that the eleven tables could be combined into one complete dataset, we discarded data with default and uncertain values. For some of the tables where there were two columns with the same characteristics, we compared the data and values given in the two columns and values given in the two columns in each data set and retained the valid data, thus achieving the effect of retaining only one column of data. What is more, in order to make better use of this dataset and to fit the features with the highest correlation with prices, we have set the categorical type data into dummy variables. Finally, the training data has 88548 different used cars and the test dataset has 22137 different used cars.
In this study, we chose eXtreme Gradient Boosting(XGBoost) to predict the price of used cars, and we will compare the effect of XGBoost with traditional regression models (e.g., Decision Tree, Random Forest, etc.) predicting. XGBoost (Extreme Gradient Boosting) is a superior machine leaning algorithm based on two key components: the boosting algorithm and the decision tree model. XGBoost employs the Gradient Boosting algorithm, which is an integrated learning technique designed to build powerful predictive models [11]. It starts with an initial prediction and then iteratively improves model performance. In each iteration, XGBoost calculates the residuals between the model predictions and the actual labels, and then fits a decision tree to capture the patterns of these residuals. By weightily combining the predictions from each tree, XGBoost continuously reduces the residuals, ultimately resulting in a robust integrated model. In addition, XGBoost introduces regularization techniques to control the complexity of the tree and prevent overfitting. Besides, XGBoost uses the CART algorithm to construct decision trees. Each decision tree is a binary tree that divides the data by selecting the best features and thresholds at each node to minimize the loss function. The value on each leaf node represents the predicted value, which can be the mean or the category proportion. During tree growth, XGBoost uses a greedy algorithm to select the best splitting point to ensure optimal fitting performance for each tree. Collectively, XGBoost is known for its superior performance and flexibility, making it the algorithm of choice for a variety of machine learning tasks.
In this study, we delve into the performance optimization of the XGBoost algorithm, which hinges on the careful tuning of a series of key hyperparameters. We tuned parameters such as learning rate, number of iterations, tree depth, minimum number of leaf node samples, column sampling ratio, and subsample to maximize model performance. In addition, we employ an early stopping strategy to save computational resources by stopping training early when the model no longer improves on the validation data. With the careful selection and tuning of these hyperparameters, we were able to obtain high-performance XGBoost models. When evaluating the performance of our models, we use several metrics, including Mean Absolute Error (MAE), Mean Squared Error (MSE), and R2 Score, to get a comprehensive view of the model's performance. Mean Absolute Error measures the mean absolute error of the model, which is insensitive to outliers and provides a visual representation of the magnitude of the model's prediction error. Mean Squared Error measures the average of the squared errors, which is more sensitive to larger error values and helps emphasize the model's performance under anomalous conditions. R2 Score measures the model's ability to explain the variance of the target variable, which indicates how much the model improves relative to the simple average model, with closer to 1 indicating a better model. By comparing these indicators together, we can assess the quality of the model more comprehensively, providing an important basis for further analysis and decision-making.
Table 1. Dataset variables description.
Variable | Category | Description |
Model | Categorical | Pseudolatry acid of the car |
Year | Float | Year of the car |
Price | Float | Price of a used car that will be predicted |
Transmission | Categorical | Type of transmission used by car |
Mileage | Float | Standard mileage offered by the car company |
Fuel-Type | Categorical | Type of fuel used by car |
Tax | Float | Tax of the car |
Mpg | Float | How many miles per gallon of fuel |
Engine-Size | Float | The engine capacity of the car |
3. Results and discussion
Preprocessing is a very important part in Machine Learning, as it will allow the most accurate possible results to be obtained [12]. According to Table 1, the nine feature columns, six of them are of float type and three of them are of categorical type. The processing of the data is divided into three parts: exploratory data analysis, correlation analysis and feature scaling. For the independent variable data, which is already of float type, we first used the boxplot function in matplotlib as well as the describe function to obtain the distribution range and characteristics of the data. It is not difficult to find that there are many outliers, such as the maximum value of 2060 in the column of Year, which is obviously impossible. The existence of outliers will have a great impact on the prediction of machine learning and may also lead to the emergence of results that are difficult to explain. So, we need to deal with outliers to improve the accuracy of the prediction. By looking at the boxplot images and data, we removed the data that had extremely large values, extremely small values and impossible values. The data with blank values, zero values were also converted to NaN to make these groups more valid. The descriptions are given in Table 2.
Table 2. Dataset variables description
1 | Year | Mileage | Tax | Mpg | EngineSize |
Mean | 2017 | 23603.90 | 93.84 | 43.03 | 1.682 |
Std | 2.12 | 21248.42 | 74.79 | 26.92 | 0.700 |
Minimum | 1970 | 1.00 | 0.00 | 0.00 | 0.000 |
25% percentile | 2016 | 8179.00 | 0.00 | 34.50 | 1.200 |
50% percentile | 2017 | 17918.00 | 145.00 | 50.40 | 1.600 |
75% percentile | 2019 | 32840.00 | 145.00 | 60.10 | 2.000 |
Maximum | 2060 | 323000.00 | 580.00 | 470.80 | 10.000 |
For the data in the dependent variable 'price' column, to identify and remove outliers in the 'price' column in the dataset, we use box plot statistics to compute the first quartile (Q1) and the third quartile (Q3), and then compute the interquartile range (IQR) based on these statistics. By comparing the data points to an upper threshold (Q3 + 1.5 * IQR), rows in the dataset with prices greater than or equal to this threshold are removed so that the dataset contains only non-outlier data. For categorical type data, it is difficult to analyze their characteristic correlation with price, we use the get_dummies() function in pandas library to implement one hot encode to Through the binary encoder,, these values are converted to binary numbers. After this process is completed, the binary values are divided into different columns. Binary encoding is a very efficient way of encoding when there are many categories [13]. At this point, we are ready to analyze the feature correlation between string data and prices. After completing the exploratory data analysis, we need to analyze the correlation between each independent variable and the dependent variable "price". Some of the existing independent variables have low correlation with price, if we use all the independent variables to predict the price, it will not only increase the complexity of the model and computation, but also reduce the accuracy of the prediction. We use the. corr() function in the pandas library to draw a heat map between each independent variable and the dependent variable (seen from Fig. 1), in which case the rows and columns represent different variables and the shade of the color indicates the degree of correlation between them. By looking at the heat map, we find that the four independent variables "tax", "mpg", "mileage", "engine size" are highly correlated with "price", but after a lot of permutations and attempts, we found that for this dataset, using "tax", "mpg", "mpg", "price", and "mpg" is not sufficiently correlated. "mpg", "mileage" to predict "price" with the highest accuracy. After completing the exploratory data analysis, we need to analyse the correlation between each independent variable and the dependent variable "price". Some of the existing independent variables have low correlation with price, if we use all the independent variables to predict the price, it will not only increase the complexity of the model and computation, but also reduce the accuracy of the prediction. We use the .corr() function in the pandas library to draw a heat map between each independent variable and the dependent variable, in which case the rows and columns represent different variables and the shade of the color indicates the degree of correlation between them. By looking at the heat map, we find that the four independent variables "tax", "mpg", "mileage", "engine size" are highly correlated with "price", but after a lot of permutations and attempts, we found that for this dataset, using "tax", "mpg", "mpg", "price", and "mpg" is not sufficiently correlated. "mpg", "mileage" to predict "price" with the highest accuracy.
After selecting the desired independent variables, we need to perform feature scaling on the model undergoing training. The purpose of feature scaling is to make the data points more closely distributed by converting the data to a specific scale or range with a specific size. We chose StandardScaler() to perform the scaling of the data, which guarantees that the variance of the data in each dimension is 1 and the mean is 0, so that the measured results will not be dominated by overly large eigenvalues in certain dimensions. After completing a series of processing, we can train the selected data.
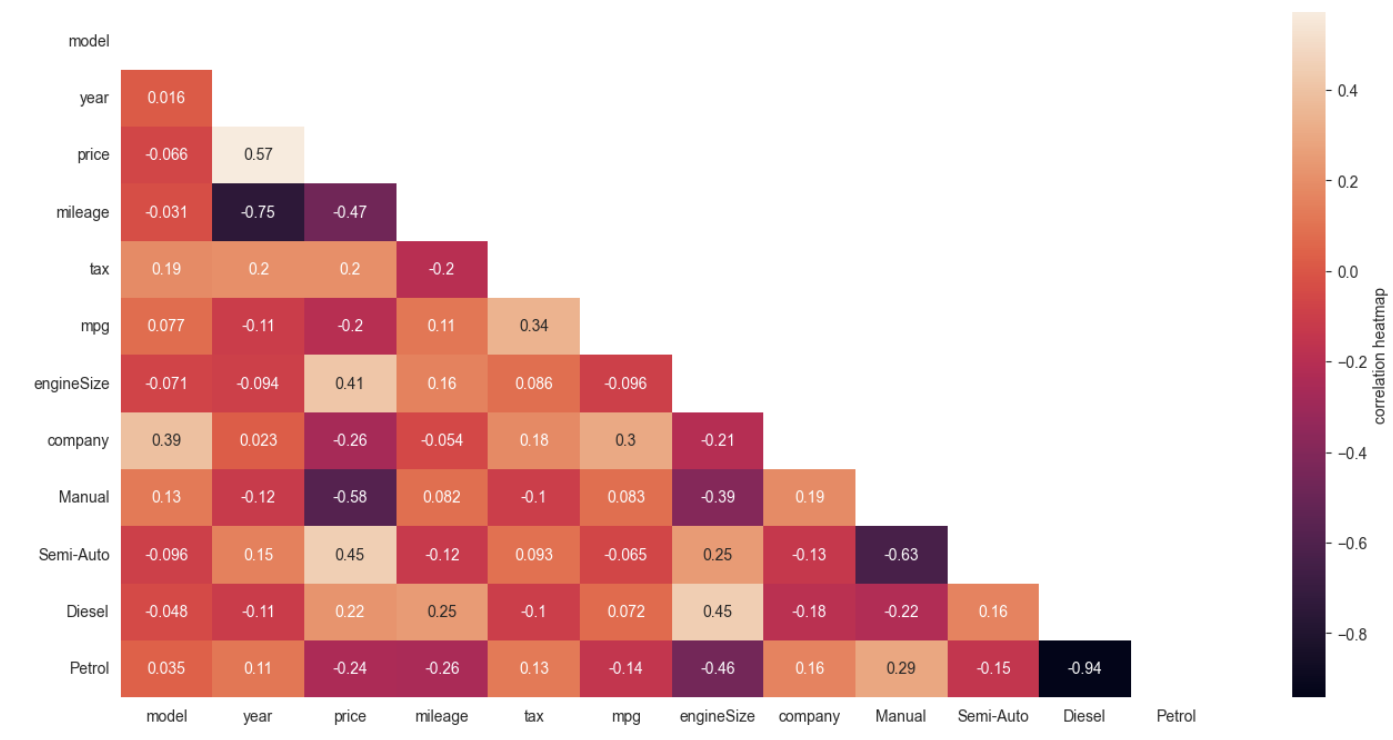
Figure 1. The correlation between different independent variables and prices in the form of a heat map (Photo/Picture credit: Original).
This data set is divided into training and validation data at 80%-20% respectively. The model is fitted on 80% of the training dataset and then 20% of the validation dataset is examined to evaluate the performance of the training model. Selecting eXtreme Gradient Boosting(XGBoost) for machine learning, we need to tune the hyperparameters of the model to get higher accuracy. After a lot of attempts, we got the model parameters with the highest accuracy in the available test data. The results are shown in Table 3. We compare the results of XGBoost training with conventional Linear Regression, Lasso, Decision Tree and ExtraTrees Regressor. The R2 score of our XGBoost is the highest among several models, while the MAE and MSE are also at a low level compared to similar algorithms. Further, since XGBoost requires second-order derivatives, there is no MAE for the objective function, and MAE is not suitable as a test of XGBoost's evaluation ability. Among the remaining algorithms, Decision Tree and ExtraTrees Regression have similar R2 Score as XGBoost, but the running time and memory usage are larger than XGBoost. We predicted the actual results with XGBoost and obtained the following data. The actual and predicted values in the list are regularized, and the range of the price after regularized value processing is between -5 and 5. The difference between the actual and predicted values in the actual prediction is only within 0.7. With these evaluation criteria, XGBoost has some advantages in predicting the price of used cars, and when facing a large dataset, XGBoost can achieve better prediction results with less time and memory consumption.
Table 3. The results of models
R2 Score | MAE | MSE | Performance | |
XGBoost | 0.9817 | 0.1885 | 0.0665 | 0.8263 |
Linear Regression | 0.7267 | 0.3944 | 0.2743 | 0.0312 |
Lasso | 0.0625 | 0.7811 | 0.9412 | 0.0311 |
Decision Tree | 0.9333 | 0.1636 | 0.0743 | 1.3417 |
ExtraTrees Regresson | 0.9561 | 0.1369 | 0.0441 | 16.294 |
Regarding the research objective of this paper, the used automobile market has always been an important part of the automotive sector, attracting a wide range of attention and participation. For participants in used automobile transactions, such as sellers and buyers, it is crucial to accurately predict the price of used automobiles. Sellers want to be able to sell their vehicles at a reasonable price, while buyers need to make sure that they do not overpay. In this case, the use of efficient and accurate predictive models has significant practical value. Used car price prediction is affected by a variety of factors, including the age, history, make, model, and condition of the vehicle. Traditional pricing methods may be difficult to fully consider these complex factors, while XGBoost, as a powerful machine learning algorithm, has the ability to handle high-latitude data and complex features. Therefore, applying XGBoost to used car price prediction research is expected to improve prediction accuracy and better capture the trend of vehicle price changes. By using advanced prediction models such as XGBoost, automobile trading platforms and dealerships can provide buyers and sellers with more accurate, fair, and transparent price proposals, thereby improving the efficiency and fairness of transactions.
4. Limitations and prospects
The application of eXtreme Gradient Boosting(XGBoost) in used car price prediction, although highly accurate and powerful in prediction, still has some challenges. In terms of prediction accuracy, XGBoost's approximation algorithm may give better results for the data and the approximation algorithm may be more average. But because the greedy algorithm is easy to implement, we can choose XGBoost for price prediction in most cases, but not the highest accuracy that can be achieved by existing models. At the same time, when dealing with small scale data, the processing of XGBoost often overfits. Or if the model complexity is too high, it may lead to poor prediction accuracy. In terms of data processing, in the face of string type data, we chose to subject them to ONE HOT encode processing, but in the subsequent research found that such processing will largely reduce the correlation between the independent variable and the dependent variable, or it is difficult to reasonably assess the relationship between the two. For example, in real life, people often care about the model of the car, and the model of the car often affects the price of the car, but in the process of drawing heatmap, there is only a low correlation between the model and the price, and it is difficult to consider the influence of the model in the process of predicting the price of the car. Meanwhile, in the dataset of this study, we deleted a large number of data with outliers and blank values, resulting in a reduction of the data volume from 110,976 to 89,054, which affected the accuracy of the prediction to a certain extent. Regarding the overall prediction, the number of independent variables is relatively small and backward, and there may be many other factors of concern to buyers that we have not considered. It is also difficult for us to consider the impact of market changes on the price of used cars, such as the impact of the popularity of trams on the purchase volume and price of oil cars. We also hope to take into account the particularly of the British market to carry out more targeted analysis. In the future, research on the use of XGBoost for used car price prediction will continue to deepen and expand. This includes improving model performance and generalization capabilities, exploring deep learning methods, processing time series data, integrating external data sources, improving interpretability and uncertainty analysis, enabling online and implementation forecasting, optimizing model deployment, and applying to market analysis and competitive strategies. Additionally, the impact of forecasts on sustainability and the environment will also be considered as sustainability and environmental factors come into prominence. These future outlooks are expected to drive the digitization and intelligence of the used car market to meet the changing market demands.
5. Conclusion
When it comes to used car price prediction, the study clearly demonstrates that eXtreme Gradient Boosting(XGBoost) is a powerful machine learning algorithm that provides high accuracy and robustness. Through adequate data preprocessing, feature selection, and model tuning, we successfully constructed an XGBoost model that is capable of accurately predicting the price of used cars. Compared with traditional regression models, XGBoost can perform well in most performance metrics, especially the R2 score, indicating its superior performance in capturing price trends and reducing prediction errors. However, we also realize that there are still some challenges and limitations in used car price prediction, including the quality of the data and the complexity of feature engineering, the need for outliers and numerical processing, and the interpretability and scalability of the model. Nevertheless, XGBoost remains an effective tool that can provide strong support to buyers and sellers in the used car market. In the future, it is believed that the performance of the model can be improved by further improving data quality, exploring more complex feature engineering techniques, experimenting with deep learning methods, integrating external data sources, and optimizing model hyperparameters. In addition, we also encourage the extension of such research to the broader field of market analysis and sustainability studies to better understand the dynamics and influencing factors of the used car market.
Author Contribution
All the authors contributed equally and their names were listed in alphabetical order.
References
[1]. Sumeyra M U and Yildiz K 2023,Using Linear Regression For Used Car Price Prediction, International Journal of Computational and Experimental Science and Engineering, vol 9(1) pp 11-16.
[2]. McAfee A, Brynjolfsson E, Davenport T H, Patil D J and Barton D 2012,Big data: the management revolution, Harvard business review vol 90(10) pp 60-68
[3]. Ayo F E, Awotunde J B, Misra S, Ajagbe S A and Mishra N 2022,A Rule-Based Deep Learning Method for Predicting Price of Used Car, International Conference on Machine Intelligence and Signal Processing pp 845-857.
[4]. Awotunde J B, Chakraborty C and Adeniyi A E 2021, Intrusion Detection in Industrial Internet of Things Network-Based on Deep Learning Model with Rule-Based Feature Selection, Wireless communications and mobile computing vol 3 pp 1-17
[5]. Shaprapawad S, Borugadda P, and Koshika N 2023, Car Price Prediction: An Application of Machine Learning, International Conference on Inventive Computation Technologies (ICICT) pp 242-248.
[6]. Akerlof G A 1978, The market of “lemons”:Quality uncertainty and the market mechanism, Uncertainty in Economics vol 1 pp 235–251
[7]. Kumar A, Machine Learning Based Solution for Asymmetric Information in Prediction of Used Car Prices, 2022 International Conference on Intelligent Vision and Computing pp 409-420.
[8]. Gegic E, Isakovic B, Keco D, Masetic Z and Kevric J 2019, Car price prediction using machine learning techniques, TEM Journal vol 8(1) p 113.
[9]. Xia Z, Xue S, Wu L, et al. 2020, ForeXGBoost: passenger car sales prediction based on XGBoost,Distributed and Parallel Databases vol 38 pp 713-738.
[10]. Chen T and Guestrin C 2016, Xgboost: A scalable tree boosting system, Proceedings of the 22nd acm sigkdd international conference on knowledge discovery and data mining pp 785-794.
[11]. Dutulescu A, Catruna A, Ruseti S, Iorga D, Ghita V, Neagu L M and Dascalu M 2023, Car Price Quotes Driven by Data-Comprehensive Predictions Grounded in Deep Learning Techniques, Deep Learning Techniques Electronics vol 12(14) p 3083.
[12]. Shaprapawad S, Borugadda P and Koshika N 2023, Car Price Prediction: An Application of Machine Learning,International Conference on Inventive Computation Technologies(ICICT) pp 242-248.
Cite this article
Guo,S.;Zhang,B. (2024). Revolutionizing the used car market: Predicting prices with XGBoost. Applied and Computational Engineering,48,173-180.
Data availability
The datasets used and/or analyzed during the current study will be available from the authors upon reasonable request.
Disclaimer/Publisher's Note
The statements, opinions and data contained in all publications are solely those of the individual author(s) and contributor(s) and not of EWA Publishing and/or the editor(s). EWA Publishing and/or the editor(s) disclaim responsibility for any injury to people or property resulting from any ideas, methods, instructions or products referred to in the content.
About volume
Volume title: Proceedings of the 4th International Conference on Signal Processing and Machine Learning
© 2024 by the author(s). Licensee EWA Publishing, Oxford, UK. This article is an open access article distributed under the terms and
conditions of the Creative Commons Attribution (CC BY) license. Authors who
publish this series agree to the following terms:
1. Authors retain copyright and grant the series right of first publication with the work simultaneously licensed under a Creative Commons
Attribution License that allows others to share the work with an acknowledgment of the work's authorship and initial publication in this
series.
2. Authors are able to enter into separate, additional contractual arrangements for the non-exclusive distribution of the series's published
version of the work (e.g., post it to an institutional repository or publish it in a book), with an acknowledgment of its initial
publication in this series.
3. Authors are permitted and encouraged to post their work online (e.g., in institutional repositories or on their website) prior to and
during the submission process, as it can lead to productive exchanges, as well as earlier and greater citation of published work (See
Open access policy for details).
References
[1]. Sumeyra M U and Yildiz K 2023,Using Linear Regression For Used Car Price Prediction, International Journal of Computational and Experimental Science and Engineering, vol 9(1) pp 11-16.
[2]. McAfee A, Brynjolfsson E, Davenport T H, Patil D J and Barton D 2012,Big data: the management revolution, Harvard business review vol 90(10) pp 60-68
[3]. Ayo F E, Awotunde J B, Misra S, Ajagbe S A and Mishra N 2022,A Rule-Based Deep Learning Method for Predicting Price of Used Car, International Conference on Machine Intelligence and Signal Processing pp 845-857.
[4]. Awotunde J B, Chakraborty C and Adeniyi A E 2021, Intrusion Detection in Industrial Internet of Things Network-Based on Deep Learning Model with Rule-Based Feature Selection, Wireless communications and mobile computing vol 3 pp 1-17
[5]. Shaprapawad S, Borugadda P, and Koshika N 2023, Car Price Prediction: An Application of Machine Learning, International Conference on Inventive Computation Technologies (ICICT) pp 242-248.
[6]. Akerlof G A 1978, The market of “lemons”:Quality uncertainty and the market mechanism, Uncertainty in Economics vol 1 pp 235–251
[7]. Kumar A, Machine Learning Based Solution for Asymmetric Information in Prediction of Used Car Prices, 2022 International Conference on Intelligent Vision and Computing pp 409-420.
[8]. Gegic E, Isakovic B, Keco D, Masetic Z and Kevric J 2019, Car price prediction using machine learning techniques, TEM Journal vol 8(1) p 113.
[9]. Xia Z, Xue S, Wu L, et al. 2020, ForeXGBoost: passenger car sales prediction based on XGBoost,Distributed and Parallel Databases vol 38 pp 713-738.
[10]. Chen T and Guestrin C 2016, Xgboost: A scalable tree boosting system, Proceedings of the 22nd acm sigkdd international conference on knowledge discovery and data mining pp 785-794.
[11]. Dutulescu A, Catruna A, Ruseti S, Iorga D, Ghita V, Neagu L M and Dascalu M 2023, Car Price Quotes Driven by Data-Comprehensive Predictions Grounded in Deep Learning Techniques, Deep Learning Techniques Electronics vol 12(14) p 3083.
[12]. Shaprapawad S, Borugadda P and Koshika N 2023, Car Price Prediction: An Application of Machine Learning,International Conference on Inventive Computation Technologies(ICICT) pp 242-248.