


1. Introduction
Contemporarily, predicting stock prices remains a burgeoning area of interest within the realms of both academia and the financial industry. Despite numerous endeavours aimed at devising novel techniques, strategies, and metrics, none have proven notably efficacious. The challenge lies in the multifaceted nature of stock market prediction, influenced by a multitude of factors, many of which remain undisclosed, as well as the inherent difficulty in capturing market volatility within a model. Additionally, forecasting such data proves to be formidable due to its manifestation of intricate non-linear relationships, non-constant characteristics, and a propensity for substantial heteroscedasticity [1].
The challenges encountered have given rise to the efficient-market hypothesis (EMH), as outlined in reference [2]. EMH posits that asset prices already incorporate information derived from both past occurrences and future expectations. In accordance with EMH, forecasting future prices based on historical data is unfeasible, as it necessitates access to privileged information. Detractors of EMH, on the other hand, draw attention to the psychological biases displayed by investors in uncertain situations, which result in irrational and unforeseeable behaviours [3]. Presently, there exists a lack of unanimity regarding the EMH and the discourse on this topic remains in a state of active contention.
In a more recent study, there has been an introduction of the adaptive markets hypothesis [4] (AMH), aimed at addressing the criticisms directed at EMH, which assert that markets are not governed by rationality but rather influenced by emotions like fear and greed. AMH takes a biological perspective in its examination, within the context of an evolutionary framework, where price dynamics result. In reality, it is plausible for identifiable patterns to emerge over shorter time intervals.
Traditionally, when it comes to analysing stock market data, two predominant approaches have been employed: fundamental analysis and technical analysis [5]. Fundamental analysis aligns itself with EMH in the long run but acknowledges the possibility of short-term inefficiencies. In contrast, technical analysis relies on historical data. In reality, numerous scholars frame the challenge of predicting stock prices. They also conducted evaluations on the top three companies, namely Apple, Microsoft, and Google. This surge in interest can be attributed to the fact that, in contrast to traditional approaches, these techniques are better equipped to handle intricate data characterized by non-linear relationships. As a matter of fact, ANNs have garnered considerable popularity and found application in numerous research endeavours. For instance, in reference [6], multiple ANN models were employed to predict daily NASDAQ data, while a similar methodology was extended to tick data from the Indian stock index [7]. Others proposed an ANN with a distinct optimization function and tested it on daily data from seven stock indices [8].
2. Basic descriptions
Currently, research has demonstrated that ML models, which offers several advantages over traditional forecasting methods. They not only yield results that closely match actual outcomes but also enhance prediction accuracy [9]. Incorporating cryptocurrencies into investment portfolios, as indicated in [10], enhances portfolio effectiveness. Optimal cryptocurrency allocation typically falls within the 5% to 20% range, depending on an investor's risk tolerance. For the prediction of time series data, particularly in the context of Bitcoin values [11], study employs machine learning algorithms such as RF and SGBM. Their results demonstrate the suitability of ML ensemble techniques for anticipating Bitcoin values.
To improve investment decision-making and minimize associated risks, a study presents a hybrid cryptocurrency prediction system that combines LSTM and GRU for two cryptocurrencies, Litecoin and Monero [12]. Meanwhile, others utilize minute-sampled Bitcoin returns to aggregate RV data to predict future values, achieving high accuracy [13-15]. Additionally, a typical study adopts machine learning techniques, including multiple regression and deep learning. Others involves the use of artificial intelligence frameworks [16]. The study highlights that LSTM is more effective at extracting short-term dynamics. Besides, some scholars argue that anticipate cryptocurrency markets, with neural networks (NN) outperforming other models [17]. Somme researchers utilizes LSTM to predict Bitcoin prices through Yahoo Finance, achieving predictions exceeding $12,600 USD in the days following [18]. Researchers have also been exploring innovative models [19]. Focusing on social factors, scholars employ a model to analyse two major with R2 scores of 44% and 59%, respectively [20]. Additionally, some researchers introduce two LSTM models, one with an AR(2) model, and finds that AR(2) outperforms LSTM in Bitcoin daily price forecasting [21]. In the investment process, historical cryptocurrency prices play a pivotal role, with strategies like Markov chains employing decision trees to identify cryptocurrencies likely to yield higher returns [22].
3. Methodology and machine learning scenarios
To accomplish the objectives, this study summarized the common three distinct models for predicting cryptocurrency prices based on historical data. To be specific, this study conducted a comparative analysis against existing models through a five-stage process. The history is collected, which underwent thorough exploration and visualization, shedding light on data patterns, behaviours, and interrelationships among different cryptocurrencies. Then, one proceeded to train three different algorithms: LSTM, GRU, and bi-LSTM [23]. Following the training phase, the models were rigorously tested to evaluate their predictive capabilities. Finally, one extracted and compared the model results, with a focus on daily closing prices. Figure 1 illustrates the sequential methodology for dataset processing, commencing with data acquisition. Subsequently, data visualization techniques are employed to illustrate data behavior, distribution, and interdependencies among different cryptocurrencies. Following this, model training takes place using 80% of the dataset, spanning from January 22, 2018, to October 22, 2020. The testing phase, covering the remaining 20% of the data from October 22, 2020, to June 30, 2021, follows the training. Lastly, model results are extracted and meticulously compared, ultimately leading to the selection.
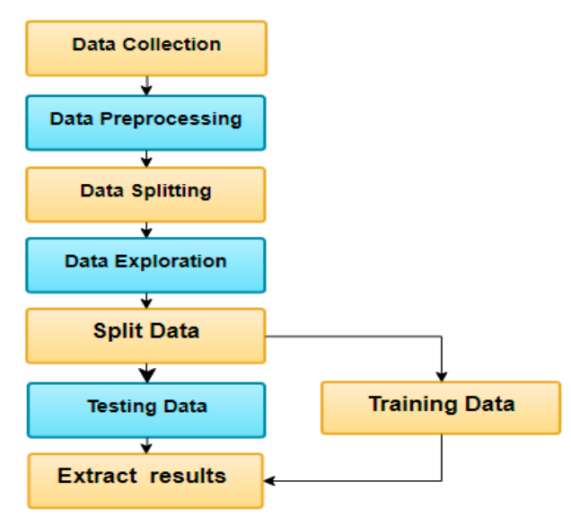
Figure 1. A sketch of the data processing [23].
The closing price exhibited a gradual increase until the conclusion of 2020. Subsequently, there was a sudden surge in price, with BTC reaching its peak at 63,381 USD in the time series. It offers insights into the closing price of ETH within the same dataset. Similar to BTC, this figure showcases a gradual rise, followed by a sudden spike that saw ETH reaching a high of 4,140 USD. Lastly, one focuses on the closing price of LTC within the dataset (not shown here, seen from Ref. [23]). Much like BTC and ETH, this figure reveals a steady uptrend in the closing price until the conclusion of 2020. Following this, there was an abrupt increase in price, with LTC reaching a peak of 373.64 USD.
RNNs with LSTM architecture have gained prominence in addressing various learning challenges associated with sequential data. These LSTMs prove to be both effective and scalable, making them valuable for capturing prolonged temporal dependencies in a generic and efficient manner [24]. The LSTM architecture resembles that of an RNN, but it incorporates gates, which play a crucial role in altering the information propagation. Ultimately, the output is a refined version of the cell state, influenced by the contextual information from the inputs [25]. However, it's worth noting that the LSTM design has faced criticism for its somewhat ad hoc nature and the presence of numerous components whose functions might not be immediately evident. Consequently, there remains uncertainty about whether LSTM represents the optimal design, with the possibility that more refined alternatives exist [26]. Figure 2 illustrates the typical sketch and structure for the LSTM [27]. Others discussed the bi-directional LSTM, as documented in [28], as a network designed to process input data sequences from both past and future contexts (seen from Figure 3). This architecture involves the processing of input data through two interconnected layers [29]. The bi-directional LSTM is capable of predicting or tagging the sequence of each element by considering the context of elements not only from the past but also from the future. This is achieved by employing two LSTMs operating in parallel, one processing the sequence from left to right and the other from right to left. The combined output, referred to as the composite output, serves as the prediction. The forward operation of the bi-directional LSTM, with L units as inputs and H representing the number of hidden units. Figure 3 provides a visual representation of the bi-directional LSTM structure [30]. In this architecture, the hidden layer of the bi-directional LSTM network stores two values: one used in the forward computation (denoted as A), and the other, the transpose of A, involved in the reverse computation. The final output value, denoted as y, is dependent on both A and A transpose [31]. GRUs have proven to be highly effective in a range of applications that involve sequential or time-dependent data [32]. Figure 7 provides a visual depiction of the GRU architecture [33].
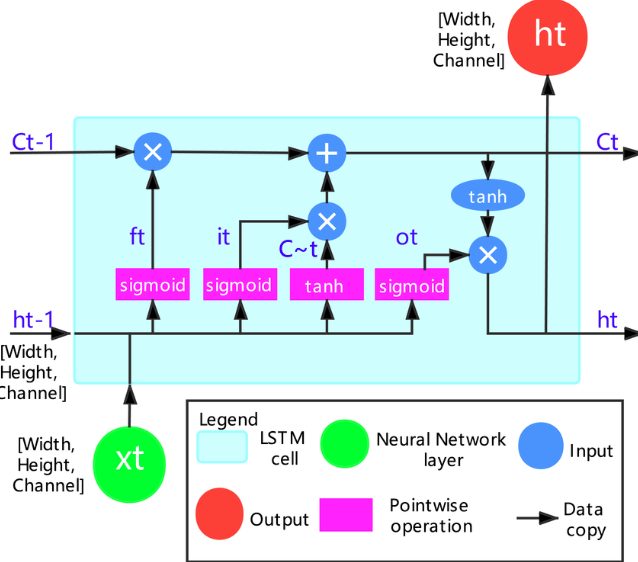
Figure 2. A visual representation of the LSTM algorithm's structure [26].
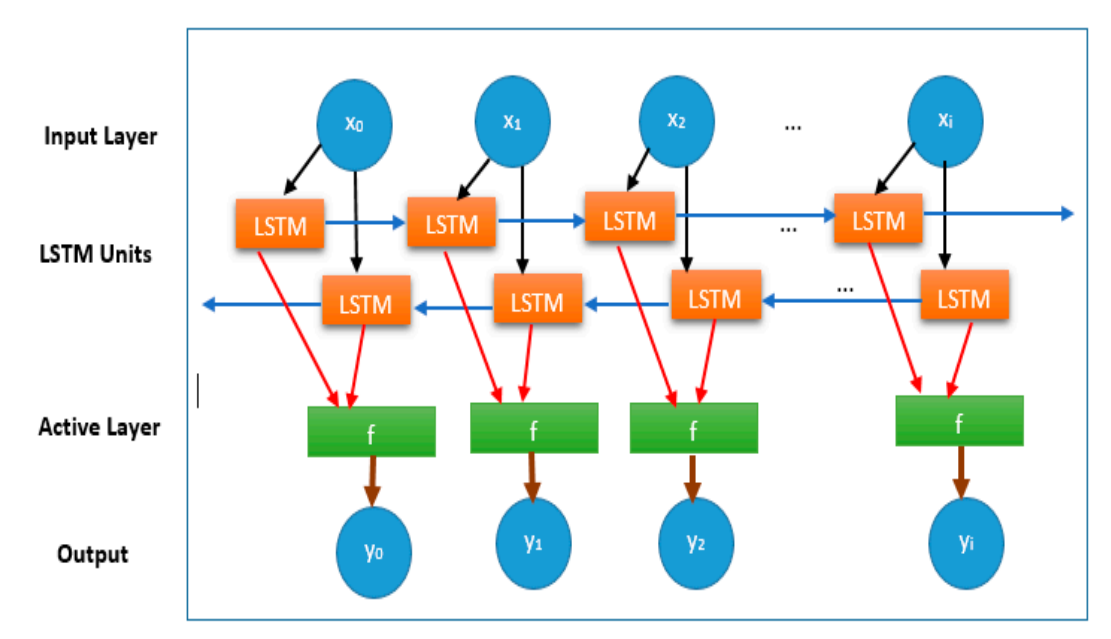
Figure 3. A typical sketch of LSTM(bi-LSTM) algorithm [28].
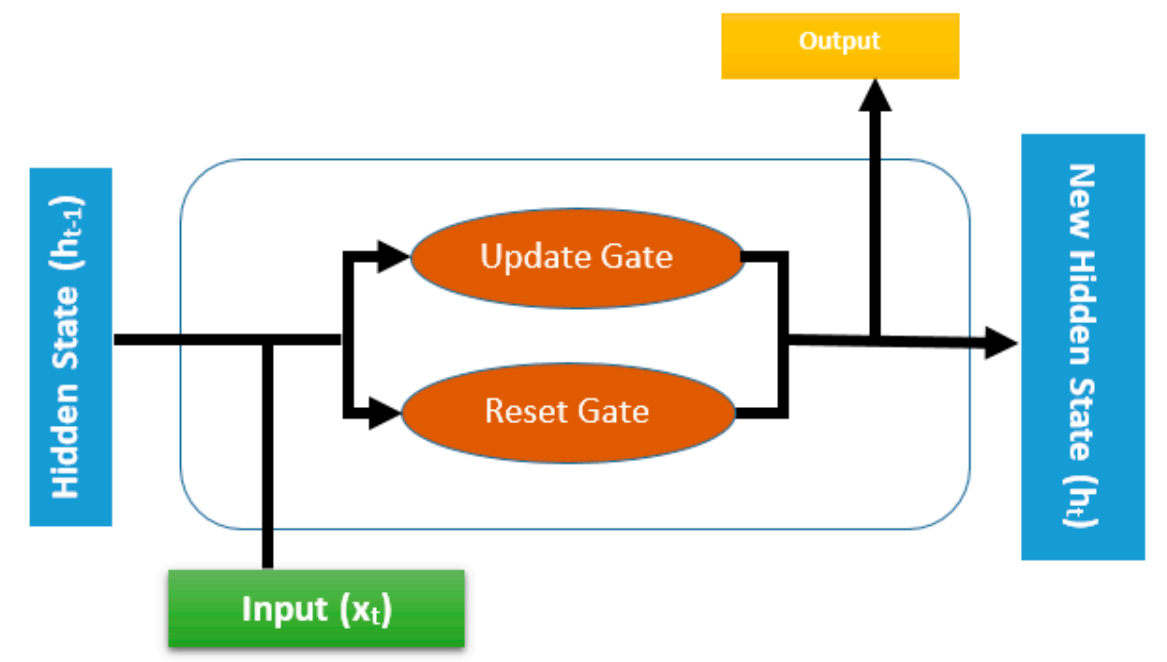
Figure 4. A sketch of GRU [33].
The assessment of the proposed approaches involves the use of two metrics: the mean absolute percentage error (MAPE) and the root mean squared error (RMSE).
Here, Ai represents the actual cryptocurrency prices, Fi represents the forecasted cryptocurrency prices, and N stands for the total number of samples. In data analysis, it's valuable and essential to grasp the data's distribution and patterns using a reliable and insightful chart to uncover the insights within the data. According to the correlation analysis in Ref. [23], Within this matrix, a notable positive correlation is evident among various currencies, such as BTC, LTC, and ETH. In practical terms, this implies that when one of these selected cryptocurrencies experiences an increase or decrease in value, the others tend to follow suit in a corresponding manner. The dataset under analysis was sourced from an open-access website, as detailed in [23]. It comprises a single .csv file organized into three separate sheets. The data within this dataset encompasses daily recorded prices spanning from January 1, 2018, to June 30, 2021, totalling 1,277 records as sourced from [34].
4. Results and applications
This part presents the outcomes derived from employing three different algorithms for three widely recognized cryptocurrencies. The results for each model are documented in some of the studies [23, 33-35]. The model that yields the lowest RMSE and MAPE is deemed the most effective. According to this criterion, all the models applied to the three cryptocurrency types demonstrate good performance, but notably, the GRU stands out as the superior choice among the three. This is because the GRU model achieves the lowest RMSE, indicating its capability to predict long-term dependencies more effectively compared to LSTM and bi-LSTM. This advantage arises from its ability to capture past price dependencies. Furthermore, others provide the actual and predicted results, revealing that, in general, the simulation results from these models closely align with the actual outcomes, with only a few instances of deviation. Notably, the MAPE values for the proposed GRU model in predicting LTC demonstrate superior performance when compared to all other models. The results obtained from this study indicate that GRU outperformed both LSTM and bi-LSTM models. Another research also compares the current results for different studies [34], which also obtains a perfect results with MAPE<5%. Some typical results of the prediction is shown in Fig. 5 [35, 36].
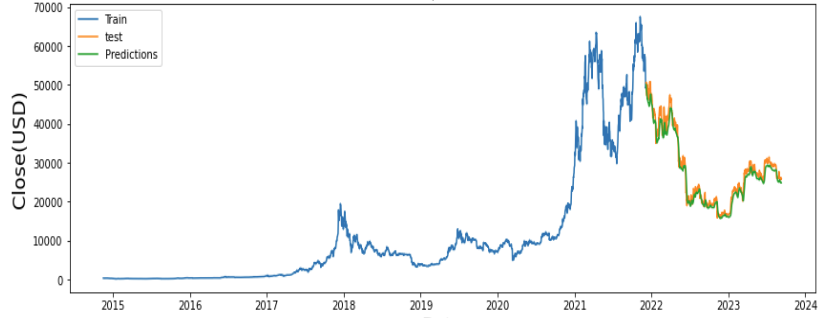
Figure 5. A sketch of the prediction [35, 36].
5. Limitations and prospects
Although some of the models achieve great performances in certain cryptocurrency during a certain period. It should be noted that changing the training period or slightly turning the parameters will appear different results, which attributed to the stochastic effects of cryptocurrency market especially affecting by the policy. Moreover, some of the price evolution patterns might be unable to distinguish on account of the random signals. Besides, if the data size is too small, the overfitting effects (especially originated from fat-tailed special issues [15, 17]) will be strongly affect the final results. In other words, one may achieve a well-performances in test or validation set, it will have pretty worse performances in outer example data set. For further study, one can change the loss function by combination of MAE and others to make the model normal, not "out of line". For example, if the MAE is used, the LSTM model will be forced to pay more attention to detecting peaks/valleys. Loss functions for many custom trades can also make the model evolve in a less conservative direction. One can also limit conservative AR-type models, This gives deep learning algorithms an incentive to explore riskier/interesting models. Nevertheless, that's not a easy task on account of the data collection availability. In addition, it is crucial to get more and/or better data. If past prices are enough to predict future prices with reasonable accuracy, then we need to introduce other features with comparable predictive power. This way the LSTM model doesn't rely too heavily on past prices and perhaps unlocks more complex behaviour, which is probably the most reliable and at the same time the most difficult solution to accomplish.
6. Conclusion
To sum up, in this research, three schemes were developed and employed to forecast the prices of three different cryptocurrencies, namely BTC, ETH, and LTC. Performance assessments were carried out to gauge the accuracy of various models, as depicted in Tables 2 to 4. Subsequently, this study conducted a comparative analysis. According to the analysis, the feature as well as metrics for different models and cryptos are clarified. At the same time, the current limitations and implementations of machine learning (especially deep learning) in cryptocurrency predictions are demonstrated. The future improvements tools are also proposed in the meantime.
References
[1]. Pai P F and Lin C S 2005 Omega vol 33(6) pp 497-505.
[2]. Sezer O B, Ozbayoglu M and Dogdu E 2017 Procedia computer science vol 114 pp 473-480.
[3]. Henrique B M, Sobreiro V A and Kimura H 2018 The Journal of finance and data science vol 4(3) pp 183-201.
[4]. Basak S, Kar S, Saha S, Khaidem L and Dey S R 2019 The North American Journal of Economics and Finance vol 47 pp 552-567.
[5]. Chen J, Hong H and Stein J C 2001 Journal of financial Economics vol 61(3) pp 345-381.
[6]. Picasso A, Merello S, Ma Y, Oneto L and Cambria E 2019 Expert Systems with Applications vol 135 pp 60-70.
[7]. Souza T T and Aste T 2019 Physica A: Statistical Mechanics and its Applications vol 535 p 122343.
[8]. Li X, Wu P and Wang W 2020 Information Processing and Management vol 57(5) p 102212.
[9]. Weichbroth P, Wereszko K, Anacka H and Kowal J 2023 Sensors vol 23(6) p 3155.
[10]. Andrianto Y and Diputra Y 2017 Journal of finance and accounting vol 5(6) pp 229-238.
[11]. Derbentsev V, Babenko V, Khrustalev K, Obruch H and Khrustalova S 2021 International Journal of Engineering vol 34(1) pp 140-148.
[12]. Patel M M, Tanwar S, Gupta R and Kumar N 2020 Journal of information security and applications vol 55 p 102583.
[13]. Miura R, Pichl L and Kaizoji T 2019 Advances in Neural Networks–ISNN 2019: 16th International Symposium on Neural Networks ISNN pp 165-172.
[14]. Karasu S, Altan A, Saraç Z and Hacioğlu R 2018 26th signal processing and communications applications conference (SIU) pp 1-4.
[15]. Saad M, Choi J, Nyang D, Kim J and Mohaisen A 2019 IEEE Systems Journal vol 14(1) pp 321-332.
[16]. Yi W and Yeze Z 2019 5th International Conference on Information Management (ICIM) pp 97-101.
[17]. Valencia F, Gómez-Espinosa A and Valdés-Aguirre B 2019 Entropy vol 21(6) p 589.
[18]. Ferdiansyah F, Othman S H, Radzi R, Stiawan D, Sazaki Y and Ependi U 2019 International conference on electrical engineering and computer science (ICECOS) pp 206-210.
[19]. Zhao Y and Chen Z 2022 Journal of Asian Business and Economic Studies vol 29(2) pp 91-104.
[20]. Jain A, Tripathi S, Dwivedi H D and Saxena P 2018 Eleventh international conference on contemporary computing (IC3) pp 1-7.
[21]. Wu C H, Lu C C, Ma Y F and Lu R S 2018 IEEE International Conference on Data Mining Workshops (ICDMW) pp 168-175.
[22]. Lazo J G L, Medina G H H, Guevara A V, Talavera A, Otero A N and Córdova E A 2019 7th International Engineering Sciences and Technology Conference (IESTEC) pp 376-381.
[23]. Market Watch Which Provides the Latest Stock Market Financial and Business News Retrieved from: https://wwwmarketwatchcom (accessed on 16 June 2021)
[24]. Greff K, Srivastava R K, Koutník J, Steunebrink B R and Schmidhuber J 2016 IEEE transactions on neural networks and learning systems vol 28(10) pp 2222-2232.
[25]. Sherratt F, Plummer A and Iravani P 2021 Sensors vol 21(4) p 1264.
[26]. Jozefowicz R, Zaremba W and Sutskever I 2015 International conference on machine learning pp 2342-2350.
[27]. Le X H, Ho H V, Lee G and Jung S 2019 Water vol 11(7) p 1387.
[28]. Kwak G H, Park C W, Ahn H Y, Na S I, Lee K D and Park N W 2020 Korean Journal of Remote Sensing vol 36(4) pp 515-525.
[29]. Althelaya K A, El-Alfy E S M and Mohammed S 2018 9th international conference on information and communication systems (ICICS) pp 151-156.
[30]. Yildirim Ö 2018 Computers in biology and medicine vol 96 pp 189-202.
[31]. Yang S U 2019 IEEE 3rd Information Technology Networking Electronic and Automation Control Conference (ITNEC) pp 798-802.
[32]. Dey R and Salem F M 2017 IEEE 60th international midwest symposium on circuits and systems (MWSCAS) pp 1597-1600.
[33]. Su Y and Kuo C C J 2019 Neurocomputing vol 356 pp 151-161.
[34]. Seabe P L, Moutsinga C R B and Pindza E 2023 Fractal and Fractional vol 7(2) p 203.
[35]. Rafi M, Hameed S, Sohail I, Aliasghar M, Aziz A and Mirza Q A K 2023 IEEE Access vol 13.
[36]. Yurtsever M 2021 Avrupa Bilim ve Teknoloji Dergisi vol 31 pp 341-347.
Cite this article
Xiang,S. (2024). Evaluations of the machine learning schemes for cryptocurrency prediction. Applied and Computational Engineering,54,82-89.
Data availability
The datasets used and/or analyzed during the current study will be available from the authors upon reasonable request.
Disclaimer/Publisher's Note
The statements, opinions and data contained in all publications are solely those of the individual author(s) and contributor(s) and not of EWA Publishing and/or the editor(s). EWA Publishing and/or the editor(s) disclaim responsibility for any injury to people or property resulting from any ideas, methods, instructions or products referred to in the content.
About volume
Volume title: Proceedings of the 4th International Conference on Signal Processing and Machine Learning
© 2024 by the author(s). Licensee EWA Publishing, Oxford, UK. This article is an open access article distributed under the terms and
conditions of the Creative Commons Attribution (CC BY) license. Authors who
publish this series agree to the following terms:
1. Authors retain copyright and grant the series right of first publication with the work simultaneously licensed under a Creative Commons
Attribution License that allows others to share the work with an acknowledgment of the work's authorship and initial publication in this
series.
2. Authors are able to enter into separate, additional contractual arrangements for the non-exclusive distribution of the series's published
version of the work (e.g., post it to an institutional repository or publish it in a book), with an acknowledgment of its initial
publication in this series.
3. Authors are permitted and encouraged to post their work online (e.g., in institutional repositories or on their website) prior to and
during the submission process, as it can lead to productive exchanges, as well as earlier and greater citation of published work (See
Open access policy for details).
References
[1]. Pai P F and Lin C S 2005 Omega vol 33(6) pp 497-505.
[2]. Sezer O B, Ozbayoglu M and Dogdu E 2017 Procedia computer science vol 114 pp 473-480.
[3]. Henrique B M, Sobreiro V A and Kimura H 2018 The Journal of finance and data science vol 4(3) pp 183-201.
[4]. Basak S, Kar S, Saha S, Khaidem L and Dey S R 2019 The North American Journal of Economics and Finance vol 47 pp 552-567.
[5]. Chen J, Hong H and Stein J C 2001 Journal of financial Economics vol 61(3) pp 345-381.
[6]. Picasso A, Merello S, Ma Y, Oneto L and Cambria E 2019 Expert Systems with Applications vol 135 pp 60-70.
[7]. Souza T T and Aste T 2019 Physica A: Statistical Mechanics and its Applications vol 535 p 122343.
[8]. Li X, Wu P and Wang W 2020 Information Processing and Management vol 57(5) p 102212.
[9]. Weichbroth P, Wereszko K, Anacka H and Kowal J 2023 Sensors vol 23(6) p 3155.
[10]. Andrianto Y and Diputra Y 2017 Journal of finance and accounting vol 5(6) pp 229-238.
[11]. Derbentsev V, Babenko V, Khrustalev K, Obruch H and Khrustalova S 2021 International Journal of Engineering vol 34(1) pp 140-148.
[12]. Patel M M, Tanwar S, Gupta R and Kumar N 2020 Journal of information security and applications vol 55 p 102583.
[13]. Miura R, Pichl L and Kaizoji T 2019 Advances in Neural Networks–ISNN 2019: 16th International Symposium on Neural Networks ISNN pp 165-172.
[14]. Karasu S, Altan A, Saraç Z and Hacioğlu R 2018 26th signal processing and communications applications conference (SIU) pp 1-4.
[15]. Saad M, Choi J, Nyang D, Kim J and Mohaisen A 2019 IEEE Systems Journal vol 14(1) pp 321-332.
[16]. Yi W and Yeze Z 2019 5th International Conference on Information Management (ICIM) pp 97-101.
[17]. Valencia F, Gómez-Espinosa A and Valdés-Aguirre B 2019 Entropy vol 21(6) p 589.
[18]. Ferdiansyah F, Othman S H, Radzi R, Stiawan D, Sazaki Y and Ependi U 2019 International conference on electrical engineering and computer science (ICECOS) pp 206-210.
[19]. Zhao Y and Chen Z 2022 Journal of Asian Business and Economic Studies vol 29(2) pp 91-104.
[20]. Jain A, Tripathi S, Dwivedi H D and Saxena P 2018 Eleventh international conference on contemporary computing (IC3) pp 1-7.
[21]. Wu C H, Lu C C, Ma Y F and Lu R S 2018 IEEE International Conference on Data Mining Workshops (ICDMW) pp 168-175.
[22]. Lazo J G L, Medina G H H, Guevara A V, Talavera A, Otero A N and Córdova E A 2019 7th International Engineering Sciences and Technology Conference (IESTEC) pp 376-381.
[23]. Market Watch Which Provides the Latest Stock Market Financial and Business News Retrieved from: https://wwwmarketwatchcom (accessed on 16 June 2021)
[24]. Greff K, Srivastava R K, Koutník J, Steunebrink B R and Schmidhuber J 2016 IEEE transactions on neural networks and learning systems vol 28(10) pp 2222-2232.
[25]. Sherratt F, Plummer A and Iravani P 2021 Sensors vol 21(4) p 1264.
[26]. Jozefowicz R, Zaremba W and Sutskever I 2015 International conference on machine learning pp 2342-2350.
[27]. Le X H, Ho H V, Lee G and Jung S 2019 Water vol 11(7) p 1387.
[28]. Kwak G H, Park C W, Ahn H Y, Na S I, Lee K D and Park N W 2020 Korean Journal of Remote Sensing vol 36(4) pp 515-525.
[29]. Althelaya K A, El-Alfy E S M and Mohammed S 2018 9th international conference on information and communication systems (ICICS) pp 151-156.
[30]. Yildirim Ö 2018 Computers in biology and medicine vol 96 pp 189-202.
[31]. Yang S U 2019 IEEE 3rd Information Technology Networking Electronic and Automation Control Conference (ITNEC) pp 798-802.
[32]. Dey R and Salem F M 2017 IEEE 60th international midwest symposium on circuits and systems (MWSCAS) pp 1597-1600.
[33]. Su Y and Kuo C C J 2019 Neurocomputing vol 356 pp 151-161.
[34]. Seabe P L, Moutsinga C R B and Pindza E 2023 Fractal and Fractional vol 7(2) p 203.
[35]. Rafi M, Hameed S, Sohail I, Aliasghar M, Aziz A and Mirza Q A K 2023 IEEE Access vol 13.
[36]. Yurtsever M 2021 Avrupa Bilim ve Teknoloji Dergisi vol 31 pp 341-347.