


1. Introduction
The film industry constitutes a significant part of the entertainment sector, and despite the ongoing diversification of cultural and entertainment methods, the growth of box office revenue remains considerable. In 2018, the global total box office reached as much as $41.7 billion, and it is predicted to resume rapid development in the post-COVID-19 era. However, film production is a high-risk endeavor within the entertainment industry, with most films struggling to recover costs solely through box office revenue [1]. Therefore, accurate prediction of movie box office has become increasingly crucial for the healthy development of investment, production, distribution, and other aspects of the film industry. Simultaneously, movie box office prediction models based on artificial intelligence technology have become a research hotspot.
Existing movie prediction models can be categorized into three main types: (1) predicting the total box office before the release; (2) predicting the first-day (week) box office before the release; (3) dynamically predicting box office during the release.
In research on predicting the total box office before the release, Ghiassi et al. used an ensemble model based on the Dynamic Artificial Neural Network (DAN2) to predict the total box office, analyzing factors such as budget, star influence, and special effects [1]. Duan Junwen et al. employed a Gaussian copula model to predict the total box office and found that the number of theaters and budget at the release were the most influential factors [2]. Ahmed et al. (2020) used linear regression and machine learning ensemble algorithms (including XGBoost, RF, SVM, etc.) to predict the movie box office, suggesting that movie reviews from critics and journalists should not be added to movie predictions and should be conducted after determining the cast [3]. Hung et al. found that movie summaries could effectively influence predictions of total box office [4]. Wang et al. discovered that optimizing movie box office prediction models using big data significantly improved predictive performance [5]. Sharma et al. proposed a new method to study the influence of movie stars and directors and used this method to predict the total box office [6]. Agarwal et al positioned the success or failure of accuracy metrics through classification and clustering, analyzing the impact of factors such as movie duration and budget on success [7]. Shahid et al. transformed the prediction of total box office into the prediction of return on investment, emphasizing the analysis of the influence of movie genres on film investment [8]. Ni and Dong et al. used a hybrid model of machine algorithms (including XGBoost, LightGBM, CatBoost, etc.) and multiple linear regression to predict the total box office during the COVID-19 period in China, analyzing the impact of the pandemic on movie box office based on the fitted model [9]. Velingkar et al. analyzed the feature importance of variables such as budget and the number of theaters by comparing different machine learning models [10]. Leem et al. studied the impact of star additions on the total box office using clustering methods [11].
In the research on predicting the first-day (week) box office before the release, Mestyán et al. utilized Wikipedia activity data to predict the weekend box office of a movie, discussing the impact of search indices on box office predictions [12]. Ma et al. specifically focused on the influence of Electronic Word of Mouth (EWOM) in online reputation marketing on the early box office [13].
In the dynamic prediction of box office during the release, Baek et al. horizontally compared the dynamic impact of different communication platforms on the total box office [14]. Ru et al. introduced a deep ensemble model of DBP and LSTM as a predictive model, conducting rolling forecasts for the box office in the first 21 days of a movie. They found that incorporating more dynamic data could enhance prediction accuracy [15]. Gopinath et al. discussed the influence of advertising on the dynamic prediction of box office [16].
As predictions of the total box office are generally applied during the early production stage of a movie, where results are less accurate, models aim to have guiding value for commercial actions. Dynamic predictions of box office mainly focus on new movie characteristic variables, such as the volume of movie reviews, the positive review rate, and other online indicators. The main research direction for optimizing predictions lies in the exploration of network parameters. However, its applicability in the business field is not as strong as predictions for total box office and first-day box office. Therefore, predicting the first-day box office is an object that currently balances both commercial value and prediction accuracy. Consequently, we adopt the first-day box office for prediction analysis.
Simultaneously, most of the aforementioned models consider various factors in predicting box office. In the analysis of factors influencing movie box office, Wang et al. found that the highest box office for a considerable number of movies occurred on Saturdays [17]. Moreover, they observed a similarity in the proportion of the highest box office days between the first day and non-first days. However, the article did not delve into the temporal distribution patterns of box office, and based on existing research, we found that most factor analyses are based on traditional movie characteristics such as movie type, actors, directors, movie budget, or new movie characteristics such as the volume of movie reviews and positive review rates. There is limited analysis on the time distribution of box office peak values. Since similar studies on consumption peak values exist in other fields [18], we focus on the distribution characteristics of box office peak values — the holiday factor. We emphasize the impact of the holiday factor on the accuracy of box office predictions, proposing a method for predicting the first-day box office considering the holiday factor to explore and calculate the impact of the holiday factor on the performance of box office prediction methods. Our main contributions are as follows:
1.1. To explore the holiday factor, we propose the SARIMA—Box-Cox model for model fitting and determining the holiday factor through parameters.
1.2. We integrate the holiday factor with multiple linear regression (MLR), random forest (RF), support vector machine regression (SVR), deep neural network (DNN), and extreme gradient boosting (XGBoost) to establish several first-day box office prediction models. We discover that adding holiday factor virtual variables can effectively improve the prediction accuracy of the first-day box office, with the potential to achieve a performance indicator increase of up to 16.42%.
2. Proposed method
To assess the impact of incorporating the holiday factor on the prediction model’s accuracy, we propose a method for predicting the first-day box office considering the holiday factor, as shown in Figure 1. The method consists of the following two steps:
(a) Holiday Factor Exploration: We propose the time series analysis method SARIMA—Box-Cox model to analyze the daily total box office of the movie market and explore the weekday dummy variable. We apply Visual Inspection to analyze the quarterly total box office of the movie market and explore the summer vacation dummy variable. These two virtual variables are then considered as the holiday factor for predicting movie box office in the subsequent analysis.
(b) Calculating the Impact of the Holiday Factor on Prediction: We present multiple models integrating four machine algorithms and a multiple linear regression model with Holiday Factor. The experimental group includes the first-day box office dataset with the inclusion of the holiday factor, while the control group comprises the original first-day box office dataset. By comparing the prediction accuracy indicators of the two experimental groups, we calculate the impact of the holiday factor on prediction.
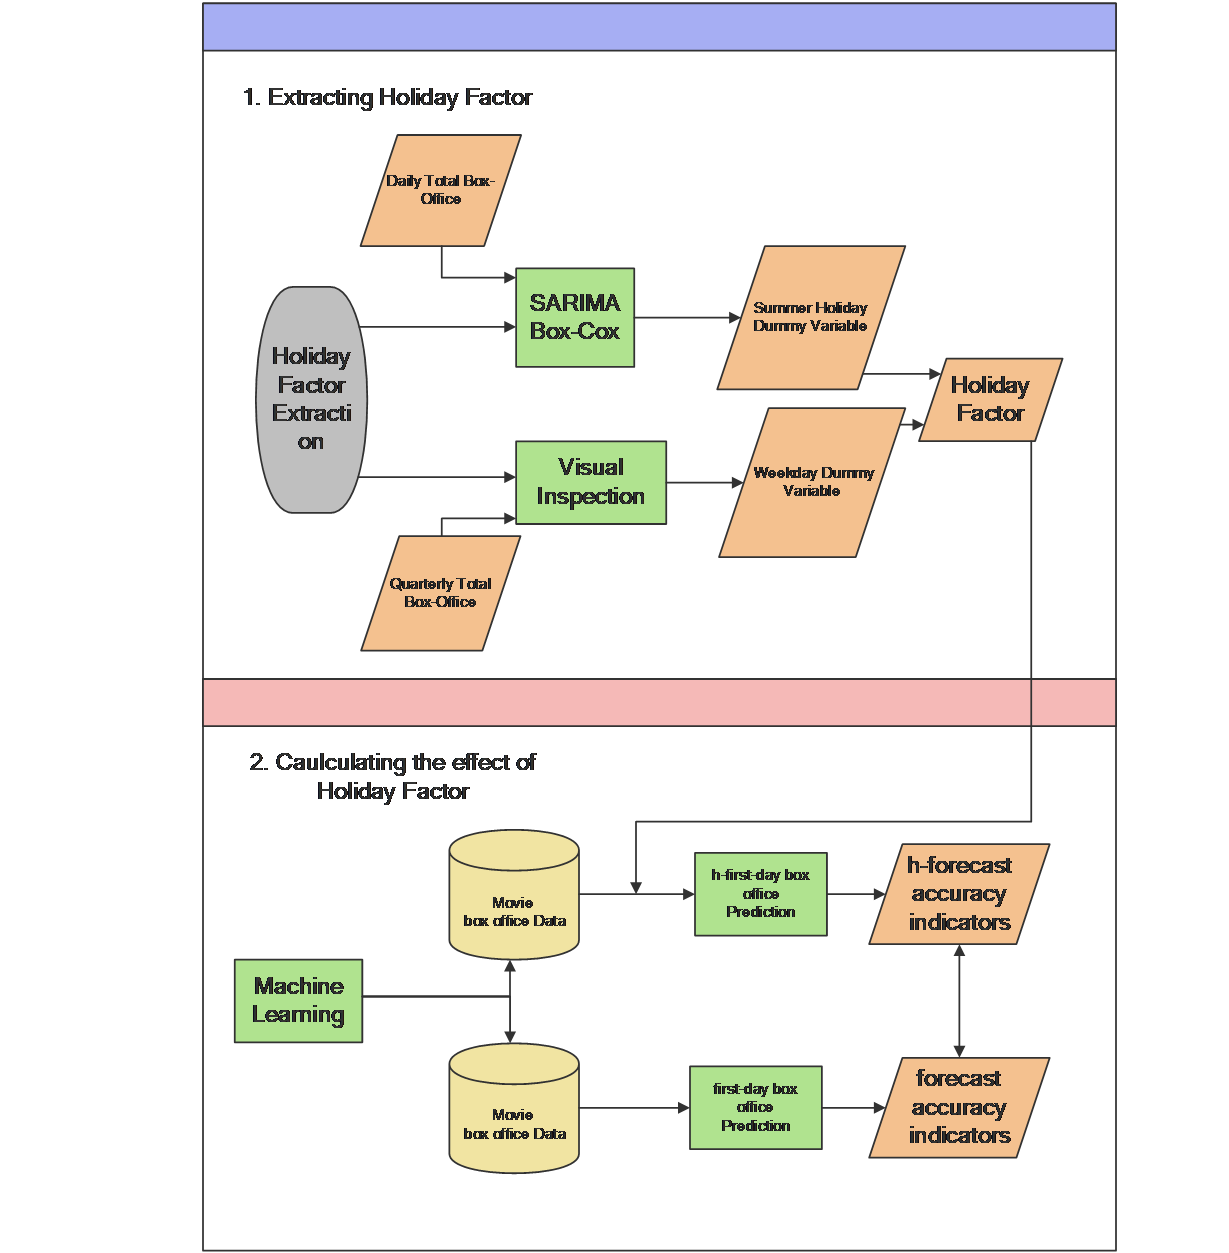
Figure 1. Method Processing Diagram
2.1. Exploration of the Holiday Factor
The exploration of the holiday factor involves two main parts: analyzing the time series of the daily total box office in the movie market and analyzing the time series of the quarterly total box office in the movie market. Through these two aspects, we extract two virtual variables to reflect the temporal differences in box office—namely, the difference in movie box office between weekdays and weekends and the difference in movie box office between summer vacation and non-summer vacation.
(a) Weekday Dummy Variable
The weekday dummy variable marks the difference in movie box office between weekends and weekdays. The study of time series has a relatively mature system, and Lim et al. analyzed and utilized a Time Fusion Transformer (TFT) for time series analysis [19]. We propose the SARIMA—Box-Cox model for fitting and capture this difference based on the fitting results. The SARIMA—Box-Cox model involves fitting the data transformed by Box-Cox using the SARIMA model. The fitted results are then reverse-transformed using Box-Cox to obtain the model for the original sequence. The core of this model is the SARIMA model and Box-Cox transformation.
The SARIMA model, Seasonal AutoRegressive Integrated Moving Average, is an ARIMA model that includes seasonal fluctuations. The ARIMA model combines AutoRegressive (AR), Moving Average (MA), and differencing. The formula for the ARIMA model is as follows:
\( {y_{t}}=μ+\sum _{i=1}^{p}{r_{i}}{y_{t-i}}+{ϵ_{t}}+\sum _{i=1}^{q}{θ_{i}}{ϵ_{t-i}} \) (1)
If the sequence \( {y_{t}} \) is non-stationary, it is necessary to difference the \( {y_{t}} \) by d orders to stabilize the sequence before fitting the model. In the formula, \( {r_{i}} \) represents the autoregressive model coefficients, \( {θ_{i}} \) represents the moving average model coefficients, and \( {ϵ_{t-i}} \) represents the error term at time point t-i.
For the SARIMA model, its mathematical logic is similar to the ARIMA model, but the expression is more complex.
\( \begin{matrix}(1-\sum _{i=1}^{p}{ϕ_{i}}{L^{i}}) & (1-\sum _{i=1}^{P}{Φ_{i}}{L^{mi}})(1-L{)^{d}}{(1-{L^{m}})^{D}}{y_{t}}={α_{0}}+(1+\sum _{i=1}^{q}{θ_{i}}{L^{i}})(1+\sum _{i=1}^{Q}{Θ_{i}}{L^{i}}){ε_{t}} \\ \end{matrix} \) (2)
Where, \( p \) is the non-seasonal autoregressive order, \( d \) is the non-seasonal differencing order, \( q \) is the non-seasonal moving average order, \( P \) is the seasonal autoregressive order, \( D \) is the seasonal differencing order, \( Q \) is the seasonal moving average order, \( {ϕ_{i}} and {Φ_{i}} \) are the autoregressive coefficients, \( {θ_{i}} \) and \( {Θ_{i}} \) are the moving average coefficients, L is the lag operator, m is the seasonal cycle, and \( {ε_{t}} \) is the white noise sequence. To fit this model, it is necessary to obtain key parameters \( p \) , \( d \) , \( q \) , \( P \) , \( D \) , \( Q \) , m.
Box-Cox transformation is a way to handle data, aiming to transform non-normally distributed data through Box-Cox transformation, which can make the data more normally distributed, avoid heteroscedasticity problems, and thus make statistical inferences more accurate and reliable, improving the predictive performance indicators of the model. Its expression is as follows:
\( {y^{(λ)}}=\begin{cases}\begin{matrix}\frac{{y^{λ}}-1}{λ}, & if λ≠0 \\ ln(y), & if λ=0 \\ \end{matrix}\end{cases} \) (3)
The parameter λ is calculated based on the time series \( {y_{t}} \) , generally maximizing the log-likelihood function of the time series. Once λ is obtained, data processing is carried out according to the above formula. The processed data is then input into the model to obtain the predicted data sequence \( [{y_{t}},{y_{t+k}}] \) . Subsequently, the data is inverse-transformed back to the original data, and predictive accuracy is calculated.
The application of the Box-Cox transformation in time series analysis models has matured. Bergmeir et al. introduced a new time series forecasting model, which, on the basis of the exponential smoothing model, incorporated bootstrap techniques. In terms of data processing, Box-Cox transformation and STL decomposition were used to divide the original time series into trend, seasonal, and residual components for fitting and prediction [20]. However, it should be noted that not all datasets experience improved predictive accuracy after Box-Cox transformation. As early as 1979, Nelson et al. found that when the Box-Cox transformation did not make the original sequence follow a normal distribution, this data processing method did not significantly improve the forecasting performance of the ARIMA model [21]. We observed that for fitting movie box office data, using Box-Cox transformation can effectively enhance the fitting performance of the SARIMA model. Therefore, we applied Box-Cox transformation to preprocess the original data.
(b) Summer Holiday Dummy Variable
The Summer Holiday dummy variable marks the difference in movie box office between summer holidays and non-summer holidays. We found that a time series plot at the quarterly level could intuitively capture this difference, i.e., using Visual Inspection to capture the difference in movie box office between summer holidays and non-summer holidays.
In summary, we have identified two dummy variables as part of the Holiday Factor, which will be incorporated into subsequent experiments.
2.2. Calculating the Effect of the Holiday Factor
To explore the impact of the Holiday Factor on the accuracy of the predictive model, we first need to construct the predictive model. Ahmad et al. analyzed 36 highly-cited academic papers related to movie box office prediction. They summarized the fitting evaluation methods and predictive models used in these papers, introduced and commented on each method and model, and provided research directions for subsequent studies [22]. Among these, we chose multiple linear regression (MLR), which appeared frequently, as the control group. For the experimental group, we selected random forest (RF), deep neural network (DNN), support vector machine regression (SVR), and Extreme Gradient Boosting (XGBoost, referred to as XGB below) to construct the predictive models. The introduction of the models is as follows:
(a) Multiple Linear Regression (MLR): Multiple Linear Regression is one of the simplest and most understandable models. The regression equation’s parameters represent the average impact of movie feature variables on the movie box office. Its expression is as follows:
\( {y_{i}}=α+\sum _{n=1}^{149}β_{dis}^{n}X_{dis,i}^{n}+\sum _{n=1}^{6}β_{MPAA}^{n}X_{MPAA,i}^{n}+\sum _{n=1}^{23}β_{gen}^{n}X_{gen,i}^{n}+σX_{time}+θ{X_{at}}+γ{X_{bud}}+ε \) (4)
Where, \( β_{dis}^{n} \) represents the impact ability on box office for each distributor, \( β_{MPAA}^{n} \) represents the impact ability on box office for each movie’s MPAA rating, \( β_{gen}^{n} \) represents the impact ability on box office for each movie genre, \( X_{time} \) represents the movie’s duration, \( {X_{at}} \) represents the number of cinemas playing the movie on its opening day, and \( {X_{bud}} \) represents the budget. Although this estimation is expected to have a considerable bias, it serves as the control group, providing a comparison for our other model results.
(b) Random Forest (RF): Random Forest is a classic algorithm that constructs multiple decision trees. When predicting a sample, it aggregates the predictions of each tree in the forest for that sample and selects the final result through a voting mechanism.
(c) Support Vector Machine Regression (SVR): SVR is a regression model using the Support Vector Machine (SVM) binary classification model. Its basic model is the maximum-margin linear classifier defined in the feature space. SVR’s learning strategy is maximizing the margin, formalized as solving a convex quadratic programming problem. It is also equivalent to minimizing the regularization of the hinge loss function, making SVM’s learning algorithm an optimization algorithm for solving convex quadratic programming problems.
(d) Deep Neural Network (DNN): A deep neural network is a fundamental algorithm in deep learning, an extension of the perceptron and sometimes referred to as a Multi-Layer Perceptron (MLP). It consists of input layers, hidden layers, and output layers.
(e) Extreme Gradient Boosting (XGB): XGBoost, proposed by Chen et al. is a relatively novel machine learning method based on Gradient Boosted Decision Trees (GBDT) [23]. It optimizes the loss function term based on GBDT, utilizing not only the first derivative but also the second derivative to enhance the accuracy of the loss function. Additionally, it includes a regularization term in the objective function to prevent overfitting issues in the model.
3. Experiment
First, data preprocessing is performed, followed by the formal experiments: the first part involves the process of implementing holiday factor exploration, and the second part involves implementing the process of calculating the effect of the Holiday Factor.
3.1. Dataset
In terms of the dataset, we utilized an existing movie dataset, “Daily Earnings Data for 3400 Movies,” available on the Kaggle website. This dataset was obtained by running a Python web scraping program on Box Office Mojo, extracting comprehensive data for 3400 movies from 2000 to 2020. The extracted movie features include the movie title, release date, total box office revenue, total budget, movie distributor, MPAA rating, duration, genre, daily box office revenue, and the number of cinemas where the movie was screened. Descriptive statistics for the aforementioned variables are shown in Table 1:
Table 1. Various Variables in the Data-set
Continuous variable | Minimum value | Mean value | Maximum value |
Daily earnings | 0 | 758827.5617 | 157461641 |
Active theatres | 1 | 1038.81584 | 4802 |
Total earnings | 266963 | 135455005 | 2797501328 |
Budget | 15000 | 54623431.73 | 356000000 |
Runtime | 39 | 108.6141176 | 252 |
Discrete variable | Number of variables | ||
Title | 3400 | ||
Distributor | 149 | ||
MPAA rating | 6 | ||
The movie’s genres | 23 |
3.2. Performance metrics
Whether it is the SARIMA model or machine learning prediction models, specific metrics are required to measure the accuracy of predictions. We utilized three metrics to assess prediction performance: Root Mean Square Error (RMSE), Mean Absolute Percentage Error (MAPE), and Symmetric Mean Absolute Percentage Error (SMAPE). The expressions for these three metrics are as follows:
(a) RMSE (Root Mean Square Error): RMSE measures the square of the difference between predicted values and true values. It is sensitive to outliers when assessing the deviation between predicted and true values. The formula is as follows:
\( RMSE=\sqrt[]{\frac{1}{n}\sum _{i=1}^{n}{({\overset{\text{^}}{y}_{i}}-{y_{i}})^{2}}} \) (5)
(b) MAPE (Mean Absolute Percentage Error): MAPE is a measure of relative error that uses absolute values to avoid cancellation of positive and negative errors. It is suitable for problems with significant differences in the dimensions of the target variable. The formula is as follows:
\( MAPE=\frac{100\%}{n}\sum _{i=1}^{n}|\frac{{\overset{\text{^}}{y}_{i}}-{y_{i}}}{{y_{i}}}| \) (6)
(c) SMAPE (Symmetric Mean Absolute Percentage Error): SMAPE addresses the asymmetry of MAPE by applying a larger penalty to negative errors (when predicted values are higher than actual values). The formula is as follows:
\( SMAPE=\frac{100\%}{n}\sum _{i=1}^{n}\frac{|{\overset{\text{^}}{y}_{i}}-{y_{i}}|}{(|{\overset{\text{^}}{y}_{i}}|+|{y_{i}}|)/2} \) (7)
3.3. Experimental preparation
There are two main steps in experimental preparation:
(a) Preprocessing of the original dataset: Due to the impact of the pandemic, movie data for 2019 and 2020 is found to be largely missing, and movie box office revenues experienced a sharp decline. Therefore, movies released in 2019 and 2020 were removed from the dataset. Additionally, to better highlight the characteristics of the fitting process, logarithmic transformation was applied to the movie box office revenues.
(b) Optimization of model selection: Ten randomly selected movies were chosen as the prediction set. The entire dataset, excluding the prediction set, was used as the experimental set. The model was first fitted using the experimental set, and then predictions were made for the prediction set, with subsequent calculation of deviations. The fitting results are shown in Figure 2 and Table 2.
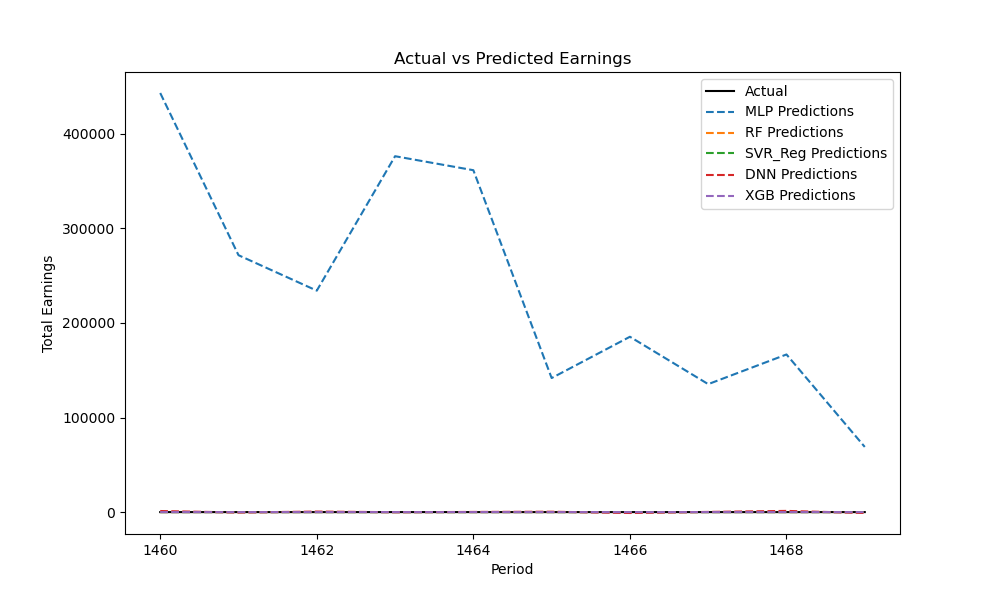
Figure 2. Fitting chart for the first-day box office of 10 movies
Table 2. Performance metrics for 10 movies’ predictions
Model | RMSE | MAPE(%) | SMAPE(%) |
DNN | 621.067156 | 4047.996 | 191.314794 |
MLR | 238428.4281 | 1555142 | 199.966159 |
RF | 0.47323 | 3.076728 | 3.090647 |
SVR_Reg | 0.79929 | 5.254448 | 5.368515 |
XGB | 0.61584 | 4.026522 | 4.077339 |
In Table 2, it shows that the fitting biases of MLR and DNN are excessively large, especially the bias of MLR is so significant that it shrinks other model data and the original data to an invisible scale, aligning with our expectation of poor performance in multiple linear regression predictions. Therefore, in the subsequent sections, MLR and DNN models will be excluded, and the fitting will proceed with the remaining three algorithms. Figure 3 shows the fitting results after excluding MLR:
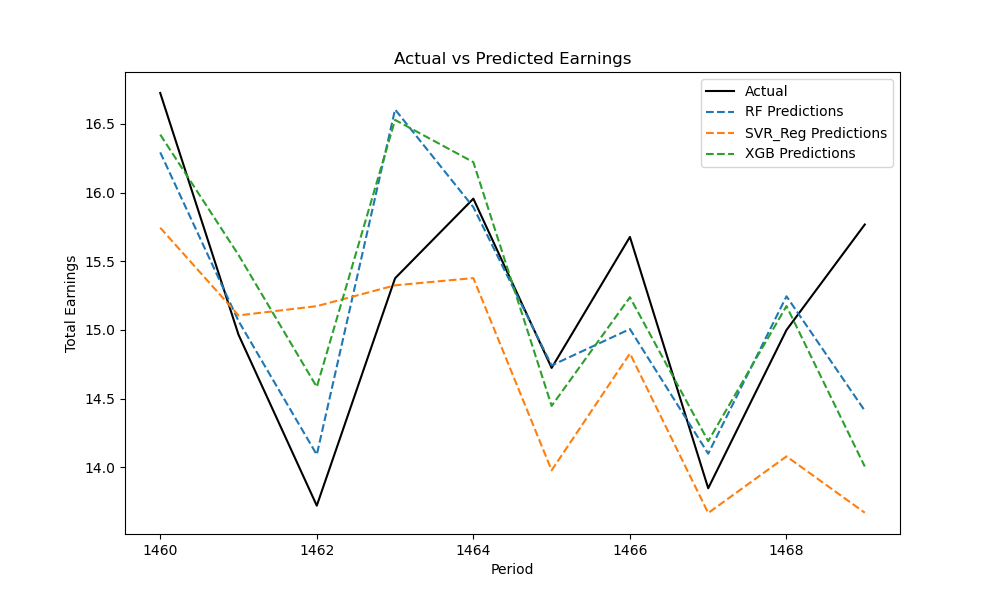
Figure 3. Fitting Chart for 10 Movies Excluding MLR and DNN
In Figure 3, there is a high degree of conformity between the predicted values (dashed line) and the actual values (solid line). Therefore, we affirm that the three effective algorithmic models, RF, SVR, and XGBoost, exhibit strong predictive capabilities for movie box office. Hence, we employ RF, DNN, and XGBoost for predictions.
3.4. Holiday Factor Extraction
We visualize the daily total box office of the movie market as a time series plot (as shown in Figure 4). Based on our experience and observations of Figure 4, we can speculate that there is periodicity in the daily total box office, implying the existence of peak and trough periods. Moreover, the distribution of peaks and troughs should follow a certain pattern. We term the observed distribution pattern of daily box office peaks as the “Holiday Factor.”
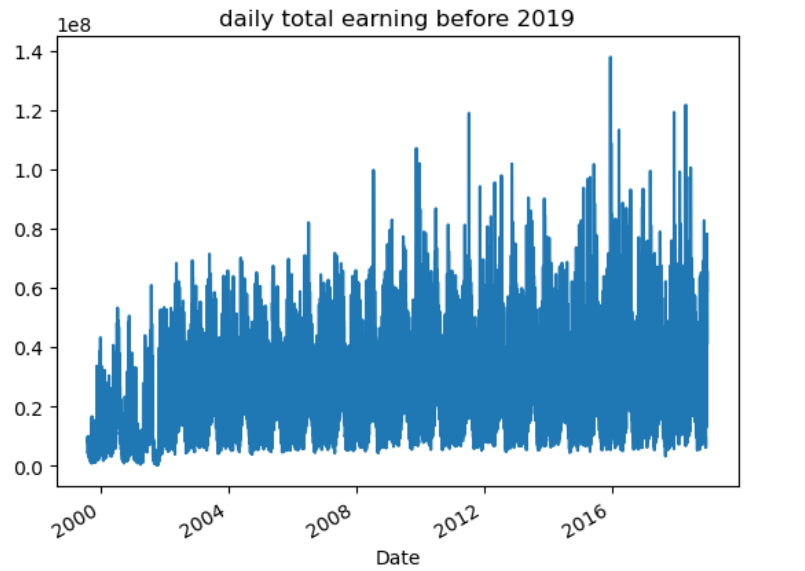
Figure 4. Time Series Plot of Daily Total Box Office
(a) Weekend and Weekday: Weekday Dummy Variable
To highlight the differences in box office between weekends and weekdays, we summed the daily total box office from 2000 to 2018. Subsequently, employing the combination of the Box-Cox transformation and SARIMA model as described earlier, we fitted a model to the daily total box office, identifying periodic fluctuations in box office through the determination of optimal parameters. The selection of parameters for time series models has been thoroughly discussed by several researchers. Arlt et al. provided an analysis of automating SARIMA parameter handling to enhance the accuracy and efficiency of model estimation, with practical model comparisons conducted on experimental datasets [24]. Paisit et al. proposed an automated method for identifying SARIMA model parameters using a convolutional neural network to analyze autocorrelation function (ACF) and partial autocorrelation function (PACF) plots of time series data, thus automating the process of obtaining SARIMA model parameters for time series prediction and analysis. This method outperformed parameter estimation based on maximum likelihood estimation using AIC in terms of precision, recall, and F1 score [25]. To improve the accuracy and efficiency of model fitting, we adopted an automated parameter acquisition approach using the ‘auto_arima’ package in Python for model fitting and prediction. This tool utilizes the AIC minimization principle to determine SARIMA model parameters.
We discussed the periodic parameter “ \( m \) ” of the SARIMA–Box-Cox model and found that the model fit was optimal when the periodic parameter m was set to 7. The Table 3 presents the best parameters corresponding to each cycle length “ \( m \) ” and the respective forecast performance indicators:
Table 3. Optimal Parameters and Forecast Performance for the Best Models
m | pdq | PDQ | MAPE |
1 | (4, 1, 3) | (0, 0, 0, 0) | 58.27% |
2 | (0, 1, 1) | (2, 0, 2, 2) | 81.06% |
3 | (2, 1, 2) | (2, 0, 2, 3) | 61.00% |
4 | (3, 1, 3) | (1, 0, 2, 4) | 56.58% |
5 | (4, 1, 2) | (2, 0, 2, 5) | 56.36% |
6 | (5, 1, 4) | (1, 0, 2, 6) | 58.30% |
7 | (0, 1, 1) | (1, 0, 2, 7) | 54.83% |
8 | (5, 1, 1) | (2, 0, 0, 8) | 58.69% |
9 | (5, 1, 1) | (2, 0, 0, 9) | 58.54% |
10 | (4, 1, 3) | (2, 0, 1, 10) | 57.21% |
11 | (5, 1, 1) | (2, 0, 1, 11) | 58.71% |
Using the parameters when m=7 to fit the original time series, the graph is shown below:
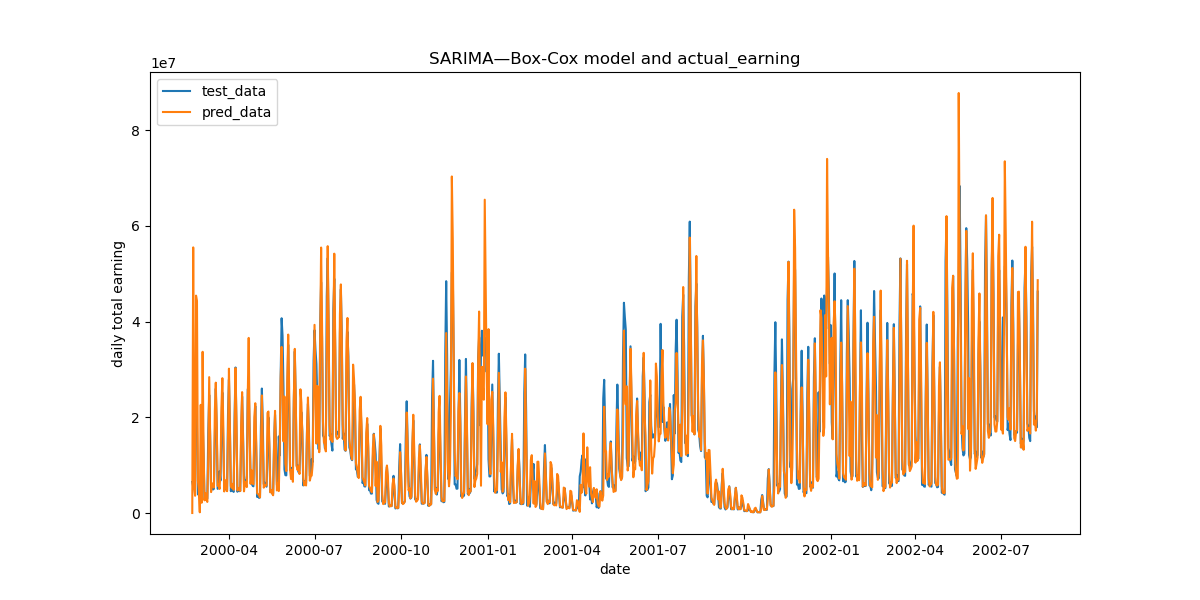
Figure 5. SARIMA—Box-Cox Model and Initial Data
As evident in the Figure 5, the model fitting is relatively robust with a high degree of accuracy. Consequently, we captured the first box office “Holiday Factor” — the daily total box office significantly increases on weekends and decreases noticeably on weekdays. This aligns with common knowledge, as people typically visit cinemas less on weekdays due to work or study commitments, while weekends provide more leisure time for movie attendance. Based on this, we introduced the “Weekday Dummy Variable” to indicate whether the movie premiered on a weekend.
(b) Summer Holiday and Non-Summer Holiday: Summer Holiday Dummy Variable
To capture the differences between summer and non-summer periods, we plotted the time series of the quarterly total box office in the movie market (as shown in Figure 6). Through visual inspection, we found that the total box office in Q3 (or Q2) of each year is higher than in the other three quarters. This phenomenon is due to most schools ending their academic year in mid-June and resuming classes at the end of August or early September. The impact of summer vacation also significantly influences box office performance. Therefore, we identified the second box office “Holiday Factor” — the total box office during summer vacation shows a significant increase, while the total box office during non-summer periods experiences a notable decrease. We introduced the “Summer Holiday Dummy Variable” to indicate whether the movie premiered during the summer vacation.
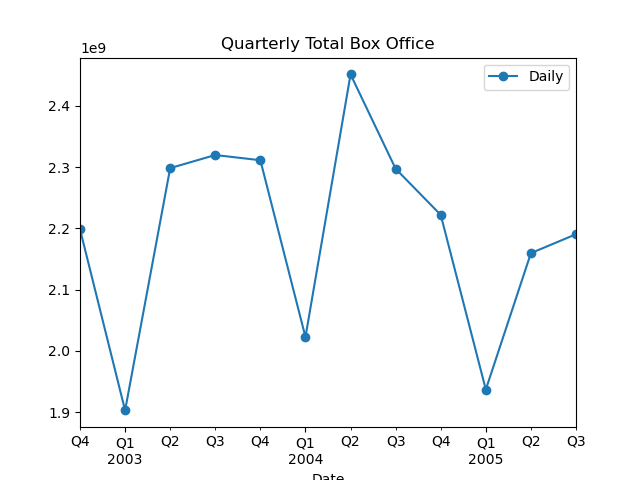
Figure 6. Quarterly Box Office Time Series
In summary, through time series analysis, we identified two “Holiday Factors” influencing movie box office: 1) Weekend or Weekday, and 2) Summer Holiday or Non-Summer Holiday. Based on these dimensions, we added two binary dummy variables to the dataset, indicating whether the movie premiered on a weekend and whether it was during the summer vacation. By comparing the predictive accuracy metrics of the first-day box office prediction models with and without these two dummy variables, we discussed the impact of Holiday Factors on the predictive performance of movie first-day box office prediction models.
3.5. Calculating the Effect of Holiday Factor
We refer to the dataset with added Holiday Factors as the experimental dataset and the dataset without these factors as the control dataset. Using the three predictive models obtained in the pre-experiment—RF, SVR, XGBoost—we conducted experiments on both the experimental and control datasets.
(a) Experiment on the Control Dataset
To comprehensively illustrate the impact of Holiday Factors on the prediction results, the data from the last 300 movies were used as the prediction group, and the data from all movies before the last 300 were used as the fitting group for model fitting and box office prediction. The prediction results for the control dataset are shown in Figure 7 and Table 4:
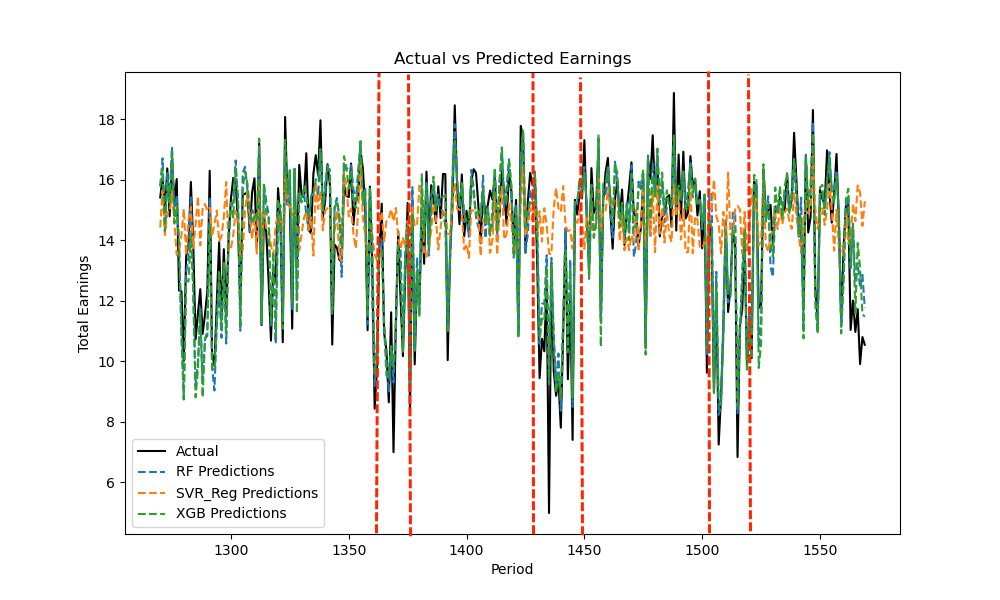
Figure 7. Prediction Results without Holiday Dummy Variables
Table 4. Without Holiday Dummy Variables
Model | RMSE | MAPE(%) | SMAPE(%) |
RF | 0.707772 | 5.551345 | 5.425978 |
SVR_Reg | 1.693651 | 14.99348 | 12.851193 |
XGB | 0.678773 | 5.300985 | 5.192068 |
From Figure 7 and Table 4, it shows that, in the long term, predictive models remain effective, especially RF and XGB, with high fitting accuracy. It is also noted that SVR’s predictive performance metrics have diverged significantly from RF and XGB, especially between the three red dashed lines. For movies with lower box office revenue, SVR struggles to predict the box office range, resulting in significant deviations. Hence, our emphasis is on discussing the RF and XGB prediction models.
(b) Experiment on the Experimental Dataset
Similar to the control dataset, the data from the last 300 movies were used as the prediction group, and the data from all movies before the last 300 were used as the fitting group for model fitting and box office prediction. The prediction results for the experimental dataset are shown in Figure 8 and Table 5:
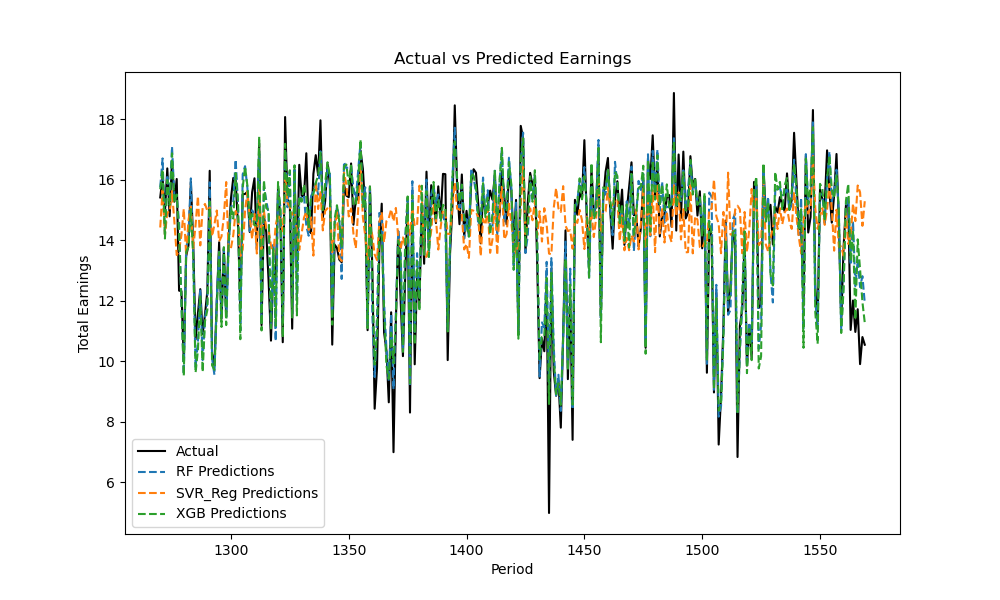
Figure 8. Prediction Results with Holiday Dummy Variables
Table 5. With Holiday Dummy Variables
Model | RMSE | MAPE(%) | SMAPE(%) |
h-RF | 0.62366 | 4.859522 | 4.715977 |
h-SVR_Reg | 1.693688 | 14.99375 | 12.851444 |
h-XGB | 0.588339 | 4.56557 | 4.460005 |
(c) Comparison of Experimental Dataset Results with Control Dataset Results
From Table 5, it shows that the predictive performance of RF and XGB improved after adding the holiday dummy variables, while SVR remained almost unchanged. Considering the experimental data presented earlier, we consider SVR as a relatively ineffective predictive model. Therefore, in our study, adding holiday dummy variables to effective predictive models can lead to an improvement in the predictive performance metrics. The specific improvement in predictive performance metrics is as follows:
Table 6. Improvement in Prediction Accuracy
Model | RMSE(%) | MAPE(%) | SMAPE(%) |
diff-RF | 13.486765 | 14.236435 | 15.055222 |
diff-XGB | 15.371086 | 16.107846 | 16.419344 |
Average | 14.4289255 | 15.1721405 | 15.737283 |
From Table 6, it shows that after adding holiday dummy variables, RMSE decreased on average by 14.429%, MAPE decreased by 15.172%, and SMAPE decreased by 15.737%. Therefore, we believe that adding holiday dummy variables can lead to an average reduction of 15.113% in predictive performance metrics, significantly enhancing the predictive performance of movie box office prediction models.
4. Conclusion
We proposed a first-day box office prediction method considering Holiday Factors. By fitting a SARIMA—Box-Cox model to the daily total box office data from 2000 to 2020, we identified two holiday factors: Weekend and Summer Holiday. We calculated the impact of including these two holiday factors on the accuracy of the first-day prediction models. The results show that incorporating holiday factors significantly improves the predictive accuracy of the models. The future research in box office prediction models should consider the influence of holiday factors and uncover additional holiday factors.
References
[1]. Ghiassi, M., Lio, D., & Moon, B. (2015). Pre-production forecasting of movie revenues with a dynamic artificial neural network. Expert Systems with Applications, 42(6), 3176–3193. 4, https://doi.org/10.1016/j.eswa.2014.11.022
[2]. Duan, J., Ding, X., & Liu, T. (2017). A Gaussian copula regression model for movie box-office revenues prediction. Sci. China Inf. Sci., 60(9), 092103. 9, https://doi.org/10.1007/s11432-015-0905-6
[3]. Ahmed, U., Waqas, H., & Afzal, M. T. (2020). Pre-production box-office success quotient forecasting. Soft Comput, 24(9), 6635–6653. 5, https://doi.org/10.1007/s00500-019-04303-w
[4]. Hung, Y.-C., & Guan, C. (2020). Winning box office with the right movie synopsis. EJM, 54(3), 594–614. 3, https://doi.org/10.1108/EJM-01-2019-0096
[5]. Wang, Z., Zhang, J., Ji, S., Meng, C., Li, T., & Zheng, Y. (2020). Predicting and ranking box office revenue of movies based on big data. Information Fusion, 60, 25–40. 8, https://doi.org/10.1016/j.inffus.2020.02.002
[6]. Sharma, A. S., Roy, T., Rifat, S. A., & Mridul, M. A. (2021). Presenting a Larger Up-to-Date Movie Dataset and Investigating the Effects of Pre-Released Attributes on Gross Revenue. Journal of Computer Science, 17(10), 870–888. 10, https://doi.org/10.3844/jcssp.2021.870.888
[7]. Agarwal, M., Venugopal, S., Kashyap, R., & Bharathi, R. (2021). A Comprehensive Study on Various Statistical Techniques for Prediction of Movie Success. In Machine Learning Techniques and Data Science (pp. 17–30). Academy and Industry Research Collaboration Center (AIRCC). 11, https://doi.org/10.5121/csit.2021.111802
[8]. Shahid, M., & Islam, M. A. (2021, December 9). Investigation of Time Series-Based Genre Popularity Features for Box Office Success Prediction. Rochester, NY, https://doi.org/10.2139/ssrn.3978721
[9]. Ni, Y., Dong, F., Zou, M., & Li, W. (2022). Movie Box Office Prediction Based on Multi-Model Ensembles. Information.
[10]. Velingkar, G., Varadarajan, R., Lanka, S., & M, A. K. (2022). Movie Box-Office Success Prediction Using Machine Learning. In 2022 Second International Conference on Power, Control and Computing Technologies (ICPC2T) (pp. 1–6). 3, IEEE. https://doi.org/10.1109/ICPC2T53885.2022.9776798
[11]. Leem, S., Oh, J., & Moon, J. (2023). Towards an Effective Over-The-Top Platform Service: A Machine Learning Approach for Box Office Analysis. In 2023 IEEE International Conference on Big Data and Smart Computing (BigComp) (pp. 413–416). 2, IEEE. https://doi.org/10.1109/BigComp57234.2023.00102
[12]. Mestyán, M., Yasseri, T., & Kertész, J. (2013). Early Prediction of Movie Box Office Success Based on Wikipedia Activity Big Data. PLOS ONE, 8(8), e71226. 8, https://doi.org/10.1371/journal.pone.0071226
[13]. Ma, H., Kim, J. M., & Lee, E. (2019). Analyzing dynamic review manipulation and its impact on movie box office revenue. Electronic Commerce Research and Applications, 35, 100840. 5, https://doi.org/10.1016/j.elerap.2019.100840.
[14]. Baek, H., Oh, S., Yang, H.-D., & Ahn, J. (2017). Electronic word-of-mouth, box office revenue and social media. Electronic Commerce Research and Applications, 22, 13–23. 3, https://doi.org/10.1016/j.elerap.2017.02.001
[15]. Ru, Y., Li, B., Liu, J., & Chai, J. (2018). An effective daily box office prediction model based on deep neural networks. Cognitive Systems Research, 52, 182–191. 12, https://doi.org/10.1016/j.cogsys.2018.06.018
[16]. Gopinath, S., Chintagunta, P. K., & Venkataraman, S. (2013). Blogs, Advertising, and Local-Market Movie Box Office Performance. Management Science, 59(12), 2635–2654. 12, https://doi.org/10.1287/mnsc.2013.1732
[17]. Wang, Y., Ru, Y., & Chai, J. (2019). Time series clustering based on sparse subspa1ce clustering algorithm and its application to daily box-office data analysis. Neural Comput & Applic, 31(9), 4809–4818. 9, https://doi.org/10.1007/s00521-018-3731-7
[18]. Wen, Q., Zhan, C., Gao, Y., Hu, X., Ngai, E., & Hu, B. (2020). Modeling Human Activity With Seasonality Bursty Dynamics. IEEE Transactions on Industrial Informatics, 16(2), 1130–1139. 2, https://doi.org/10.1109/TII.2019.2926885
[19]. Lim, B., Arık, S. Ö., Loeff, N., & Pfister, T. (2021). Temporal Fusion Transformers for interpretable multi-horizon time series forecasting. International Journal of Forecasting, 37(4), 1748–1764. 10, https://doi.org/10.1016/j.ijforecast.2021.03.012.
[20]. Bergmeir, C., Hyndman, R. J., & Benítez, J. M. (2016). Bagging exponential smoothing methods using STL decomposition and Box–Cox transformation. International Journal of Forecasting, 32(2), 303–312. 4, https://doi.org/10.1016/j.ijforecast.2015.07.002
[21]. Nelson, H. L., & Granger, C. W. J. (1979). Experience with using the Box-Cox transformation when forecasting economic time series. Journal of Econometrics, 10(1), 57–69. 4, https://doi.org/10.1016/0304-4076(79)90064-2
[22]. Ahmad, I. S., Bakar, A. A., Yaakub, M. R., & Muhammad, S. H. (2020). A Survey on Machine Learning Techniques in Movie Revenue Prediction. SN COMPUT. SCI., 1(4), 235. 7, https://doi.org/10.1007/s42979-020-00249-1
[23]. Chen, T., & Guestrin, C. (2016). XGBoost: A Scalable Tree Boosting System. In Proceedings of the 22nd ACM SIGKDD International Conference on Knowledge Discovery and Data Mining, 8, 785–794. https://doi.org/10.1145/2939672.2939785
[24]. Arlt, J., & Trcka, P. (2019). Automatic SARIMA modeling and forecast accuracy. Communications in Statistics - Simulation and Computation, 5.
[25]. Khanarsa, P., & Sinapiromsaran, K. (2020). Automatic SARIMA Order Identification Convolutional Neural Network. IJMLC, 10(5), 662–668. 10, https://doi.org/10.18178/ijmlc.2020.10.5.988
Cite this article
Kuang,X. (2024). Research on the prediction method of first-day box office considering the holiday factor. Applied and Computational Engineering,50,293-306.
Data availability
The datasets used and/or analyzed during the current study will be available from the authors upon reasonable request.
Disclaimer/Publisher's Note
The statements, opinions and data contained in all publications are solely those of the individual author(s) and contributor(s) and not of EWA Publishing and/or the editor(s). EWA Publishing and/or the editor(s) disclaim responsibility for any injury to people or property resulting from any ideas, methods, instructions or products referred to in the content.
About volume
Volume title: Proceedings of the 4th International Conference on Signal Processing and Machine Learning
© 2024 by the author(s). Licensee EWA Publishing, Oxford, UK. This article is an open access article distributed under the terms and
conditions of the Creative Commons Attribution (CC BY) license. Authors who
publish this series agree to the following terms:
1. Authors retain copyright and grant the series right of first publication with the work simultaneously licensed under a Creative Commons
Attribution License that allows others to share the work with an acknowledgment of the work's authorship and initial publication in this
series.
2. Authors are able to enter into separate, additional contractual arrangements for the non-exclusive distribution of the series's published
version of the work (e.g., post it to an institutional repository or publish it in a book), with an acknowledgment of its initial
publication in this series.
3. Authors are permitted and encouraged to post their work online (e.g., in institutional repositories or on their website) prior to and
during the submission process, as it can lead to productive exchanges, as well as earlier and greater citation of published work (See
Open access policy for details).
References
[1]. Ghiassi, M., Lio, D., & Moon, B. (2015). Pre-production forecasting of movie revenues with a dynamic artificial neural network. Expert Systems with Applications, 42(6), 3176–3193. 4, https://doi.org/10.1016/j.eswa.2014.11.022
[2]. Duan, J., Ding, X., & Liu, T. (2017). A Gaussian copula regression model for movie box-office revenues prediction. Sci. China Inf. Sci., 60(9), 092103. 9, https://doi.org/10.1007/s11432-015-0905-6
[3]. Ahmed, U., Waqas, H., & Afzal, M. T. (2020). Pre-production box-office success quotient forecasting. Soft Comput, 24(9), 6635–6653. 5, https://doi.org/10.1007/s00500-019-04303-w
[4]. Hung, Y.-C., & Guan, C. (2020). Winning box office with the right movie synopsis. EJM, 54(3), 594–614. 3, https://doi.org/10.1108/EJM-01-2019-0096
[5]. Wang, Z., Zhang, J., Ji, S., Meng, C., Li, T., & Zheng, Y. (2020). Predicting and ranking box office revenue of movies based on big data. Information Fusion, 60, 25–40. 8, https://doi.org/10.1016/j.inffus.2020.02.002
[6]. Sharma, A. S., Roy, T., Rifat, S. A., & Mridul, M. A. (2021). Presenting a Larger Up-to-Date Movie Dataset and Investigating the Effects of Pre-Released Attributes on Gross Revenue. Journal of Computer Science, 17(10), 870–888. 10, https://doi.org/10.3844/jcssp.2021.870.888
[7]. Agarwal, M., Venugopal, S., Kashyap, R., & Bharathi, R. (2021). A Comprehensive Study on Various Statistical Techniques for Prediction of Movie Success. In Machine Learning Techniques and Data Science (pp. 17–30). Academy and Industry Research Collaboration Center (AIRCC). 11, https://doi.org/10.5121/csit.2021.111802
[8]. Shahid, M., & Islam, M. A. (2021, December 9). Investigation of Time Series-Based Genre Popularity Features for Box Office Success Prediction. Rochester, NY, https://doi.org/10.2139/ssrn.3978721
[9]. Ni, Y., Dong, F., Zou, M., & Li, W. (2022). Movie Box Office Prediction Based on Multi-Model Ensembles. Information.
[10]. Velingkar, G., Varadarajan, R., Lanka, S., & M, A. K. (2022). Movie Box-Office Success Prediction Using Machine Learning. In 2022 Second International Conference on Power, Control and Computing Technologies (ICPC2T) (pp. 1–6). 3, IEEE. https://doi.org/10.1109/ICPC2T53885.2022.9776798
[11]. Leem, S., Oh, J., & Moon, J. (2023). Towards an Effective Over-The-Top Platform Service: A Machine Learning Approach for Box Office Analysis. In 2023 IEEE International Conference on Big Data and Smart Computing (BigComp) (pp. 413–416). 2, IEEE. https://doi.org/10.1109/BigComp57234.2023.00102
[12]. Mestyán, M., Yasseri, T., & Kertész, J. (2013). Early Prediction of Movie Box Office Success Based on Wikipedia Activity Big Data. PLOS ONE, 8(8), e71226. 8, https://doi.org/10.1371/journal.pone.0071226
[13]. Ma, H., Kim, J. M., & Lee, E. (2019). Analyzing dynamic review manipulation and its impact on movie box office revenue. Electronic Commerce Research and Applications, 35, 100840. 5, https://doi.org/10.1016/j.elerap.2019.100840.
[14]. Baek, H., Oh, S., Yang, H.-D., & Ahn, J. (2017). Electronic word-of-mouth, box office revenue and social media. Electronic Commerce Research and Applications, 22, 13–23. 3, https://doi.org/10.1016/j.elerap.2017.02.001
[15]. Ru, Y., Li, B., Liu, J., & Chai, J. (2018). An effective daily box office prediction model based on deep neural networks. Cognitive Systems Research, 52, 182–191. 12, https://doi.org/10.1016/j.cogsys.2018.06.018
[16]. Gopinath, S., Chintagunta, P. K., & Venkataraman, S. (2013). Blogs, Advertising, and Local-Market Movie Box Office Performance. Management Science, 59(12), 2635–2654. 12, https://doi.org/10.1287/mnsc.2013.1732
[17]. Wang, Y., Ru, Y., & Chai, J. (2019). Time series clustering based on sparse subspa1ce clustering algorithm and its application to daily box-office data analysis. Neural Comput & Applic, 31(9), 4809–4818. 9, https://doi.org/10.1007/s00521-018-3731-7
[18]. Wen, Q., Zhan, C., Gao, Y., Hu, X., Ngai, E., & Hu, B. (2020). Modeling Human Activity With Seasonality Bursty Dynamics. IEEE Transactions on Industrial Informatics, 16(2), 1130–1139. 2, https://doi.org/10.1109/TII.2019.2926885
[19]. Lim, B., Arık, S. Ö., Loeff, N., & Pfister, T. (2021). Temporal Fusion Transformers for interpretable multi-horizon time series forecasting. International Journal of Forecasting, 37(4), 1748–1764. 10, https://doi.org/10.1016/j.ijforecast.2021.03.012.
[20]. Bergmeir, C., Hyndman, R. J., & Benítez, J. M. (2016). Bagging exponential smoothing methods using STL decomposition and Box–Cox transformation. International Journal of Forecasting, 32(2), 303–312. 4, https://doi.org/10.1016/j.ijforecast.2015.07.002
[21]. Nelson, H. L., & Granger, C. W. J. (1979). Experience with using the Box-Cox transformation when forecasting economic time series. Journal of Econometrics, 10(1), 57–69. 4, https://doi.org/10.1016/0304-4076(79)90064-2
[22]. Ahmad, I. S., Bakar, A. A., Yaakub, M. R., & Muhammad, S. H. (2020). A Survey on Machine Learning Techniques in Movie Revenue Prediction. SN COMPUT. SCI., 1(4), 235. 7, https://doi.org/10.1007/s42979-020-00249-1
[23]. Chen, T., & Guestrin, C. (2016). XGBoost: A Scalable Tree Boosting System. In Proceedings of the 22nd ACM SIGKDD International Conference on Knowledge Discovery and Data Mining, 8, 785–794. https://doi.org/10.1145/2939672.2939785
[24]. Arlt, J., & Trcka, P. (2019). Automatic SARIMA modeling and forecast accuracy. Communications in Statistics - Simulation and Computation, 5.
[25]. Khanarsa, P., & Sinapiromsaran, K. (2020). Automatic SARIMA Order Identification Convolutional Neural Network. IJMLC, 10(5), 662–668. 10, https://doi.org/10.18178/ijmlc.2020.10.5.988