


1. Introduction
The intersection of machine learning (ML) with the field of finance has initiated a paradigm shift in how portfolios are optimized, moving beyond the traditional frameworks to embrace more dynamic and data-driven approaches. Traditional financial models like the Capital Asset Pricing Model (CAPM) and the Arbitrage Pricing Theory (APT) have been instrumental in shaping investment strategies, focusing on the relationship between risk and return. However, the complexities and rapid changes in today's financial markets call for more advanced methodologies that can adapt to and anticipate market movements with greater precision. This paper explores the integration of ML techniques with traditional financial models, aiming to enhance the efficacy of portfolio optimization. By employing regression analysis for asset return prediction, classification algorithms for risk assessment, and reinforcement learning for dynamic portfolio adjustment, this study underscores the potential of ML to revolutionize investment strategies. Additionally, we delve into the significance of big data in improving the accuracy of predictions and discuss the application of sophisticated optimization algorithms in determining optimal asset allocations. The fusion of ML with traditional financial theories not only refines existing models but also opens new avenues for research and application in financial analytics [1]. This introduction sets the stage for a detailed exploration of how ML can be synergistically combined with established financial concepts to achieve superior portfolio optimization outcomes.
2. Machine Learning Models for Portfolio Optimization
2.1. Regression Analysis in Predicting Asset Returns
Regression analysis serves as a cornerstone in the predictive analytics of financial markets, enabling investors to forecast future asset returns with higher accuracy. Linear regression, through its simplicity and ease of interpretation, allows for the estimation of asset returns by assessing the linear relationship between a set of independent variables—such as macroeconomic indicators (GDP growth rate, interest rates, inflation), as shown in Figure 1, company-specific metrics (earnings per share, revenue growth), and market sentiment indices—and the dependent variable, which is the return on the asset.
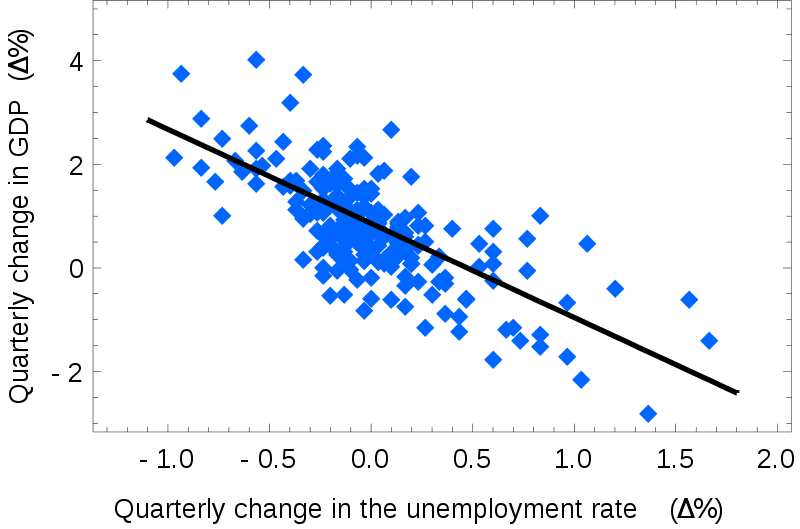
Figure 1. Simple linear regression (Source:Wikipedia)
For instance, by applying linear regression, an analyst can quantify how changes in the Federal Reserve's interest rate affect the stock market returns, providing a basis for strategic asset allocation. On the other hand, logistic regression, a type of regression analysis used for binary outcomes, is adept at forecasting the probability of an asset's return exceeding a specific threshold, thus classifying it into 'profitable' or 'not profitable' categories [2]. This method is particularly useful in the risk management process, enabling investors to assess the likelihood of achieving a minimum desired return on an investment. The application of regression analysis in portfolio optimization is not without its challenges; it requires careful selection of independent variables and an understanding of the assumptions underlying the regression models. Issues such as multicollinearity, where independent variables are highly correlated, and overfitting, where the model captures the noise rather than the underlying pattern in the data, need to be addressed. Techniques such as ridge and lasso regression are employed to mitigate these issues, enhancing the model's predictive performance and reliability.
2.2. Classification Algorithms for Risk Assessment
Classification algorithms, including Support Vector Machines (SVM) and Decision Trees, have proven to be powerful tools in categorizing assets based on risk. SVM, through its ability to find the hyperplane that best separates different classes in the dataset, can classify assets into varying risk categories. For example, an SVM model can be trained on historical data to classify stocks into 'high', 'medium', or 'low' risk categories based on features like volatility, beta (a measure of an asset's volatility in relation to the market), and financial ratios such as the debt-to-equity ratio [3]. Decision Trees, another popular classification method, offer an intuitive and visual approach to decision-making by breaking down a dataset into smaller subsets while at the same time developing an associated decision tree. Investors can use Decision Trees to assess the risk profile of different assets by examining various criteria, such as past returns, company fundamentals, and economic indicators, thus facilitating a more tailored portfolio construction process that aligns with their risk appetite. The effectiveness of classification algorithms in risk assessment is greatly enhanced by their ability to handle non-linear relationships and their flexibility in dealing with a wide range of data types. However, their success is contingent upon the quality and relevance of the input data, as well as the proper tuning of model parameters to avoid overfitting. Moreover, ensemble methods like Random Forests, which combine multiple decision trees to improve classification accuracy and robustness, are increasingly used to overcome the limitations of individual models [4].
2.3. Reinforcement Learning for Dynamic Portfolio Adjustment
Reinforcement Learning (RL) represents a paradigm shift in portfolio optimization by focusing on learning optimal strategies through interaction with the market environment. RL algorithms, such as Q-learning and Deep Q-Networks (DQN), aim to maximize a cumulative reward function, which, in the context of portfolio management, could be the total return or the Sharpe ratio of the portfolio. By continuously learning from market actions and their outcomes, RL models can dynamically adjust asset allocations in response to changing market conditions. An RL model might start with a basic strategy of asset allocation and, through trial and error, learn the impact of various allocation decisions on portfolio performance. For example, in a volatile market, the RL algorithm might learn to reduce exposure to high-risk assets to preserve capital, while in a bullish market, it might increase allocation to equities to maximize returns [5]. The key advantage of RL over static models is its ability to adapt and optimize strategies over time without being explicitly programmed to follow predetermined rules. The application of RL in portfolio optimization is complex and requires substantial computational resources, particularly for Deep Learning-based methods that involve processing large amounts of data to train neural networks.
The RL algorithm aims to optimize \( {A_{t}} \) over time to maximize cumulative rewards. The decision rule for updating \( {A_{t}} \) can be abstractly represented as follows:
\( {A_{t}}={arg{max}_{A}}U(A,{S_{t}}) \) (1)
where \( U(A,{S_{t}})=E[R(A,{S_{t+1}}|{S_{t}})] \) , indicating the expected reward of choosing allocation \( A \) given the current state \( {S_{t}} \) .
The adaptability of the RL algorithm in different market conditions (volatile or bullish) can be further incorporated by adjusting \( U(A,{S_{t}}) \) to account for these conditions explicitly. For example:
In a volatile market, U might prioritize minimizing variance in R, leading to more conservative allocations \( {A_{t}} \) . In a bullish market, U might emphasize maximizing expected returns, leading to more aggressive allocations to equities in \( {A_{t}} \) .
Despite these challenges, the potential rewards of implementing RL in investment strategies are significant, offering the promise of superior returns and enhanced risk management through dynamic and adaptive portfolio adjustments [6]. The success of RL models hinges on the careful design of the reward function and the selection of relevant state and action spaces that accurately reflect the decision-making process in portfolio management.
3. Quantitative Analysis and Mathematical Models
3.1. Optimization Algorithms and Their Applications
Optimization algorithms are fundamental to machine learning and play a pivotal role in the sphere of portfolio optimization. Specifically, Gradient Descent and Genetic Algorithms are two primary techniques that stand out for their capacity to navigate through complex, multidimensional datasets to find the most efficient asset allocations. Gradient Descent, a first-order iterative optimization algorithm, is crucial for minimizing the cost function in many machine learning models. In the context of portfolio optimization, the cost function could be the negative of the Sharpe Ratio or the portfolio's variance, where the aim is to maximize the Sharpe Ratio (a measure of risk-adjusted return) or minimize the portfolio's risk. The algorithm adjusts its parameters iteratively to move towards the minimum of the cost function. For instance, applying Gradient Descent to optimize a portfolio involves iteratively adjusting the weights of assets in the portfolio to find the combination that offers the highest Sharpe Ratio. This process involves calculating the gradient of the cost function with respect to each weight, then updating the weights in the direction that most rapidly decreases the cost.
Genetic Algorithms, inspired by the process of natural selection, are search heuristics that mimic the process of natural evolution. This algorithm reflects the survival of the fittest among individual solutions over generations. For portfolio optimization, each "individual" in the population could represent a different set of portfolio weights. The fitness of each individual is determined by how well the portfolio performs, measured by its Sharpe Ratio or by minimizing Value at Risk (VaR). Genetic Algorithms select the best-performing portfolios to produce "offspring" for the next generation, combining and mutating them to explore a broad range of possibilities [7]. Over successive generations, the algorithm converges on a set of portfolio weights that optimize the desired performance metric.
Both Gradient Descent and Genetic Algorithms are powerful tools in identifying optimal asset allocations, offering nuanced insights that traditional portfolio theory may miss. Their effectiveness lies in their ability to process vast amounts of data and to find global optima in complex, nonlinear optimization problems, thereby maximizing the Sharpe Ratio or minimizing Value at Risk (VaR) in a portfolio.
3.2. The Role of Big Data in Enhancing Predictive Accuracy
The advent of Big Data has markedly transformed the landscape of financial analysis, enabling a deeper, more nuanced understanding of market dynamics. Big Data refers to the enormous volumes of data that are too complex for traditional data-processing software, encompassing a wide array of information from market transactions, social media, news reports, and economic indicators. Machine learning algorithms thrive on this wealth of data, leveraging their computational power to uncover intricate patterns and correlations that may not be apparent to human analysts.Quantitative methods, such as time-series analysis, natural language processing (NLP), and complex network analysis, are employed to process and analyze this data. The traditional CAPM model is represented by the formula:
\( E({R_{i}})={R_{f}}+{β_{i}}(E({R_{m}})-{R_{f}}) \) (2)
where:
\( E({R_{i}}) \) is the expected return of the investment, \( {R_{f}} \) is the risk-free rate, \( E({R_{m}}) \) is the expected return of the market, \( {β_{i}} \) is the beta of the investment, indicating its sensitivity to market movements.
Incorporating machine learning, we can redefine \( {β_{i}} \) to account for a broader range of variables, thereby providing a more nuanced understanding of an asset's systematic risk. The machine learning-enhanced beta, \( {{β_{i}}_{M L}} \) , could be determined through a regression model that includes not only the market return but also other relevant macroeconomic and market variables such as GDP growth rates, interest rates, inflation rates, and even sentiment indices derived from textual analysis of financial news:
\( {β_{i,M,L}}=f(∆GDP,∆InterestRates,∆Inflation,SentimentIndex,…,E({R_{m}})) \) (3)
Thus, the CAPM formula, enhanced by machine learning, becomes:
\( {E({R_{i}})_{ML}}={R_{f}}+{{β_{i}}_{M L}}(E({R_{m}})-{R_{f}}) \) (4)
where:
\( {{β_{i}}_{M L}} \) is the machine learning-enhanced beta, calculated by considering a wider array of inputs beyond just market return, to more accurately reflect the systematic risk associated with the investment.
Time-series analysis, for example, examines the sequence of data points (such as stock prices) to identify trends, cycles, and seasonal variations. Machine learning models can then use these findings to predict future market movements with greater accuracy [8]. NLP allows for the analysis of unstructured data, such as financial news and reports, to gauge market sentiment or to detect events that could influence asset prices. Complex network analysis reveals the interdependencies among different assets or markets, helping investors understand systemic risks and the potential for contagion in times of market stress.
The integration of Big Data with machine learning algorithms significantly enhances the predictive accuracy of investment strategies. By analyzing vast datasets, these algorithms can identify subtle, previously unrecognized patterns, leading to more informed and nuanced investment decisions. This capability not only improves the precision of asset price predictions but also enables a more sophisticated assessment of risk, thereby enhancing the overall efficiency of the investment process.
3.3. Integrating Machine Learning with Traditional Financial Models
The fusion of machine learning techniques with traditional financial models marks a significant evolution in the field of portfolio optimization. Traditional models, such as the Capital Asset Pricing Model (CAPM) and the Arbitrage Pricing Theory (APT), have long provided the theoretical underpinnings for understanding risk and return in financial markets. CAPM, for instance, offers insights into the relationship between the expected return of an asset and its market risk, encapsulated by beta. APT, on the other hand, suggests that multiple factors influence an asset's return, beyond the market risk alone. Integrating machine learning with these traditional models enhances their applicability and precision. For example, machine learning can refine the estimation of beta in the CAPM model by incorporating a wider range of market and macroeconomic variables, thus offering a more dynamic and accurate measure of systematic risk. Similarly, machine learning techniques can identify and weigh multiple risk factors in the APT model more effectively, adapting to changes in market conditions in real-time. Table 1 and Table 2 showcase how ML integration can provide a more nuanced view of risk and return for portfolio optimization [9].
Table 1. Comparative Analysis of Traditional vs. Machine Learning-Enhanced CAPM Beta Estimation
Model Feature | Traditional CAPM Model | ML-Enhanced CAPM Model |
Beta Estimation | Uses historical returns of the asset and the market to estimate beta, reflecting market risk exposure. | Incorporates a wider array of variables (e.g., GDP growth, interest rates) using ML techniques for beta estimation, offering a dynamic measure of systematic risk. |
Data Utilized | Market return, risk-free rate, asset return. | Market return, risk-free rate, asset return, macroeconomic indicators, sentiment indices. |
Precision in Risk Measure | Moderate — based on historical market data and assumes a linear relationship. | High — leverages complex, non-linear relationships and real-time data for a more accurate systematic risk measure. |
Table 2. Enhancing APT Risk Factor Analysis: A Traditional vs. Machine Learning Approach
Model Feature | Traditional APT Model | ML-Enhanced APT Model |
Risk Factors Identification | Identifies multiple risk factors (inflation, GDP growth, etc.) affecting an asset's return. | Uses ML to dynamically identify and weigh risk factors based on current and historical data, adapting to market changes. |
Data Utilized | Selected macroeconomic variables based on theory. | Broad range of macroeconomic variables, real-time market data, sentiment analysis, etc. |
Adaptability to Market Changes | Low — static identification and weighting of risk factors. | High — continuously updates the weighting of risk factors, improving adaptability to market conditions. |
Furthermore, machine learning algorithms can be employed to test the assumptions underlying these traditional models, such as the normal distribution of returns or the efficiency of markets. By analyzing historical data, machine learning can uncover instances where these assumptions may not hold, thereby providing a more nuanced understanding of market behaviors and asset price dynamics [10].
The integration of machine learning with traditional financial models offers a comprehensive framework for portfolio optimization, combining the predictive power and adaptability of machine learning with the economic rationale of traditional theories. This synergy not only enhances the robustness of investment strategies but also paves the way for innovative approaches to managing risk and maximizing returns in the complex and ever-evolving financial markets.
4. Conclusion
The integration of machine learning (ML) with traditional financial models marks a significant milestone in the evolution of portfolio optimization strategies. This paper has demonstrated how ML techniques can enhance the analytical capabilities of traditional models such as CAPM and APT, offering a more dynamic and precise approach to investment management. Through the application of regression analysis, classification algorithms, and reinforcement learning, we have shown the potential for improved prediction of asset returns, more nuanced risk assessments, and adaptive portfolio adjustments. The role of big data in augmenting predictive accuracy further underscores the value of ML in navigating the complexities of modern financial markets. Our exploration of optimization algorithms like Gradient Descent and Genetic Algorithms highlights the advancements in achieving optimal asset allocations. As the financial industry continues to evolve, the fusion of ML with traditional financial theories not only promises enhanced investment outcomes but also paves the way for continued innovation in portfolio management practices.
References
[1]. Gunjan, Abhishek, and Siddhartha Bhattacharyya. "A brief review of portfolio optimization techniques." Artificial Intelligence Review 56.5 (2023): 3847-3886.
[2]. Freitas, Washington Burkart, and João Roberto Bertini Junior. "Random walk through a stock network and predictive analysis for portfolio optimization." Expert Systems with Applications (2023): 119597.
[3]. Gonzalez-Salazar, Miguel, et al. "Portfolio optimization in district heating: Merit order or mixed integer linear programming?." Energy 265 (2023): 126277.
[4]. Erwin, Kyle, and Andries Engelbrecht. "Multi-Guide Set-Based Particle Swarm Optimization for Multi-Objective Portfolio Optimization." Algorithms 16.2 (2023): 62.
[5]. ElSayed, Nuha A., et al. "10. Cardiovascular disease and risk management: standards of care in diabetes—2023." Diabetes Care 46.Supplement_1 (2023): S158-S190.
[6]. Melinda, Eka, and Segaf Segaf. "Implementation of risk management in murabahah financing at bmt ugt nusantara nusantara pasuruan." Enrichment: Journal of Management 13.2 (2023): 914-920.
[7]. Wahyuni, Sandiani Sri, et al. "Mapping Research Topics on Risk Management in Sharia and Conventional Financial Institutions: VOSviewer Bibliometric Study and Literature Review." (2023).
[8]. Algarvio, Hugo. "Risk-Sharing Contracts and risk management of bilateral contracting in electricity markets." International Journal of Electrical Power & Energy Systems 144 (2023): 108579.
[9]. Ricardianto, P., et al. "Enterprise risk management and business strategy on firm performance: The role of mediating competitive advantage." Uncertain Supply Chain Management 11.1 (2023): 249-260.
[10]. VenkateswaraRao, M., et al. "Credit Investigation and Comprehensive Risk Management System based Big Data Analytics in Commercial Banking." 2023 9th International Conference on Advanced Computing and Communication Systems (ICACCS). Vol. 1. IEEE, 2023.
Cite this article
Huang,S. (2024). Advancing portfolio optimization: The convergence of machine learning and traditional financial models. Applied and Computational Engineering,57,206-211.
Data availability
The datasets used and/or analyzed during the current study will be available from the authors upon reasonable request.
Disclaimer/Publisher's Note
The statements, opinions and data contained in all publications are solely those of the individual author(s) and contributor(s) and not of EWA Publishing and/or the editor(s). EWA Publishing and/or the editor(s) disclaim responsibility for any injury to people or property resulting from any ideas, methods, instructions or products referred to in the content.
About volume
Volume title: Proceedings of the 6th International Conference on Computing and Data Science
© 2024 by the author(s). Licensee EWA Publishing, Oxford, UK. This article is an open access article distributed under the terms and
conditions of the Creative Commons Attribution (CC BY) license. Authors who
publish this series agree to the following terms:
1. Authors retain copyright and grant the series right of first publication with the work simultaneously licensed under a Creative Commons
Attribution License that allows others to share the work with an acknowledgment of the work's authorship and initial publication in this
series.
2. Authors are able to enter into separate, additional contractual arrangements for the non-exclusive distribution of the series's published
version of the work (e.g., post it to an institutional repository or publish it in a book), with an acknowledgment of its initial
publication in this series.
3. Authors are permitted and encouraged to post their work online (e.g., in institutional repositories or on their website) prior to and
during the submission process, as it can lead to productive exchanges, as well as earlier and greater citation of published work (See
Open access policy for details).
References
[1]. Gunjan, Abhishek, and Siddhartha Bhattacharyya. "A brief review of portfolio optimization techniques." Artificial Intelligence Review 56.5 (2023): 3847-3886.
[2]. Freitas, Washington Burkart, and João Roberto Bertini Junior. "Random walk through a stock network and predictive analysis for portfolio optimization." Expert Systems with Applications (2023): 119597.
[3]. Gonzalez-Salazar, Miguel, et al. "Portfolio optimization in district heating: Merit order or mixed integer linear programming?." Energy 265 (2023): 126277.
[4]. Erwin, Kyle, and Andries Engelbrecht. "Multi-Guide Set-Based Particle Swarm Optimization for Multi-Objective Portfolio Optimization." Algorithms 16.2 (2023): 62.
[5]. ElSayed, Nuha A., et al. "10. Cardiovascular disease and risk management: standards of care in diabetes—2023." Diabetes Care 46.Supplement_1 (2023): S158-S190.
[6]. Melinda, Eka, and Segaf Segaf. "Implementation of risk management in murabahah financing at bmt ugt nusantara nusantara pasuruan." Enrichment: Journal of Management 13.2 (2023): 914-920.
[7]. Wahyuni, Sandiani Sri, et al. "Mapping Research Topics on Risk Management in Sharia and Conventional Financial Institutions: VOSviewer Bibliometric Study and Literature Review." (2023).
[8]. Algarvio, Hugo. "Risk-Sharing Contracts and risk management of bilateral contracting in electricity markets." International Journal of Electrical Power & Energy Systems 144 (2023): 108579.
[9]. Ricardianto, P., et al. "Enterprise risk management and business strategy on firm performance: The role of mediating competitive advantage." Uncertain Supply Chain Management 11.1 (2023): 249-260.
[10]. VenkateswaraRao, M., et al. "Credit Investigation and Comprehensive Risk Management System based Big Data Analytics in Commercial Banking." 2023 9th International Conference on Advanced Computing and Communication Systems (ICACCS). Vol. 1. IEEE, 2023.