


1. Introduction
Tourist attractions are the material carriers of tourism supply, and are an important part of the tourism industry. Many national and international scholars have carried out researches, in China, Cheng Haifeng et al. researched the spatial structure of ATAs (A-level tourist attractions) in Chizhou City, and determined their SD (spatial distribution) structure from the whole and the region [1]; Zhu Hong, Chen Xiaoliang, et al. summed up the characteristics of the SD of the Grade A tourist resources in China, and analyzed the causes of the status quo of its spatial pattern [2]. Song Jinping et al. Analyzed the spatial structure characteristics and evolution law of ATAs in Beijing [3]. Yuan Jun and Yu Ruilin analyzed the spatial structure of national ATAs in Wuhan City Circle [4]. Zhang Zhenpeng studied the SD characteristics of tourist attractions in China [5]. On the whole, the studies are rich in content and the research methods tend to be mature, but most of the studies stay at the macro level and require in-depth research. This paper deeply analyses the current situation of ATAs in Yunnan Province, and provides some scientific basis and suggestions for the optimization of the spatial structure of tourist attractions in Yunnan Province.
2. Overview of the study area
In Yunnan province, complex terrain to mountain plateau is dominated by the complex climate, both low-latitude climate, monsoon climate, mountainous climate characteristics, four seasons like spring. Yunnan Province has spectacular natural scenery, unique and rare ethnic minority folk customs, and abundant tourism resources. According to the Yunnan Provincial Tourism Development Commission on 29 December 2022 released scenic spot directory shows that there are 561 ATAs in Yunnan Province, of which, there are 9 5A-class scenic spots, accounting for 1.60%; 158 4A scenic spots, accounting for 28.16%; 304 3A scenic spots, accounting for 54.19%; 78 2A scenic spots, accounting for 13.90%; and 12 1A scenic spots, accounting for 2.14%. Among them, 4A, 3A and 2A scenic spots take the absolute advantage in quantity [6] (Figure 1).
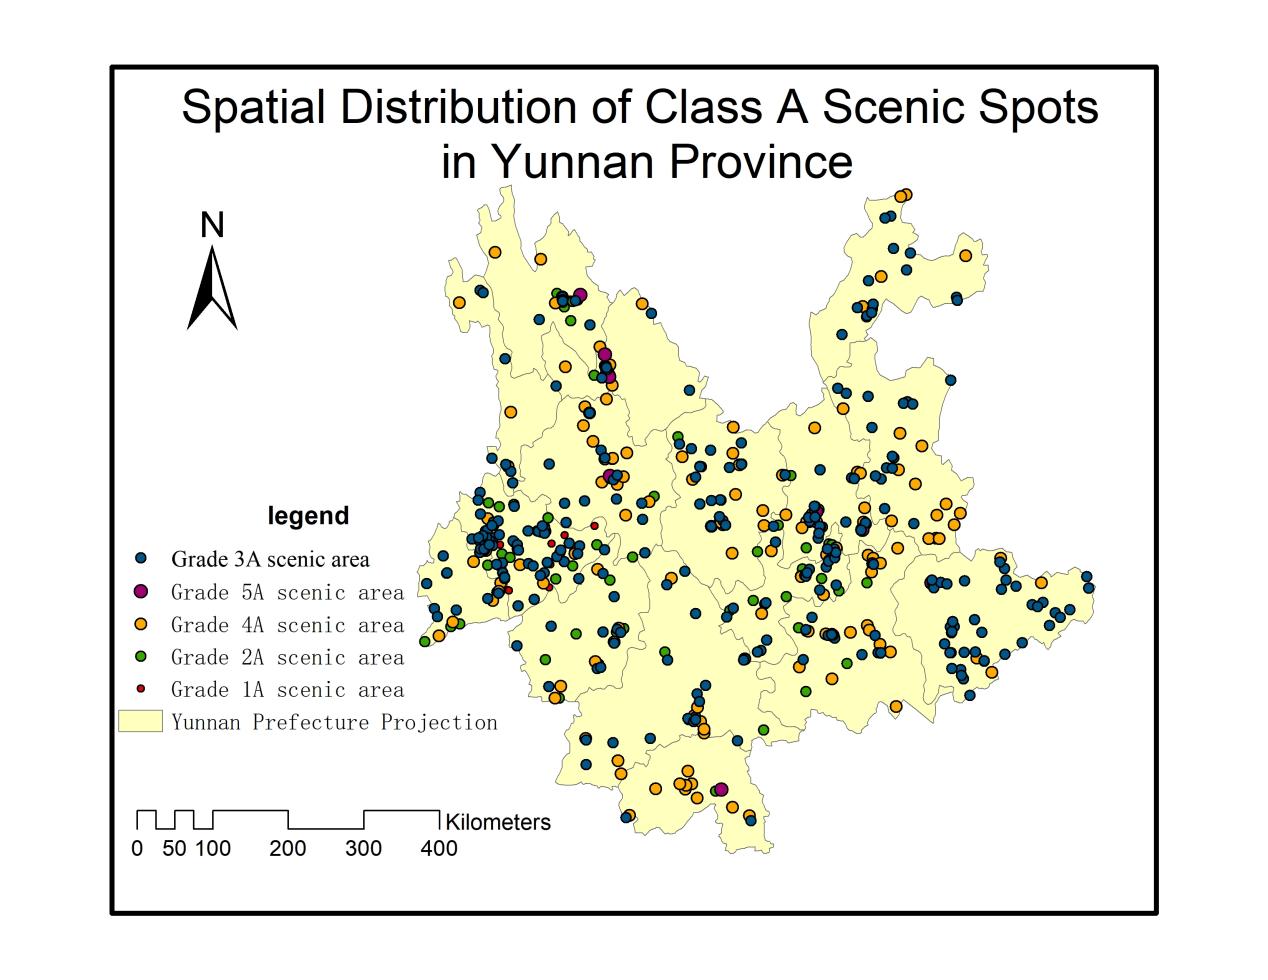
Figure 1. SD of A-grade scenic spots in Yunnan Province.
3. Data sources and research methodology
3.1. Data sources:
Vector data for the regional administrative boundaries of Yunnan Province are derived from the 1:400 basic geographic information data of 10,000 China, and data for attraction information are derived from statistics published on the website of the Yunnan Provincial Tourism Department. As of 29 December 2022, there are a total of 561 ATAs in Yunnan Province region.
3.2. Research Methods:
Firstly, ArcGIS10.0 software is used to align the map of Yunnan Province with the vectors, and the location map of Yunnan Province is derived. Secondly, with the help of the coordinate picker in Baidu map to obtain the geographic coordinates of each attraction of tourist attractions in Yunnan Province, which is imported into the ArcGIS10.0 software. And the method of closest-neighbour analysis is used to determine the SD of the types of ATAs and above in Yunnan Province quantitatively. Finally, the geographic concentration index, imbalance index and Lorenz curve are used to study the degree of concentration and balance of SD of ATAs in Yunnan Province. And the geographical concentration index, imbalance index and Lorenz curve are used to study the degree of concentration and balance of the SD of ATAs in Yunnan Province.
4. Distribution characteristics of ATAs in Yunnan Province
4.1. Nearest neighbour index
Mean Nearest Neighbour is the average value of the closest distances between points. The analysis method determines the spatial pattern by comparing the actual nearest neighbour distance with the theoretical nearest neighbour distance. The nearest neighbour index R is the ratio of the actual nearest neighbour distance to the theoretical nearest neighbour distance, and its formula is:
\( R=\frac{\bar{r1}}{\bar{rE}}=2\sqrt[]{D}\ \ \ (1) \)
In equation (1): R represents the closest neighbour index of ATAs in Yunnan Province; \( \bar{r1} \) is the actual closest neighbour distance; \( \bar{rE} \) is the theoretical closest neighbour distance; and D is the point density. When R<1, the represented pattern is clustered; R>1, the represented pattern tends to be discrete.
By calculating the nearest-neighbour index of all Class A tourist attractions in Yunnan Province, it can be seen that: the nearest-neighbour index of Class A tourist attractions in Yunnan Province is 0.545707<1, It means the SD of Class A tourist attractions in Yunnan Province is clustered. Among them, the nearest-neighbour index of Grade 1A scenic spot and Grade 5A scenic spot is 1.435 and 1.524 respectively, indicating that the grade scenic spot is spatially distributed in a discrete (homogeneous) distribution; however, the nearest-neighbour index of Grade 2A, 3A and 4A scenic spots is 0.760, 0.604 and 0.690 respectively, indicating that it is spatially distributed in a clustered (cohesive) distribution [4]. Since the number of 2A, 3A and 4A level scenic spots accounted for 96.25 per cent, which is much larger than the proportion of 1A and 5A level scenic spots, the tourist attractions in Yunnan Province as a whole showed agglomeration distribution (Table 1).
Table 1.Table of nearest proximity index and spatial structure type of tourist attractions in Yunnan Province.
Scenic rating | The actual nearest distance/km | Theoretical nearest distance/km | R | The spatial structure type |
5A | 122.533 | 80.387 | 1.524 | discrete |
4A | 21.865 | 31.681 | 0.690 | clustering |
3A | 14.472 | 23.969 | 0.604 | clustering |
2A | 24.444 | 32.175 | 0.760 | clustering |
1A | 83.549 | 58.231 | 1.435 | discrete |
4.2. Equilibrium of SD in the provinces
The SD balance of ATAs in Yunnan Province can be obtained by using the geographical concentration index, imbalance index, Lorenz curve and other methods, whose formula is:
\( G=100×\sqrt[]{\sum _{i=1}^{n}{(\frac{{X_{i}}}{T})^{2}}}\ \ \ (2) \)
In the formula (2): Xi is the number of ATAs in the ith district city, T is the total number of ATAs in Yunnan Province, and n is the total number of district cities. In the formula, the value interval of G is [0,100], the larger the value of G is and the closer it is to 100, the more centralized the distribution of Class A tourist attractions is. The geographic concentration index of Class A tourist attractions in Yunnan Province is obtained as G=29.11. Assuming that 561 Class A tourist attractions in Yunnan Province are distributed in sixteen prefectures and cities on average, the average number of tourist attractions in each prefecture and city is 35.06, which is larger than the actual geographic concentration index (29.11), indicating that, from the viewpoint of the state (city) scale, the SD is more concentrated [7].
The imbalance index and Lorenz curve can reveal the unbalanced distribution of Class A tourist attractions in each district and city in Yunnan Province. The calculation formula is as follows:
\( S=\frac{\sum _{i=1}^{n}{Y_{i}}-50(n+1)}{100n-50(n+1)}\ \ \ (3) \)
In equation (3): n is the number of regional cities in Yunnan Province, and \( {Y_{i}} \) it is the cumulative percentage of the ith position after sorting the ratio of the number of A-grade tourist attractions in each regional city to the total number of A-grade tourist attractions in Yunnan Province. The imbalance index 0≤S≤1, S = 0 if the research object (A-grade tourist attractions) is evenly distributed in each region, and S = 1 if all of them are concentrated in one region. Calculation shows that S = 0.299872286 in this study, which indicates that the distribution of A-grade tourist attractions is uneven in the cities of each region within Yunnan Province. Taking the cumulative proportion in Table 2 as the vertical coordinate and the 16 district cities in Yunnan Province as the horizontal coordinate to draw to get the Lorenz curve graph of the distribution of ATAs in each district city in Yunnan Province. As can be seen from Figure 2: the Lorenz curve shows an upward convex form, in which 12 cities, including Baoshan City, Wenshan Prefecture, Honghe Prefecture, Yuxi City, Chuxiong Prefecture, Kunming City, Dali Prefecture, Pu’er City, Qujing City, Lincang City, Lijiang City, Diqing Prefecture, etc., have a larger area of upward convexity, and the number of ATAs in these 12 cities accounted for 87.55% of the total number of tourist attractions in the province; and four cities, namely, Zhaotong City, Dehong Prefecture, Xishuangbanna Prefecture and Nujiang Prefecture are relatively flat, with their ATAs accounting for 87.55% of the province’s total. are relatively flat, and the number of Class A tourist attractions they possess accounts for 12.45% of the total number in the province, further indicating that Class A tourist attractions in Yunnan Province present uneven distribution characteristics in SD [8].
Table 2. Distribution of A-level tourist attractions in various prefectures and cities in Yunnan Province.
Prefecture (state) city | Number of A-level tourist attractions | Percentage/% | Cumulative Percentage/% |
Baoshan City | 97 | 18.6 | 18.6 |
Wenshan Prefecture | 36 | 9.6 | 28.2 |
Red River State | 31 | 7.7 | 35.8 |
Yuxi City | 19 | 7.5 | 43.3 |
Chuxiong Prefecture | 20 | 6.9 | 50.2 |
Kunming city | 40 | 6.7 | 56.9 |
Dali Prefecture | 35 | 5.9 | 62.8 |
Pu’er City | 21 | 5.9 | 68.8 |
Qujing City | 27 | 5.7 | 74.5 |
Lincang City | 8 | 5.2 | 79.7 |
Lijiang City | 31 | 4.0 | 83.7 |
Diqing Prefecture | 30 | 3.8 | 87.5 |
Zhaotong City | 50 | 3.8 | 91.4 |
Dehong State | 18 | 3.6 | 95.0 |
Xishuangbanna Prefecture | 39 | 3.4 | 98.5 |
Nujiang Prefecture | 20 | 1.5 | 100.0 |
Figure 2. Lorentz curve of SD of A-grade tourist attractions in Yunnan Province.
4.3. Provincial spatial kernel density analysis
Kernel density analysis assumes that the higher the density of a spatial point, the higher the probability that a geographical event will occur in the region. For each spatial entity, the density is highest at the centre, decreases towards the edges, and reaches a certain distance threshold at which the density is 0. The kernel density of a spatial location x is the sum of the densities of all entities within its window. The expression is:
\( {f_{(x)}}=\frac{1}{nh}\sum _{i=1}^{n}k(\frac{x-{x_{i}}}{h})\ \ \ (4) \)
In equation (4): n represents the number of spatial entities contained within the distance threshold, h represents the distance threshold, is the kernel density equation, and x-xi represents the Euclidean distance between 2 points.
Through the kernel density analysis of the point data of Class A tourist attractions in Yunnan Province (Figure 3). It can be concluded that the SD of Class A tourist attractions in Yunnan Province generally presents the characteristics of agglomeration. Among them, the main clustering area is shown in the kernel density value range of 0.003167838~0.008503145. Overall, the distribution of ATAs in Yunnan Province presents the characteristics of higher degree of agglomeration in northwestern Yunnan and central Yunnan compared with the eastern edge of Yunnan.
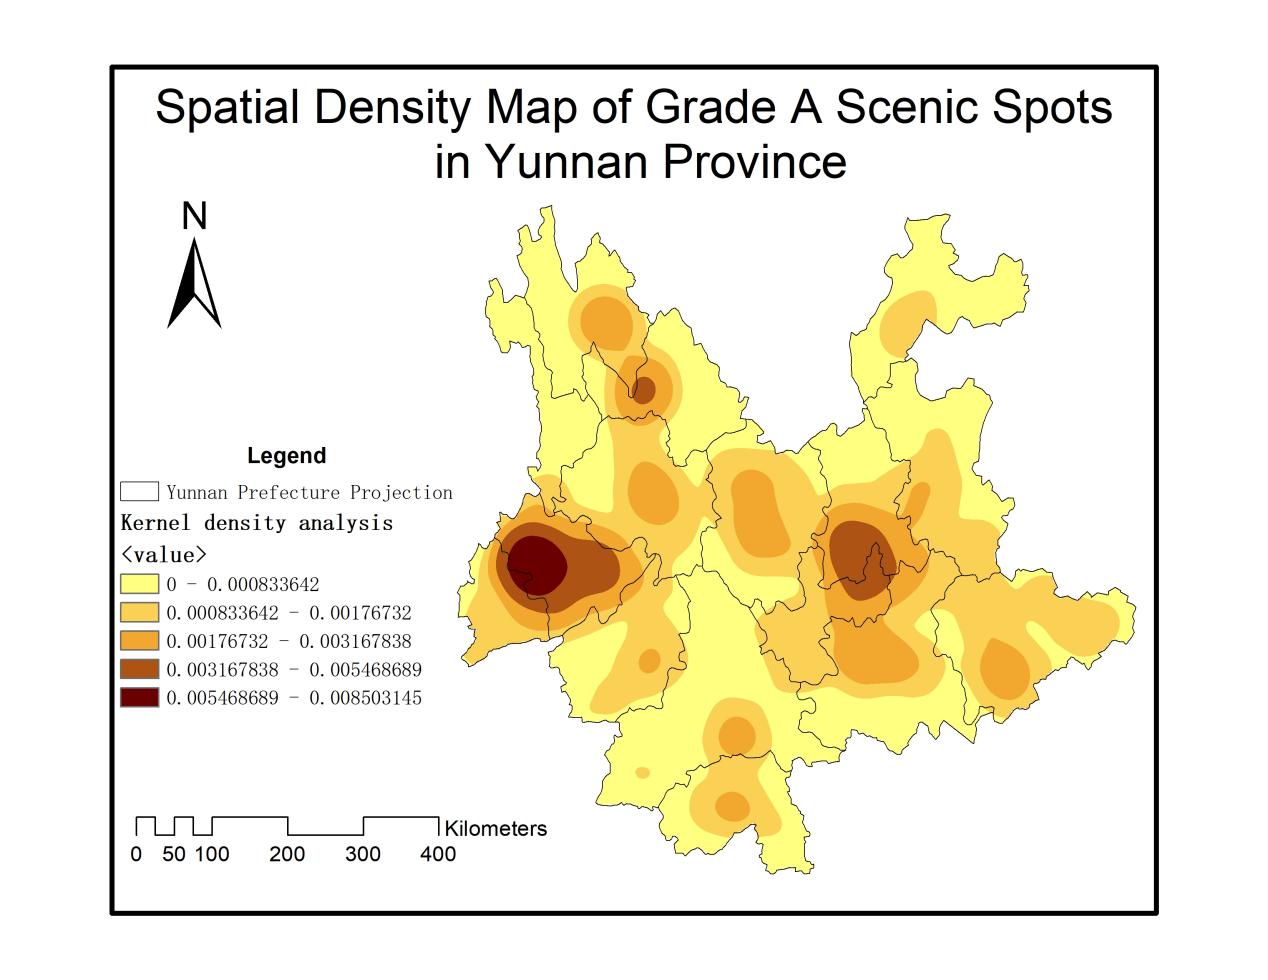
Figure 3. Spatial Density Map of Grade A Scenic Spots in Yunnan Province.
5. Conclusion
By analyzing the SD characteristics of ATAs in Yunnan Province, the following conclusions can be drawn: (1) The SD type of ATAs in Yunnan Province is agglomeration type, and it presents low equilibrium, high degree of concentration, and its Lorenz curve shows obvious upward convex trend.(2) The SD of tourist attractions in Yunnan Province varies significantly, with Grade A attractions mainly concentrated in central and western Yunnan, and less in eastern and northeastern Yunnan.
Aiming at the uneven distribution of Class A tourist attractions in Yunnan Province, and the characteristics of a high degree of concentration in individual areas, we can form a number of tourist attractions in the concentration of tourism core areas, and relying on the core area of the high concentration of tourist attractions to drive the edge of the development of the region’s tourist attractions, and gradually improve the infrastructure, especially the transport network, to improve the degree of accessibility of tourism based on the expansion of the depth of the development of tourism and hinterland, so that the tourism layout in the region gradually balanced, and the eastern edge of Yunnan is less. The tourism layout is gradually balanced in the region, and regional development is promoted through the tourism industry. On the other hand, the geographical agglomeration of many tourist attractions also faces more intense competition among attractions, such as the homogenization of attractions in the agglomeration centre leading to the problem of white-hot competition, in which case it is necessary to innovate the mode of competition, proactively implement the linkage development, create heterogeneous tourism products, attract different consumer groups, and then seek to develop in a larger space [9]. There are still shortcomings in this study, such as not exploring the time evolution characteristics of tourist attractions in Yunnan Province from the dimension of time evolution, etc., which will be further explored in future studies.
References
[1]. CHENG Hai-feng, HU Wen-hai. Spatial Structure of Class A Tourist Attraction in Chizhou [J]. Scientia Geographica Sinica, 2014, 34(10): 1275-1280
[2]. ZHU Lang, CHEN Xiaoliang. Study on the spatial distribution structure of A-grade tourist attractions in China [J].Geographical Sciences, 2008, 28(5):9.DOI:10.3969/ j.issn.1000-0690.2008.05.004.
[3]. Mao Yiji, Gang, Song Jinping, Yu Wei. Spatial structure and evolution of A-grade tourist attractions in Beijing [J].Economic Geography, 2011, 31(8):6.DOI:CNKI:SUN:JJDL. 0.2011-08-027.)
[4]. YUAN Jun, YU Ruilin, LIU Chengliang, et al. Spatial structure of national A-level tourist attractions in Wuhan urban area [J].Economic Geography, 2010(2):5.DOI:CNKI:SUN:JJDL. 0.2010-02-027.
[5]. ZHANG Zhenpeng. Research on spatial distribution characteristics of tourist attractions in China based on GIS [J].Kunming University of Science and Technology, 2019.)
[6]. BAI Ziyi,XUE Liang,YAN Yan. Quantitative analysis of spatial distribution characteristics and influencing factors of tourist attractions based on GIS:A case study of A-grade tourist attractions in Yunnan Province [J].Journal of Yunnan University: Natural Science Edition, 2019(5):982-991.)
[7]. YU Jiefang, WANG Jiaxue, XU Luyan, et al. Spatial structure analysis of 3A and above tourist attractions in Yunnan Province [J].Jiangsu Business Review, 2015(8):4.DOI:CNKI:SUN: SAHG.0.2015-08-017.)
[8]. LI Zhengxin. Spatial distribution characteristics and influencing factors of villages in 3A scenic spots in Zhejiang Province [J].Journal of Zhejiang A&F University,2019,(6):1096-1106.)
[9]. YANG Lei, DONG Chunhua, XU Jun, et al. Analysis of spatial distribution characteristics of tourist attractions in Beijing-Tianjin-Hebei region based on GIS [J].Urban Architecture, 2017(35):3.)
Cite this article
Wei,J. (2024). Analysis of spatial distribution characteristics of A-level tourist attractions in Yunnan Province based on GIS. Applied and Computational Engineering,56,92-98.
Data availability
The datasets used and/or analyzed during the current study will be available from the authors upon reasonable request.
Disclaimer/Publisher's Note
The statements, opinions and data contained in all publications are solely those of the individual author(s) and contributor(s) and not of EWA Publishing and/or the editor(s). EWA Publishing and/or the editor(s) disclaim responsibility for any injury to people or property resulting from any ideas, methods, instructions or products referred to in the content.
About volume
Volume title: Proceedings of the 4th International Conference on Materials Chemistry and Environmental Engineering
© 2024 by the author(s). Licensee EWA Publishing, Oxford, UK. This article is an open access article distributed under the terms and
conditions of the Creative Commons Attribution (CC BY) license. Authors who
publish this series agree to the following terms:
1. Authors retain copyright and grant the series right of first publication with the work simultaneously licensed under a Creative Commons
Attribution License that allows others to share the work with an acknowledgment of the work's authorship and initial publication in this
series.
2. Authors are able to enter into separate, additional contractual arrangements for the non-exclusive distribution of the series's published
version of the work (e.g., post it to an institutional repository or publish it in a book), with an acknowledgment of its initial
publication in this series.
3. Authors are permitted and encouraged to post their work online (e.g., in institutional repositories or on their website) prior to and
during the submission process, as it can lead to productive exchanges, as well as earlier and greater citation of published work (See
Open access policy for details).
References
[1]. CHENG Hai-feng, HU Wen-hai. Spatial Structure of Class A Tourist Attraction in Chizhou [J]. Scientia Geographica Sinica, 2014, 34(10): 1275-1280
[2]. ZHU Lang, CHEN Xiaoliang. Study on the spatial distribution structure of A-grade tourist attractions in China [J].Geographical Sciences, 2008, 28(5):9.DOI:10.3969/ j.issn.1000-0690.2008.05.004.
[3]. Mao Yiji, Gang, Song Jinping, Yu Wei. Spatial structure and evolution of A-grade tourist attractions in Beijing [J].Economic Geography, 2011, 31(8):6.DOI:CNKI:SUN:JJDL. 0.2011-08-027.)
[4]. YUAN Jun, YU Ruilin, LIU Chengliang, et al. Spatial structure of national A-level tourist attractions in Wuhan urban area [J].Economic Geography, 2010(2):5.DOI:CNKI:SUN:JJDL. 0.2010-02-027.
[5]. ZHANG Zhenpeng. Research on spatial distribution characteristics of tourist attractions in China based on GIS [J].Kunming University of Science and Technology, 2019.)
[6]. BAI Ziyi,XUE Liang,YAN Yan. Quantitative analysis of spatial distribution characteristics and influencing factors of tourist attractions based on GIS:A case study of A-grade tourist attractions in Yunnan Province [J].Journal of Yunnan University: Natural Science Edition, 2019(5):982-991.)
[7]. YU Jiefang, WANG Jiaxue, XU Luyan, et al. Spatial structure analysis of 3A and above tourist attractions in Yunnan Province [J].Jiangsu Business Review, 2015(8):4.DOI:CNKI:SUN: SAHG.0.2015-08-017.)
[8]. LI Zhengxin. Spatial distribution characteristics and influencing factors of villages in 3A scenic spots in Zhejiang Province [J].Journal of Zhejiang A&F University,2019,(6):1096-1106.)
[9]. YANG Lei, DONG Chunhua, XU Jun, et al. Analysis of spatial distribution characteristics of tourist attractions in Beijing-Tianjin-Hebei region based on GIS [J].Urban Architecture, 2017(35):3.)