


1. Introduction
According to the latest report released by Bloomberg New Energy Finance (BNEF), the penetration rate of new energy vehicles will rapidly increase in the coming years. By 2026, the global number of new energy passenger vehicles will exceed 100 million; By 2040, it will exceed 700 million vehicles [1]. With the widespread use of new energy vehicles, the health status of batteries is receiving increasing attention from the public.
The health status of batteries is influenced by various factors such as temperature, current ratio, discharge depth, cycle interval, and charge-discharge cut-off voltage [2], and is a long-term gradual process. Based on current relevant battery health status detection standards [3], the detection time is not less than 10 hours, with low efficiency, long cycle, and high cost. Therefore, it is difficult to accurately and efficiently calculate the health status of batteries. There are three main types of assessment models for battery health status: electrochemical model, equivalent circuit models, and empirical models [4]. The electrochemical model analyzes the changes in battery health status from the perspective of the electrochemical reaction mechanism of the battery. Due to the need to analyze the relationship between the internal temperature, electrolyte concentration, and internal resistance of the battery and the health status, accurate monitoring is very difficult [5]. The equivalent circuit model is a basic circuit model that, from the perspective of battery electronics, equates the battery to a basic circuit model. Combining a large amount of state data analysis, the circuit model is used to evaluate the health status of the battery. However, a large number of facts have proven that the equivalent circuit and the dynamic response process inside the battery cannot be considered as a completely absolute correspondence. Although the impedance frequency response of some equivalent components can match the impedance spectrum of the electrode system, its physical significance is not clear and there is controversy [6]. The empirical model is the process of obtaining changes in battery performance status through analysis, fitting, trial and error, empirical formulas, and statistical processing of a large amount of experimental data, and summarizing the changes in battery health status. This method relies on a large amount of accurate data and suitable algorithms [7], and is the easiest method to implement among the three types of models[8].
In response to the problems encountered by the three models, this article proposes a data-driven battery health status evaluation method that deeply combines electrochemical models, big data, and mathematical statistics. This method fully considers the characteristics of the incremental capacity (IC) curve of the battery, namely the phenomenon of the same pressure difference but different charging amounts [9]. By analyzing a large amount of charging log data, the changes in battery health status are summarized, and the feasibility of calculating battery capacity through soc-power parameters is verified. Through example verification, a method for accurately and efficiently evaluating battery health status based on soc-power parameters has been proposed.
2. Definition of battery health status
The current battery health status (SOH) is an indicator that represents the state of the battery from the beginning of its lifespan to the end of its lifespan in percentage form. The model in this article mainly calculates SOH through battery capacity [10], and the calculation formula is:
\( SOH=\frac{C now}{C new}×100\%\ \ \ (1) \)
\( {C_{now}} \) is the current battery capacity, \( {C_{new}} \) is new car battery capacity.
The battery capacity of the new car is replaced by the nominal capacity of the car series, and the current battery capacity can be calculated using a big data model to complete the calculation of battery health status assessment.
3. Calculation process of battery health status
3.1. Boxplot anomaly detection
Outliers generally refer to data that is far away from most observations, and there are various ways to detect outliers, such as using variable space distance measurement to label observations that are too far away as outliers. There are also detection methods based on data distribution, and boxplot anomaly detection is a distribution based anomaly detection method [11]. This detection method first assumes the expected distribution of the data and marks values that deviate from this distribution as outliers. Firstly, calculate the quartile data Q1 and Q3 of the dataset, and use formula (2) to calculate the quartile distance:
\( IQR={Q_{3}}-{Q_{1}}\ \ \ (2) \)
Calculate the thresholds on both sides based on the calculation results of formula (2):
\( Maximum threshold: {Q_{3}} +1.5×IQR \)
\( Minimum threshold: {Q_{1}} -1.5×IQR\ \ \ (3) \)
Data outside the threshold can be determined as outliers.
3.2. Feasibility verification of calculating battery health status using soc-power parameters
According to the calculation method for the soc-power parameters of a certain car series under a certain brand, the soc-power parameters of the same batch of cars with the same nominal capacity, battery type, and factory year are calculated based on the effective orders in 2019 and 2020, as shown in the following figures:
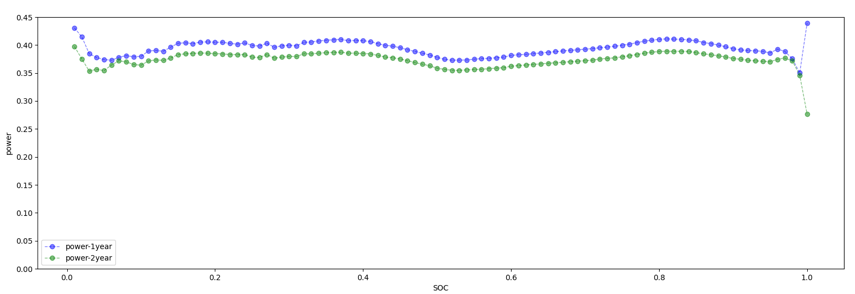
Figure 1. Changes in soc-power curves of a certain car series in 2019 and 2020.
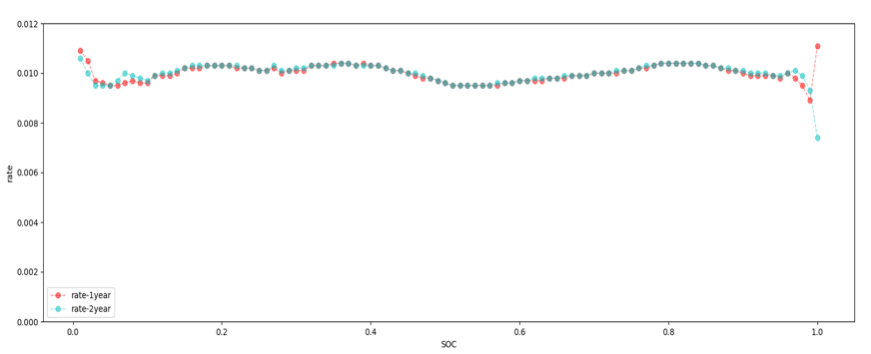
Figure 2. Changes in soc-rate curves of a certain car series in 2019 and 2020.
From Figure 1, it can be seen that as the age of the vehicle increases, the battery decays, and the State of Charge (SOC) power parameter of the vehicle system moves down as a whole for every 0.01 SOC except for SOC=1. From Figure 2, it can be seen that within the range of [0.11, 0.96], the proportion of charging per 0.01 SOC remains almost unchanged throughout the entire process. Therefore, it is determined that using the SOC power parameter and effective segments to calculate the battery attenuation is feasible.
(1) Using the calculation method of vehicle series soc-power parameters in the following text, the soc-power parameters of 7 different vehicle series were calculated, as shown in Figure 3:
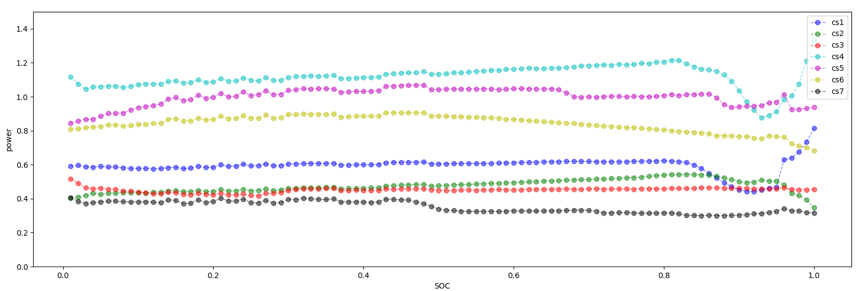
Figure 3. Comparison of soc-power parameters among 7 car series.
From Figure 3, it can be seen that there are significant differences in the shape of the SOC power curves among different car series, so a set of parameters cannot be used to represent the parameters of all vehicles.
Calculate the soc-power parameters of two sets of vehicle series with different nominal capacities (50kWh, 54kWh) for the same brand and the same vehicle series (see Figure 4):
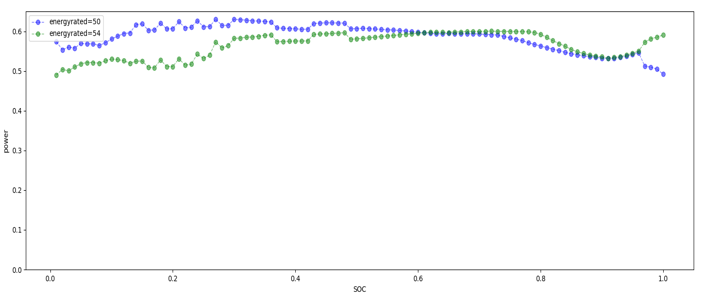
Figure 4. Comparison of soc-power parameters for different energyratyed of the same car series.
From Figure 4, it can be seen that there are significant differences in the shape of the SOC power curves for different nominal capacities of the same car series, so a set of parameters cannot be used for different nominal capacities of the same car series.
(3) Calculate the soc-power parameters of two different battery types (ternary lithium material battery, lithium iron phosphate battery) for a certain brand of the same car series, as shown in Figure 5:
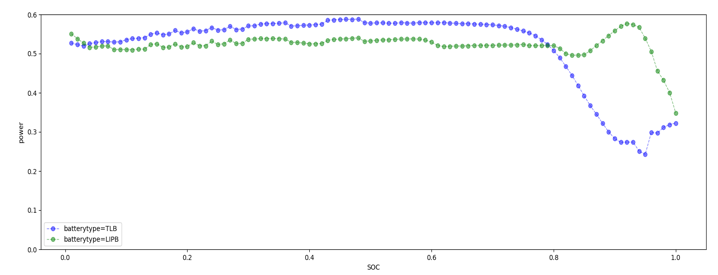
Figure 5. Comparison of soc-power parameters for different battery types in the same car series.
From Figure 5, it can be seen that there are significant differences in the shape of the SOC power curve for different battery types in the same car series, so different battery types in the same car series cannot use a set of parameters.
(4) Calculate the soc-power parameters for a certain brand and the same car series in different factory years (2020-2023), as shown in Figure 6:
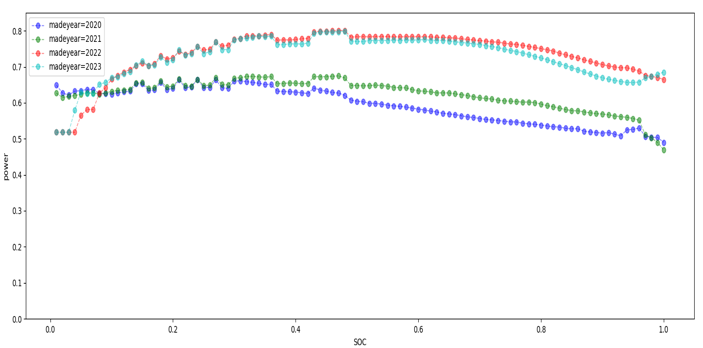
Figure 6. Comparison of Soc-power parameters for the same car series and different made years.
From Figure 6, it can be seen that there are significant differences in the shape of the SOC power curve for the same car series with different factory years, and a set of parameters cannot be used for the same car series with different factory years. Therefore, when calculating the SOC power parameters of the vehicle series, it is necessary to group and calculate them separately based on the vehicle series, battery type, nominal capacity, and year of production.
3.3. Steps for calculating battery health status based on big data
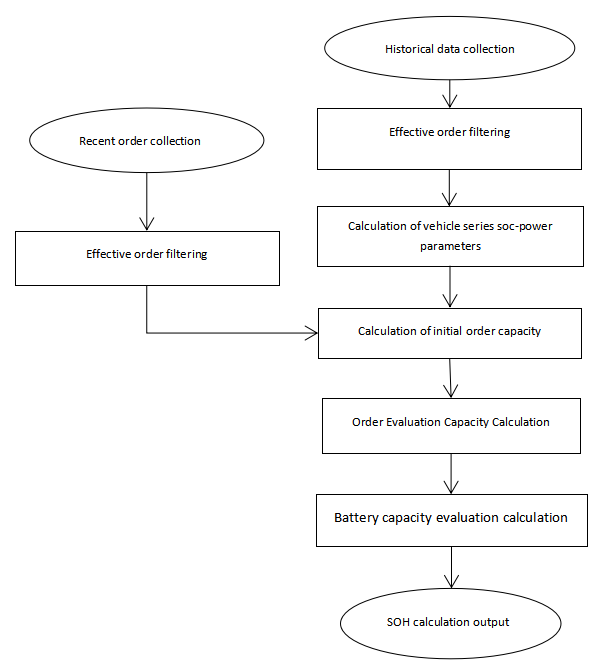
Figure 7. SOH calculation process.
(1) Historical data collection, filtering, and pre-processing: Group vehicles based on vehicle series, nominal capacity, factory year, and battery type to obtain all vehicles under each group. Filter the orders of the grouped vehicles within 6 months after the registration date and meet the valid order conditions to determine whether the number of orders is greater than 5000. If the conditions are met, proceed to step 2. If not, filter the orders of the grouped vehicles within 12 months after the registration date and meet the valid order conditions. Determine if the number of orders is greater than 5000. If the conditions are met, proceed to step 2. If the conditions are not met, calculate the next analysis (Figure 7).
(2) Calculation and conversion of vehicle series SOC power parameters: Based on the valid orders selected in step 1, combined with the sliding average algorithm, calculate the average charging amount corresponding to every 0.01 SOC of the vehicle series
(3) Recent order data collection, filtering, and pre-processing: Obtain the latest orders for grouped vehicles and filter out valid orders based on valid order criteria.
(4) Order Capacity Evaluation: Obtain the starting and ending SOC of valid orders, and obtain the proportion of charging capacity of the vehicle series in this SOC interval by looking up the table. According to the formula:
\( {C_{original}}=\frac{{P_{bill}}}{{R_{rate}}}\ \ \ (4) \)
\( {C_{original }} \) is order initial evaluation capacity, \( {P_{bill}} \) is order charging capacity, \( {R_{rate}} \) Proportion of charging volume within the order SOC range.
Calculate the initial evaluation capacity of the order, obtain the effective charging orders and initial evaluation capacity of the vehicle within the past 60 days, and then use the Boxplot anomaly detection algorithm to screen out orders with abnormal initial evaluation capacity. Calculate the average of the initial evaluation capacity of normal orders as the final output value of the order evaluation capacity \( {C_{bill}} \) .
(1) Current battery capacity evaluation: Obtain the order evaluation capacity of the vehicle in the past 60 days, use the Boxplot anomaly detection algorithm to detect outliers, eliminate outliers, and calculate the average order evaluation capacity as the output value of the current battery evaluation capacity \( {C_{now}} \) .
(2) Battery health status output: Obtain the nominal capacity of the vehicle model and use formula (1) to calculate the current battery health status.
3.4. Calculation example
The test vehicle is a rental passenger vehicle of a certain brand, made year is 2019, with a nominal capacity of 51.2kWh and a battery type of ternary lithium material. Based on the historical data of this car series, the soc-power parameters of the car series can be calculated as:
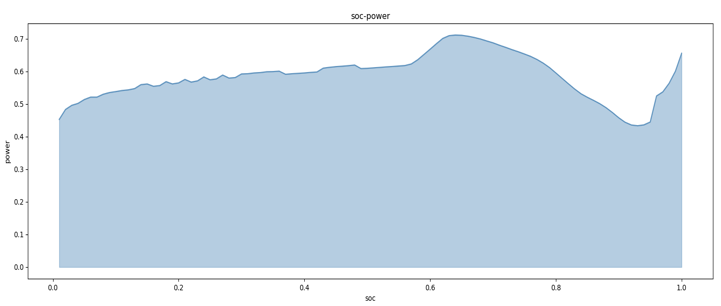
Figure 8. Car series soc-power parameter curve.
From the Figure 8, it can be seen that the charging amount per 0.01 SOC is not a constant, and the charging amount required for different SOC intervals is also inconsistent.
The vehicle received an order on August 23, 2023, with a charging time of 38 minutes, starting SOC of 0.59, ending SOC of 1, and a charging capacity of 13.265kWh. The charging curve is shown in Figure 9:
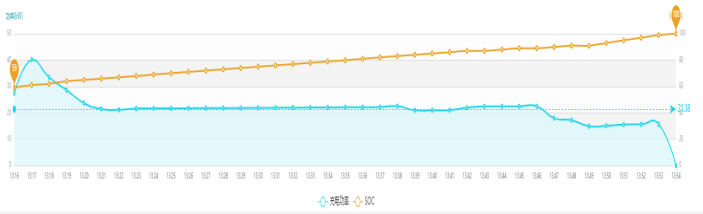
Figure 9. Order power curve.
Calculate the initial evaluation of 30.9944 kWh for the order, and use sliding average to calculate the soc-power parameters for this order as shown in Figure 10:
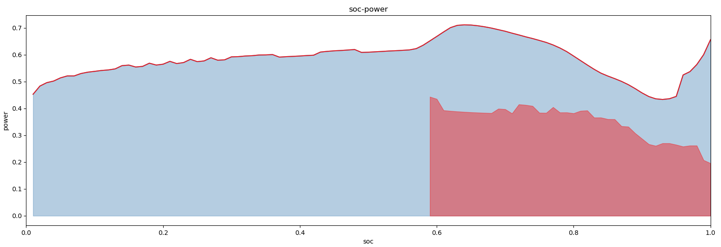
Figure 10. Comparison of order soc-power curve and car series soc-power curve.
From the above Figure 10, it can be seen that the battery capacity has significantly decreased. Calculate the initial evaluation capacity of the vehicle's orders in the past 60 days, then use Boxplot anomaly detection to exclude abnormal orders, and then calculate the average value of the remaining orders to obtain the evaluation capacity of 32.2338 kWh. Finally, calculate the average value of the evaluation capacity of orders in the past 60 days to obtain the evaluation capacity of 32.4496 kWh. The nominal capacity of the vehicle series is 51.2 kWh, and the SOH=63.38% can be calculated, The historical SOH changes of this car are shown in the Figure 11:
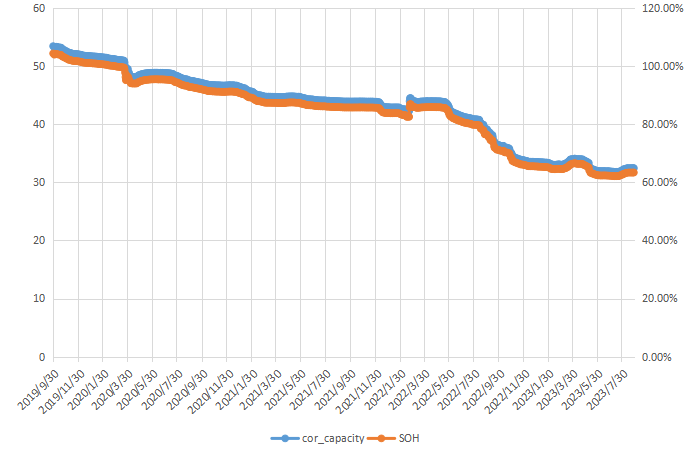
Figure 11. Trend of changes in battery history SOH.
4. Conclusion
The battery health status assessment technology based on big data in this article is data-driven, using a deep combination of electrochemical models, big data, and mathematical statistics to solve the problem of inaccurate and untimely battery health status calculation. This method first constructs vehicle series parameters based on new car order data, and then calculates each order of the vehicle. In the middle, abnormal orders are excluded through Boxplot outlier processing, and the evaluation capacity of the battery is obtained through sliding average. Finally, the battery health status evaluation is output. The technology described in this article is relatively easy to implement, simple in process, and has high accuracy in calculation results. The average absolute error percentage of the model tested on new cars within three months of registration date is 7.80%. Based on charging big data and AI algorithms, using charging fragment data can achieve accurate and efficient estimation of battery health status, greatly improving the efficiency of battery health detection. Future research in battery health assessment should address the limitations of the current paper by conducting validation studies, comparative analysis, and exploring new avenues such as machine learning integration. Additionally, efforts should be made to improve data quality, consider cost and practicality implications, and investigate long-term performance prediction, environmental impact assessment, and standardization. By addressing these areas, the field of battery health assessment can advance and contribute to the development of more efficient and sustainable energy storage systems.
References
[1]. Lin Wang. Global ownership of new energy vehicles is expected to exceed 100 million within three years. China Energy News, 2023(06):26.
[2]. Yong Li, Lifang Wang. Research progress on the health state model of lithium-ion batteries, Liao Chenglin electric vehicles Power technology, 2013(05):20, pp. 863-866.
[3]. DB32, T 4380-2022. Technical requirements and on-site testing methods for lithium-ion power battery systems of electric vehicles in operation. China Standards Press, 2022.
[4]. Qing Xiong, Zhenguo Di. Review of Research Progress on Health State Estimation and Life Prediction of Jishengchang Lithium Ion Batteries, High Voltage Technology, 2023(07):14.
[5]. Renjing Gao, Zhiqiang Lv, Shuai Zhao, Xianguo Huang. Health State Estimation of Lithium Ion Batteries Based on Electrochemical Models, Journal of Beijing University of Technology, February 23, 2022, pp.791-797.
[6]. Peng Lin, Tao Liu, Peng Jin, et al. Identification of equivalent circuit model parameters for lithium-ion batteries based on multiple innovation identification algorithms, Energy Storage Science and Technology, 2023(07):26, pp.16.
[7]. Ping Wang, Qingrui Gong, Ji Zhang. An Online Health State Prediction Method for Lithium Batteries Based on a Combination of Data Driven and Empirical Models, Ang Chengze Journal of Electrical Technology, 2021(12):12. pp.5201-5212.
[8]. O'Boyle Kiernan, Park Jonghyun, Ajiboye Damola. Data-Driven State of Health (SOH) Prediction for Lithium-Ion Batteries, Electrochemical Society Meeting Abstracts, 2022(10):09.
[9]. Caijie Zhou, Zonghai Chen, Yujie Wang. Health State Estimation of Lithium Batteries Based on Incremental Capacity Curve Analysis, Proceedings of the 22nd China System Simulation Technology and Its Applications, Academic Annual Conference (CCSSTA22nd 2021), October 10, 2021, pp.303-309.
[10]. Jinhao Meng. Research on the Estimation Method of State Parameters, Automotive Lithium Battery, Northwest University of Technology, May 1st, 2019.
[11]. Guoqing Gu. Xiaohui Li. Exponential Weighted Smoothing Prediction Model Based on Box Graph Anomaly Detection, Computer and Modernization, 2021(01):15, pp. 28-33.
Cite this article
Guo,F. (2024). Battery health status assessment technology based on big data and artificial intelligence. Applied and Computational Engineering,59,1-8.
Data availability
The datasets used and/or analyzed during the current study will be available from the authors upon reasonable request.
Disclaimer/Publisher's Note
The statements, opinions and data contained in all publications are solely those of the individual author(s) and contributor(s) and not of EWA Publishing and/or the editor(s). EWA Publishing and/or the editor(s) disclaim responsibility for any injury to people or property resulting from any ideas, methods, instructions or products referred to in the content.
About volume
Volume title: Proceedings of the 4th International Conference on Materials Chemistry and Environmental Engineering
© 2024 by the author(s). Licensee EWA Publishing, Oxford, UK. This article is an open access article distributed under the terms and
conditions of the Creative Commons Attribution (CC BY) license. Authors who
publish this series agree to the following terms:
1. Authors retain copyright and grant the series right of first publication with the work simultaneously licensed under a Creative Commons
Attribution License that allows others to share the work with an acknowledgment of the work's authorship and initial publication in this
series.
2. Authors are able to enter into separate, additional contractual arrangements for the non-exclusive distribution of the series's published
version of the work (e.g., post it to an institutional repository or publish it in a book), with an acknowledgment of its initial
publication in this series.
3. Authors are permitted and encouraged to post their work online (e.g., in institutional repositories or on their website) prior to and
during the submission process, as it can lead to productive exchanges, as well as earlier and greater citation of published work (See
Open access policy for details).
References
[1]. Lin Wang. Global ownership of new energy vehicles is expected to exceed 100 million within three years. China Energy News, 2023(06):26.
[2]. Yong Li, Lifang Wang. Research progress on the health state model of lithium-ion batteries, Liao Chenglin electric vehicles Power technology, 2013(05):20, pp. 863-866.
[3]. DB32, T 4380-2022. Technical requirements and on-site testing methods for lithium-ion power battery systems of electric vehicles in operation. China Standards Press, 2022.
[4]. Qing Xiong, Zhenguo Di. Review of Research Progress on Health State Estimation and Life Prediction of Jishengchang Lithium Ion Batteries, High Voltage Technology, 2023(07):14.
[5]. Renjing Gao, Zhiqiang Lv, Shuai Zhao, Xianguo Huang. Health State Estimation of Lithium Ion Batteries Based on Electrochemical Models, Journal of Beijing University of Technology, February 23, 2022, pp.791-797.
[6]. Peng Lin, Tao Liu, Peng Jin, et al. Identification of equivalent circuit model parameters for lithium-ion batteries based on multiple innovation identification algorithms, Energy Storage Science and Technology, 2023(07):26, pp.16.
[7]. Ping Wang, Qingrui Gong, Ji Zhang. An Online Health State Prediction Method for Lithium Batteries Based on a Combination of Data Driven and Empirical Models, Ang Chengze Journal of Electrical Technology, 2021(12):12. pp.5201-5212.
[8]. O'Boyle Kiernan, Park Jonghyun, Ajiboye Damola. Data-Driven State of Health (SOH) Prediction for Lithium-Ion Batteries, Electrochemical Society Meeting Abstracts, 2022(10):09.
[9]. Caijie Zhou, Zonghai Chen, Yujie Wang. Health State Estimation of Lithium Batteries Based on Incremental Capacity Curve Analysis, Proceedings of the 22nd China System Simulation Technology and Its Applications, Academic Annual Conference (CCSSTA22nd 2021), October 10, 2021, pp.303-309.
[10]. Jinhao Meng. Research on the Estimation Method of State Parameters, Automotive Lithium Battery, Northwest University of Technology, May 1st, 2019.
[11]. Guoqing Gu. Xiaohui Li. Exponential Weighted Smoothing Prediction Model Based on Box Graph Anomaly Detection, Computer and Modernization, 2021(01):15, pp. 28-33.