


1. Introduction
Shelled ocean organisms are going to experience an unprecedented crisis if anthropogenic CO2 emission continues to increase. This is a common sense acknowledged by multiple scholars. The specific process can be briefly summarized as the following process: the dissolution of anthropogenic CO2 raises the concentration of H+ in the seawater. In other words, the abundant CO2 dissolution is making the ocean’s pH abnormally low. The CaCO3-made shells cannot withstand a high concentration of H+ and tend to dissolve in low-pH solution systems. So far, scholars have noticed two possible ways that the acidification process may harm ocean organisms with calcium carbonate shells: one of them is the dissolution of the already formed shells; the other is the difficulty of forming new shells, which can be explained by the concentration decrease of the carbonate ions (which is also caused by the increase of H+). This article, accordingly, will discuss both topics while accentuating the former. The dissolution of the shells is related to multiple factors, including the biological features of different ocean organisms, temperature, pressure, and else. Even merely the chemical factors, which are the main factors considered in this model, will involve multiple uncertainties since there exist a variety of different chemical substances in the seawater. Previous studies have shown the seriousness of the acidification and shell-destruction process by relatively sophisticated and complex theories [1-2]. However, there is an absence of a simplified version of this dissolution process based on purely chemical analysis. Therefore, this article will introduce such a model to illustrate this process way intuitively.
2. Method construction and model description
2.1. Method Construction
Considering the more significant effect that the carbonate system has on calcium carbonate dissolution, the author focuses on the interaction between this system and the compound. In the book Global Warming Science: A Quantitative Introduction to Climate Change and Its Consequences [3], the author built a set of chemical equilibrium equations to approximately describe the carbon system in the ocean. Based on the existing equations listed in the book, adding the interaction between the carbonate system and CaCO3, we can get the following system of equations, which will be further elaborated later:
\( {K_{H}}=\frac{[{H_{2}}CO_{3}^{*}]}{[{CO_{2}}(g)]}\ \ \ (1) \)
\( {K_{1}}=\frac{[HCO_{3}^{-}][{H^{+}}]}{[{H_{2}}CO_{3}^{*}]}\ \ \ (2) \)
\( {K_{2}}=\frac{[CO_{3}^{2-}][{H^{+}}]}{[HCO_{3}^{-}]}\ \ \ (3) \)
\( {K_{w}}=[{H^{+}}][{OH^{-}}]\ \ \ (4) \)
\( {K_{sp}}=[{Ca^{2+}}][CO_{3}^{2-}]\ \ \ (5) \)
\( {Alk_{C}}=[HCO_{3}^{-}]+2[CO_{3}^{2-}]+[{OH^{-}}]-[{H^{+}}]\ \ \ (6) \)
\( {C_{T}}=[HCO_{3}^{-}]+[CO_{3}^{2-}]+[{H_{2}}CO_{3}^{*}]\ \ \ (7) \)
In the equations listed above, KH (constant) stands for Henry’s constant; K1 (constant) and K2 (constant) stand for the equilibrium constant for the first and second step of carbonic acid’s ionization, correspondingly; Kw (constant) stands for the equilibrium product of water; Ksp (constant) stands for the solubility product constant of calcium carbonate; AlkC (constant) stands for the carbonic alkalinity; CT stands for the total dissolved inorganic carbon; \( {H_{2}}CO_{3}^{*} \) stands for the sum of aqueous carbon dioxide and unionized carbonic acid ( \( {H_{2}}CO_{3}^{*} \) =H2CO3+CO2(aq) ). Compounds and ions in square brackets stand for the concentration, all in millimoles per liter, which is also the unit of AlkC and CT. It is worth noting that symbols mentioned above should be seen as constants if and only if they have the extra explanation of “(constant)”.
Eventually, we get this model centring on the main interaction between CaCO3 and the carbon system and can present the influence of ocean acidification as well.
2.2. Model Description
To maintain the simplicity, all variables and constants are set in a background consisting of a 15°C temperature, a 0m depth (a 1 atm pressure), and a 35 ppt salinity, since some of the constants (specifically, Henry’s constant and other equilibrium constants that start with ‘K’) are relatively sensitive to these factors and can be seen as functions of these factors [4]. Moreover, for simplicity, the model assumes the alkalinity to be a carbonate alkalinity because other ions’ effects are negligible in this problem.
Nevertheless, it is noteworthy that the solubility product constant of calcium carbonate varies significantly due to its form, which mainly includes calcite and aragonite. This may lead to the difficulty of determining the constant Ksp. Fortunately, a previous study [5] has acknowledged that although the stable calcite may take a larger proportion in the ocean CaCO3 reservoir, aragonite plays a more significant role in reactions, and even dominates CaCO3 production and cycling. Correspondingly, this model sets the Ksp value as that of aragonite.
Now, with 6 reliable constants, 8 variables, and 7 equations in total, the system is still unsolvable. As a result, the author picks CT, the total dissolved inorganic carbon (DIC), as the independent variable, since the natural process of carbon entering into the ocean can be best described by the change of this variable.
The code used to realize the model is presented in the appendix, and the resource of the constants’ value used in the model will be presented in the references part [6]. The original code is edited in Python and Matlab, but since it is relatively lengthy, the article includes just the pseudo-code:
The Matlab Part:
Declare arrays to store each solution;
for C_T in 0.5~5.5 (with a step length of 0.01):
Set the value of the constant;
Set the equations;
Use the Matlab ‘solve’ to solve the equation system
(Constraint: all variables should be positive);
Store solutions in prepared arrays;
end for the loop
Store the solved data in a ‘.mat’ file;
The Python Part:
Open the ‘.mat’ file and load the data;
Plot the two figures with different Y-axis limits to compare;
X-axis: pH;
Y-axis: Concentration;
(Transformations of units and from [H+] to pH are not presented)
Use an exponential function to fit the Ca(2+) curve and analyze the goodness of fit;
Get the [Ca2+]-[CT] relationship curve and get its first and second derivative;
3. Result and analysis
The model discussed above generated the following result:
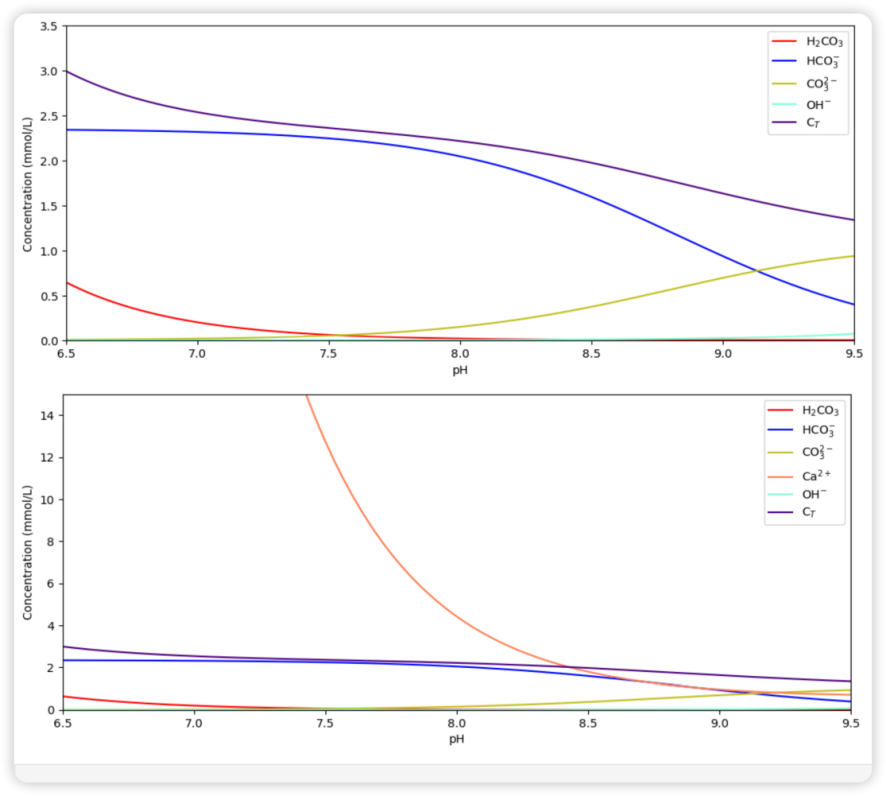
Figure 1. The relationship between the pH value of the seawater and the concentration of ions (also including DIC). The upper plot is a magnified version without the [Ca2+] curve and is presented to readers to show a comparison with the lower plot.
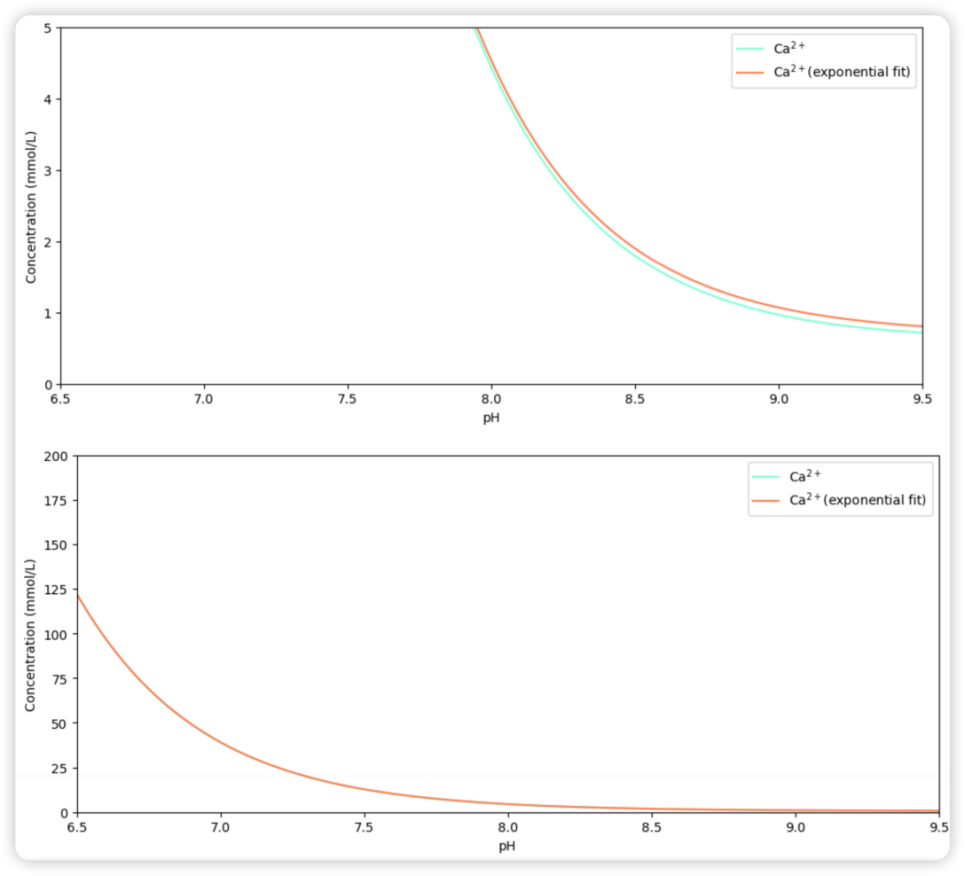
Figure 2. The detailed and general version (upper plot and lower plot, respectively) of the exponential fitting of the [Ca2+] curve.
From the comparison of these two plots in Figure 1, we can obtain the simple fact that the CaCO3 dissolution (represented by the Ca2+ concentration) remains a relatively stable but increasing state as the pH decreases before reaching the pH of 8.0. However, this increasing trend tends to be dramatic when the pH is lower than 8.0. Considering that the current average seawater pH is approximately 8.1, it is a worrying fact that ocean acidification is still in progress.
This idea can be further supported by the evidence that an exponential curve can be almost perfectly fitted to the Ca2+ curve. The visual effect is shown in Figure 2, indicating that when the Y-axis is in a large expansion, the difference between the fitted curve and the original one is minuscule. This can be better proved by the Pearson coefficient of this couple of curves: 0.9999998140106574 (very close to 1, which indicates a perfect linear correlation). As a result, we may conclude that this model is presenting us with a severe situation of seashell dissolution.
Back to Figure 1 (the upper plot, specifically), we may also discover that the concentration of the carbonate ion is going down when the pH value lowers. As described in the introduction, this trend supports that ocean acidification will make it harder for ocean organisms to develop their shells. While most ocean lives have a sufficient supply of calcium ions [7] inside their bodies (since Ca2+ is one of the basic ions used in cells’ control), carbonate ion concentration is relatively scarce and largely depends on the outer environment. Therefore, the decrease in the concentration of the critical \( CO_{3}^{2-} \) will be a considerable obstacle in shell forming.
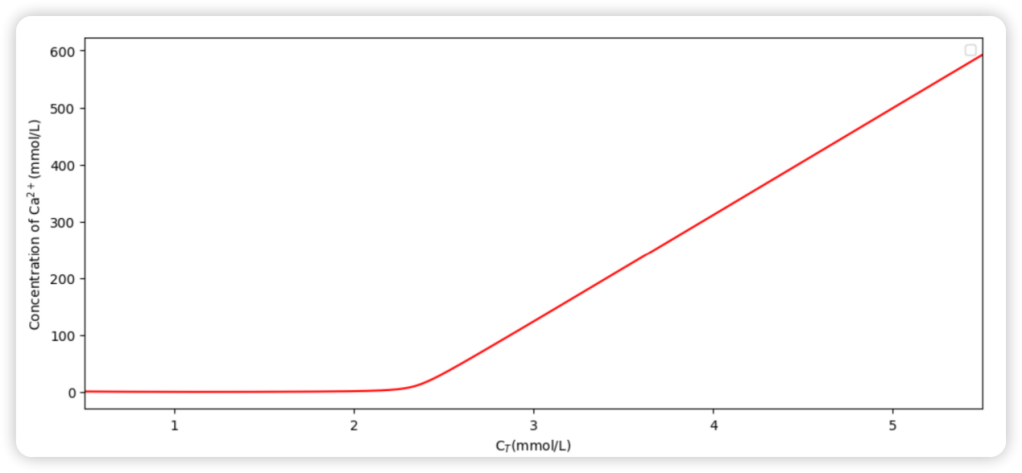
Figure 3. The [Ca2+]-CT relationship curve.
Also, the relationship between Ca2+ concentration and CT (DIC) is demonstrated in Figure 3 since this plot more directly reflects the effect of adding anthropogenic carbon into the ocean.
A turning point can be observed in Figure 3, which has a significant meaning since it divides the modeled dissolution process into two main stages. These two stages can approximately be taken as linear while the latter one has a much larger slope. To decide the CT value of the turning point, the author obtained the first and second derivatives of the function displayed in Figure 3 and presented them as follows:
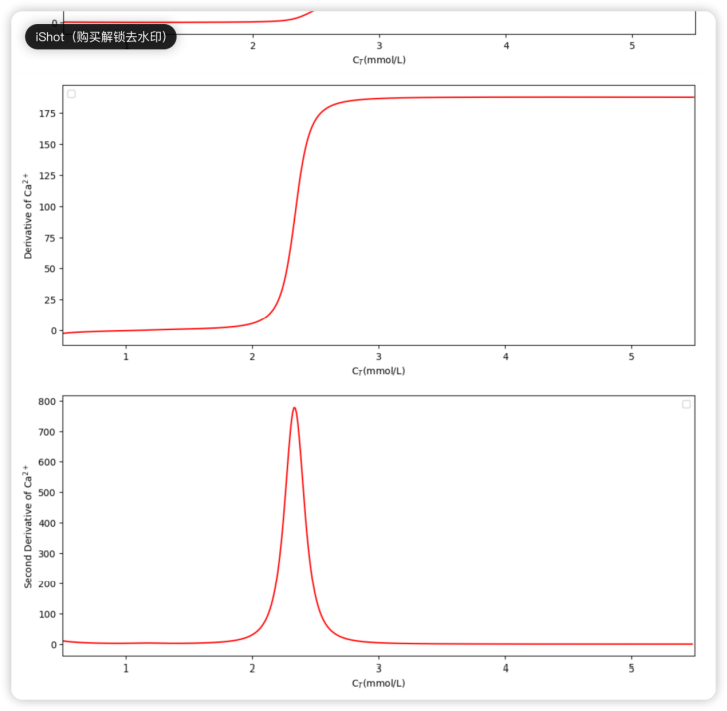
Figure 4. The first and second derivatives (upper plot and lower plot, respectively) of the function are displayed in Figure 3.
Corresponding to the turning point in Figure 3, the derivative plot in Figure 4 shows a dramatic increase in the same range of CT. Interpreting the derivative as the increasing rate of Ca2+ concentration concerning the increase of CT, the author finds it reasonable to consider the “maximum acceleration”, which stands for the maximum value of the second derivative in the given range, as the ultimate turning point. Via simple computation, we can obtain the approximate CT value of that maximum: 2.33mmol/L.
This result leads us to a relatively more intuitive understanding of the coming seashell crisis than the pH-c(Ca2+) relationship does. Moreover, this gives the model the ability to combine with known DIC prediction models. The author has already tried such a combination: according to the predicted data of DIC generated by a reliable model [8], we will likely arrive at this turning point in 2090 (when the regional CT maxima first reaches 2.346mmol/L, surpassing the 2.33mmol/L value) under the RCP8.5 scenario.
4. Conclusion
The model showed excellent performance when generating crucial (under this topic) seawater ions’ concentration, fitting the exponential function to the original [Ca2+] curve, and analyzing the [Ca2+] turning point by calculating the derivatives. Although its fixed setting of some physical factors―such as temperature, pressure, and salinity―is not very satisfying, it does inform us how urgent the situation (the ocean acidification’s dissolution effect) is. It suggests that we should take action to reduce anthropogenic CO2 emissions or the tragedy for seashells will arrive at the end of the century.
The current model has, including but not limited to fixed parameters, ignorance of some small-influence components, and idealization in deciding the forms of CaCO3 (aragonite or calcite, which may not perfectly represent the biological CaCO3 in seashells). The author wishes to make up these flaws in future research and welcomes all scholars to contribute to the perfection of the model or utilize it for proper purposes. The author would like to recommend scholars refer to this model when analyzing calcium ion fluctuation in the ocean.
References
[1]. Orr, J. C., Fabry, V. J., Aumont, O., Bopp, L., Doney, S. C., Feely, R. A., Gnanadesikan, A., Gruber, N., Ishida, A., Joos, F., Key, R. M., Lindsay, K., Maier-Reimer, E., Matear, R., Monfray, P., Mouchet, A., Najjar, R. G., Plattner, G.-K., Rodgers, K. B., … Yool, A. (2005). Anthropogenic ocean acidification over the twenty-first century and its impact on calcifying organisms. Nature, 437(7059), 681–686. https://doi.org/10.1038/nature04095
[2]. Buth, J. M. (2016). Ocean acidification: Investigation and presentation of the effects of elevated carbon dioxide levels on seawater chemistry and calcareous organisms. Journal of Chemical Education, 93(4), 718–721. https://doi.org/10.1021/acs.jchemed.5b00676
[3]. Tziperman, E. (2022). Chapter 5: Ocean Acidification. In Global warming science: A quantitative introduction to climate change and its consequences (pp. 82–89). essay, Princeton University Press.
[4]. Weiss, R. F., Jahnke, R. A., & Keeling, C. D. (1982). Seasonal effects of temperature and salinity on the partial pressure of CO2 in seawater. Nature, 300(5892), 511–513. https://doi.org/10.1038/300511a0
[5]. Sulpis, O., Jeansson, E., Dinauer, A., Lauvset, S. K., & Middelburg, J. J. (2021). Calcium carbonate dissolution patterns in the Ocean. Nature Geoscience, 14(6), 423–428. https://doi.org/10.1038/s41561-021-00743-y
[6]. Tziperman, E. (2022). Chapter 5: Ocean Acidification. In Global warming science: A quantitative introduction to climate change and its consequences (pp. 95). essay, Princeton University Press.
[7]. Brini, M., Calì, T., Ottolini, D., Carafoli, E. (2013). Intracellular Calcium Homeostasis and Signaling. In: Banci, L. (eds) Metallomics and the Cell. Metal Ions in Life Sciences, vol 12. Springer, Dordrecht. https://doi.org/10.1007/978-94-007-5561-1_5
[8]. Jiang, L., Dunne, J., Carter, B. R., Tjiputra, J. F., Terhaar, J., Sharp, J. D., Olsen, A., Alin, S., Bakker, D. C., Feely, R. A., Gattuso, J., Hogan, P., Ilyina, T., Lange, N., Lauvset, S. K., Lewis, E. R., Lovato, T., Palmieri, J., Santana‐Falcón, Y., … Ziehn, T. (2023). Global surface ocean acidification indicators from 1750 to 2100. Journal of Advances in Modeling Earth Systems, 15(3). https://doi.org/10.1029/2022ms003563.
Cite this article
Hu,K. (2024). An analysis of seashell calcium carbonate dissolution caused by ocean acidification based on chemistry equilibrium. Applied and Computational Engineering,61,122-128.
Data availability
The datasets used and/or analyzed during the current study will be available from the authors upon reasonable request.
Disclaimer/Publisher's Note
The statements, opinions and data contained in all publications are solely those of the individual author(s) and contributor(s) and not of EWA Publishing and/or the editor(s). EWA Publishing and/or the editor(s) disclaim responsibility for any injury to people or property resulting from any ideas, methods, instructions or products referred to in the content.
About volume
Volume title: Proceedings of the 4th International Conference on Materials Chemistry and Environmental Engineering
© 2024 by the author(s). Licensee EWA Publishing, Oxford, UK. This article is an open access article distributed under the terms and
conditions of the Creative Commons Attribution (CC BY) license. Authors who
publish this series agree to the following terms:
1. Authors retain copyright and grant the series right of first publication with the work simultaneously licensed under a Creative Commons
Attribution License that allows others to share the work with an acknowledgment of the work's authorship and initial publication in this
series.
2. Authors are able to enter into separate, additional contractual arrangements for the non-exclusive distribution of the series's published
version of the work (e.g., post it to an institutional repository or publish it in a book), with an acknowledgment of its initial
publication in this series.
3. Authors are permitted and encouraged to post their work online (e.g., in institutional repositories or on their website) prior to and
during the submission process, as it can lead to productive exchanges, as well as earlier and greater citation of published work (See
Open access policy for details).
References
[1]. Orr, J. C., Fabry, V. J., Aumont, O., Bopp, L., Doney, S. C., Feely, R. A., Gnanadesikan, A., Gruber, N., Ishida, A., Joos, F., Key, R. M., Lindsay, K., Maier-Reimer, E., Matear, R., Monfray, P., Mouchet, A., Najjar, R. G., Plattner, G.-K., Rodgers, K. B., … Yool, A. (2005). Anthropogenic ocean acidification over the twenty-first century and its impact on calcifying organisms. Nature, 437(7059), 681–686. https://doi.org/10.1038/nature04095
[2]. Buth, J. M. (2016). Ocean acidification: Investigation and presentation of the effects of elevated carbon dioxide levels on seawater chemistry and calcareous organisms. Journal of Chemical Education, 93(4), 718–721. https://doi.org/10.1021/acs.jchemed.5b00676
[3]. Tziperman, E. (2022). Chapter 5: Ocean Acidification. In Global warming science: A quantitative introduction to climate change and its consequences (pp. 82–89). essay, Princeton University Press.
[4]. Weiss, R. F., Jahnke, R. A., & Keeling, C. D. (1982). Seasonal effects of temperature and salinity on the partial pressure of CO2 in seawater. Nature, 300(5892), 511–513. https://doi.org/10.1038/300511a0
[5]. Sulpis, O., Jeansson, E., Dinauer, A., Lauvset, S. K., & Middelburg, J. J. (2021). Calcium carbonate dissolution patterns in the Ocean. Nature Geoscience, 14(6), 423–428. https://doi.org/10.1038/s41561-021-00743-y
[6]. Tziperman, E. (2022). Chapter 5: Ocean Acidification. In Global warming science: A quantitative introduction to climate change and its consequences (pp. 95). essay, Princeton University Press.
[7]. Brini, M., Calì, T., Ottolini, D., Carafoli, E. (2013). Intracellular Calcium Homeostasis and Signaling. In: Banci, L. (eds) Metallomics and the Cell. Metal Ions in Life Sciences, vol 12. Springer, Dordrecht. https://doi.org/10.1007/978-94-007-5561-1_5
[8]. Jiang, L., Dunne, J., Carter, B. R., Tjiputra, J. F., Terhaar, J., Sharp, J. D., Olsen, A., Alin, S., Bakker, D. C., Feely, R. A., Gattuso, J., Hogan, P., Ilyina, T., Lange, N., Lauvset, S. K., Lewis, E. R., Lovato, T., Palmieri, J., Santana‐Falcón, Y., … Ziehn, T. (2023). Global surface ocean acidification indicators from 1750 to 2100. Journal of Advances in Modeling Earth Systems, 15(3). https://doi.org/10.1029/2022ms003563.