


1. Introduction
Transportation relies heavily on the consumption of large amounts of nonrenewable energy sources each year, resulting in the release of growing amounts of greenhouse gases into the atmosphere and reducing the amount of heat that can escape from the Earth. The impact has become evident since 2022, as the Earth has been undergoing a substantial increase in temperature compared to four decades earlier. Specifically, the Arctic region has experienced temperatures that are 2 to 3 times higher than previous levels [1]. In light of the importance of the worsening temperature conditions, the Paris Agreement, an international convention established in 2015, was designed to tackle the problem of global warming and set limits on its effects [2]. The global consciousness has also spurred governments and corporations to enact strategies for mitigating greenhouse gas emissions. The objective of the Paris Agreement was to limit the increase in global temperature to 1.5°C by the year 2030. Similarly, Formula One set a goal to attain net zero carbon emissions by the year 2050. Meanwhile, organizations worldwide have devised distinct strategies to reduce emissions in transportation, incorporating some of the foremost renewable energy sources in the field: The utilization of biofuel in motor and jet transportation, the implementation of supercapacitors in electric cars, and the incorporation of hydrogen in vehicles. Biofuel is a liquid fuel that reduces carbon dioxide emissions from jets and vehicles. Biofuel is generated by the process of fermenting industrial and agricultural waste materials, resulting in the production of ethanol. This ethanol is subsequently converted into gasoline. Supercapacitors are a cutting-edge power technology. Hydrogen energy is generated through the reaction of hydrogen gas with oxygen. The study will employ a literature review method to examine the advancements in energy innovation within the domains of internal combustion engines and electric motors in automobiles, waterborne transportation, and aircraft. and offer perspective on its future trajectory.
2. Overview of the energy innovation progress of varies means of transportation
2.1. Biofuel
The utilization of Biofuel can be categorized into four generations: The first generation involves the use of basic crops and edible materials. The second generation involves the use of additional food stock and fewer food crops. The third generation utilizes microalgae and macroalgae technology, which mimic the roots and parts of plants. The fourth generation involves the use of carbon dioxide capture and biofuel generation technology, utilizing less edible sources and agricultural products. This fourth generation is considered more sustainable compared to the previous generations. The fourth generation has the ability to substitute the current motor transportation powered by ethanol and diesel [3]. Nevertheless, both companies and individuals may encounter elevated economic expenses as a result of the exorbitant manufacturing costs associated with fourth-generation biofuels.
The biofuel industry has been developing since the implementation of the first policy in 2002. This policy, sponsored by the Chinese government, established standards for the use of biofuel ethanol and gasoline in aviation. The Chinese government subsequently implemented many policies and standards between 2002 and 2010, as seen in table 1. The majority of the policies are to the advancement of biofuel projects, setting benchmarks, and offering financial incentives to encourage the adoption of biofuel [4]. The regulations implemented between 2002 and the 2010s effectively encouraged the widespread adoption of biofuel. This good trend continued until 2019, when the onset of the pandemic significantly impacted the usage of biofuel, as well as its exports and imports.
From 2019 to 2022, there was a substantial decline in the implementation of general regulations and standards related to Biofuel. The decreases encompass a decline in policies as well as a reduction in investment from both domestic and foreign firms. In relation to those objectives, both Bioethanol and Biodiesel have witnessed a substantial decline in terms of imports, exports, and capacity, but the level of production and the quantity of Biofuel refineries have remained constant.
Table 1. The policies in the field of biofuel
Year | Policies |
2002 | Develop fuel in ethanol and gasoline |
2004 | Expand the use of Biofuel |
2006 | Strength the management of Biofuel |
2007 | Promise development in mid and long term |
2009 | Use of Biodiesel |
2010 | Place tax on waste oil base biodiesel |
Regarding the Biofuel Market, figure 1 illustrates that the use of Biofuel will be assessed based on the consumption, exports, and imports of renewable Biofuel, specifically renewable ethanol and Biomass based diesel. According to the statistics from the ethanol production supply and distribution database, the output of renewable ethanol has been steadily expanding from 2014 to the first quarter of 2023, rising from 6,921 million liters to 12,087 million liters. The ethanol consumption is projected to rise from 2975 million liters in 2014 to 3898 million liters in 2023. Nevertheless, there is a decline in imports and exports throughout the period from 2020 to 2023 (Imports: 550 to 0 million liters and Exports: 21 - 2 million liters) [5].
Conversely, the consumption of Biodiesel declined from 1140 to 850 million liters. The imports experienced a decline from 2020, whilst the exports steadily increased from the first quarter of 2023. This growth can be attributed to the strong profitability observed during the initial season.
In general, the consumption, imports, and exports differ between two types of Biofuel - ethanol and biodiesel. However, the pandemic has had a significant impact on the importation of two specific types of biofuels [5].
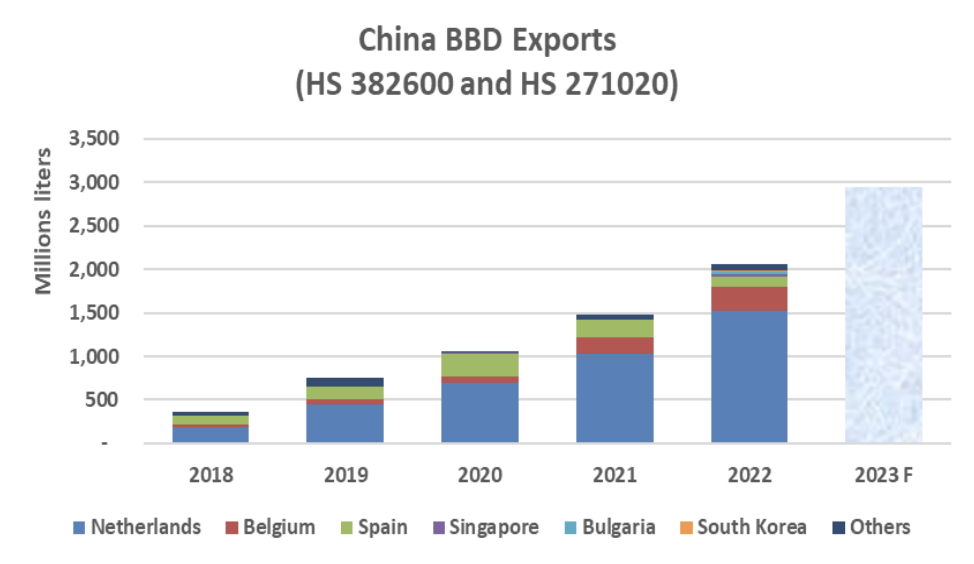
Figure 1. China’s BBD (Biodiesel) Exports [6]
2.2. Electric vehicle
Electric vehicles constitute 36% of the overall car usage in 2023, making them the largest contributor among the three renewable energy sources for transportation. Electric cars are primarily classified into two groups known as new energy vehicles. These vehicles utilize non-fossil fuel as the principal energy source to power the vehicle’s motors. A Battery Electric Vehicle (BEV) is a type of vehicle that primarily relies on electricity to power its electric motors, with a battery serving as the main storage medium for the electricity. Plug-in hybrid electric vehicles (PHEVs) are a type of electric vehicle that employ hybrid motors, which combine the use of both petrol and energy to propel the vehicle. The PHEV will utilize fuel as an energy source in situations where there is insufficient electrical storage available. PHEVs are commonly believed to offer a greater range of travel and exhibit more efficient energy utilization. While electric vehicles are effective in reducing greenhouse gas emissions, improving energy efficiency, and reducing noise pollution, China has a lower rate of electric vehicle adoption per person compared to other developed countries. China has 0.86 electric vehicles per 1000 people, whereas the United States has 2.3 electric vehicles per 1000 people [7].
China employed both monetary and non-monetary policies to boost the domestic electric vehicle market, as demonstrated in tables 2 and 3. The implementation of monetary policies for electric vehicles began on a significant scale from 2009 to 2012. This involved the introduction of subsidies for both electric car users and manufacturers, based on the amount of fuel that can be saved. From 2013 to 2015, the policies implemented economic measures, such as tax reductions, to stimulate the growth of electric vehicle sales. From 2017 to 2020, the Chinese government implemented policies to decrease the subsidy granted by 20%, and plans to further reduce it by 40% in 2019 and 2020. The reduction in subsidies aims to control and stabilize the electric car market while implementing stringent standards and regulations for the future domestic market [7]. Concurrently, non-monetary measures were put into effect to provide financial and technological support to the market. Due to the implementation of fiscal and monetary policies between 2009 and 2019, there was a substantial growth in production, consumption, imports, and exports.
Table 2. Monetary policies for electric vehicle
Year | Monetary Policies |
2009 - 2012 | Subsidiary level based on the saved patrol rate |
2013 | Promote EV expansion |
2014 | Tax reduction - consumption |
2015 | Reduction in subsidiary |
2017 - 2018 | 20% reduction in subsidiary |
2019 - 2020 | 40% reduction in subsidiary |
Table 3. Non-monetary policies for electric vehicle
Year | Non Monetary Policies |
1991 | R & D Assistance |
2001 | EV studies |
2015 | Exemption from traffic control Exemption from quota system Financial assistance to charging stations |
In terms of the market, the implementation of electric vehicle policies, such as subsidies, exemptions, and financial aid, over the past few decades has greatly boosted the market. This has resulted in the achievement of the 5 million electric vehicle production target set in 2010, with BYD being the leading consumer in the market. In 2018, the manufacturing level experienced its largest growth, resulting in the production of 1400 thousand units. Concurrently, there was a 4.2% growth in imports from 2017, resulting in 78,500 units in 2018 and 158,600 units in 2019. In 2020, there was a decline as a result of the epidemic that began in 2019 [8].
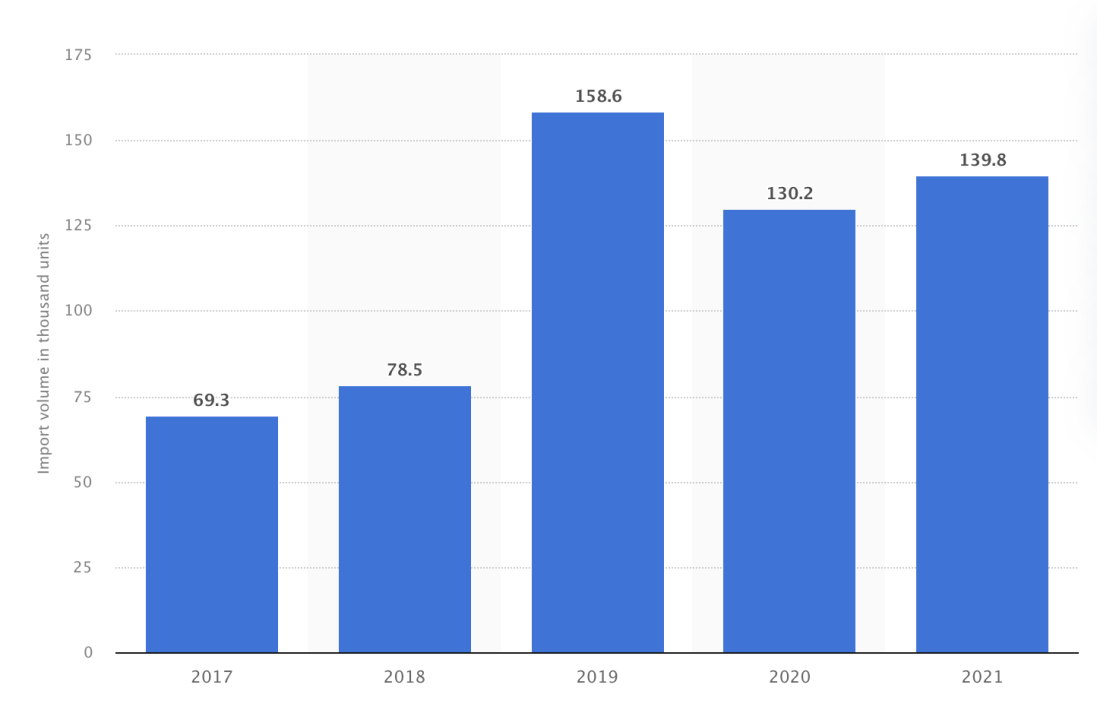
Figure 2. New Energy Vehicle Imports [9]
2.3. Hydrogen Vehicles
Hydrogen Vehicles, also known as FCV, are a type of sustainable vehicle classified as new energy vehicles, or NEV. These cars employ hydrogen as an energy source to produce electricity, which is then utilized to power the motors. Electric automobiles offer advantages such as smaller motors, longer travel distances, and shorter recharging times compared to other vehicles [10]. Hydrogen can be generated from main sources such as gasoline, coal, nuclear power, or renewable energy. The sustainability of hydrogen sources, or their potential to reduce pollution, is contingent upon the primary source from which they are derived. China currently accounts for one third of global hydrogen production, making it a major player in the industry [10]. If China continues to uphold its existing policies, collaborations, and investments in hydrogen cars, they have the potential to become the leading energy resource in the future.
The implementation of hydrogen policies began in 2014, which was later than the introduction of electric and biofuel vehicles [10], as indicated in table 4. From 2014 to 2019, the Chinese government enforced regulations on hydrogen vehicles and corresponding subsidy criteria, ranging from 200,000 to 500,000 RMB. In 2019, the Chinese government prioritized the development of hydrogen vehicle charging and refueling infrastructure, as well as the necessary facilities for the commercialization of hydrogen vehicles. The government planned to extend the financial subsidies and adopt an energy law for hydrogen vehicles until 2022 in 2020 [10]. These measures facilitated the strong growth of FCV and contributed to its global market dominance.
Table 4. Policies for Hydrogen Vehicles [11]
Year | Policies |
2014 | FCV policies standard R&D Initiation |
2016 | Industrialize Hydrogen Energy and Fuel Cell - 13th Five-year plan |
2018 | Establish subsidy standard 200,000 |
2019 | Facilities Improvement and commercialization of FCV |
2020 | Hydrogen energy law establishment Extend financial subsidy until 2022 First identified Hydrogen as Energy |
The hydrogen car market is experiencing significant growth, as depicted in figure 3. The output increased from 37 units in 2016 to 9000 units by the end of 2022 [11]. In terms of consumption, sales and ownership of FCVs have been steadily increasing and are expected to increase even faster in the future. China holds a leading position in the export of hydrogen sources, with exports amounting to 2,729 million US dollars in 2021 [12]. Given the significant levels of production, increasing demand, and consumption of hydrogen sources, Fuel Cell Vehicles (FCV) have the potential to become a prominent trend in China’s renewable energy sector.
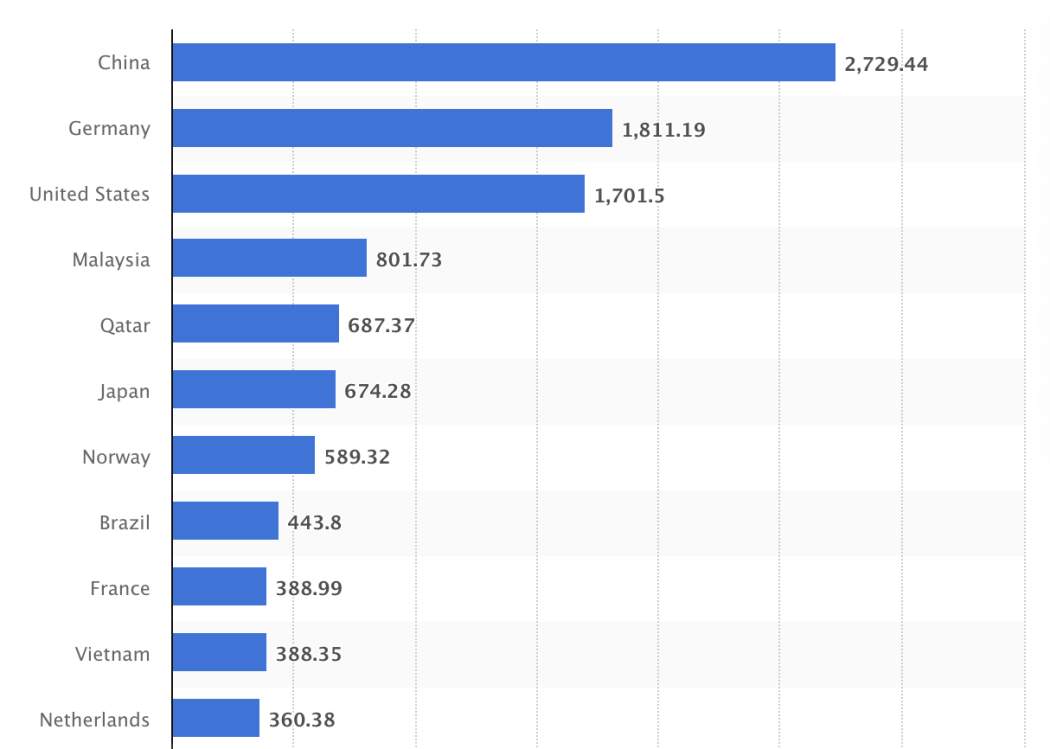
Figure 3. Export of Hydrogen Energy in US Dollar [12]
3. Conclusion
Ultimately, there has been a rise in the utilization of renewable energy sources such as bioethanol, electricity, and hydrogen in terms of their consumption, exports and imports, and production. Despite facing reduced demand and consumption as a result of the pandemic, biodiesel has the potential to replace fossil fuels as the primary energy source for transportation in the coming decades. Additionally, alternative energy sources have already achieved their previous objectives. As for the limitations of this paper, it lacks comprehensive data analysis and did not analyse various aspects of renewable energy in transportation systems in China. As for the future development, all departments might as well encourage the pilot application of hydrogen fuel cell vehicles; promote the priority use of new and clean energy for new and replacement port operation machinery, in-port vehicles and tugboats, and freight yard operation vehicles.
References
[1]. Rantanen, M., Karpechko, A. Y., Lipponen, A., Nordling, K., Hyvärinen, O., Ruosteenoja, K., Vihma, T., & Laaksonen, A. (2022). The Arctic has warmed nearly four times faster than the globe since 1979. Communications Earth & Environment, 3(1), 1–10.
[2]. Paris agreement. (2023). Unfccc.int. https://unfccc.int/process-and-meetings/the-paris-agreement?gclid=Cj0KCQiA4NWrBhD-ARIsAFCKwWvUrxtQdBZgOMP1pYr9gXBaapc4pP0qA7xI1Nk5UzJ_XaxCpMXzW_caAgqIEALw_wcB
[3]. Jayakumar, M., Kaleab Bizuneh Gebeyehu, Lata Deso Abo, Amberbir Wondimu Tadesse, B. Vivekanandan, Venkatesa Prabhu Sundramurthy, Bacha, W., Veeramuthu Ashokkumar, & Gurunathan Baskar. (2023). A comprehensive outlook on topical processing methods for biofuel production and its thermal applications: Current advances, sustainability and challenges. Fuel, 349, 128690–128690.
[4]. Hao, H., Liu, Z., Zhao, F., Ren, J., Chang, S., Rong, K., & Du, J. (2018). Biofuel for vehicle use in China: Current status, future potential and policy implications. Renewable and Sustainable Energy Reviews, 82, 645–653.
[5]. Erin Covert and FAS China Staff. (2023). Biofuel Annual, .United States Department of Agriculture, pp. 9, 13, 18, 19, 21.
[6]. Hao, X., Zhou, Y., Wang, H., & Ouyang, M. (2020). Plug-in electric vehicles in China and the USA: a technology and market comparison. Mitigation and Adaptation Strategies for Global Change, 25(3), 329–353.
[7]. Wang, Y. (2022). The Industrial Structure and Operating Model of Emerging Electric Vehicle Charging Infrastructure in China. BCP Business & Management, 32, 109–117.
[8]. Statista. (2022).. China: import volume of new energy vehicles 2021. Statista. https://www.statista.com/statistics/1197538/china-import-volume-of-new-energy-vehicles/#:~:text=Import%20volume%20of%20new%20energy%20cars%20from%20China%202017%2D2021&text=In%202021%2C%20China%20imported%20around
[9]. Song, Y., Zhang, X., Xu, S., Guo, X., Wang, L., Zheng, X., Huang, W., He, Y., Liu, R., Yan, X., & Ma, J. (2020). International Hydrogen Energy Policy Summary and Chinese Policy Analysis, IEEE Conference Publication.
[10]. Sun, Z., Liu, F.-S., Liu, X., Sun, B., & Sun, D.-W. (2012). Research and development of hydrogen fuelled engines in China. International JournalofHydrogenEnergy,37(1),664–681.
[11]. International Trade Administration of the United State. (2022). China Hydrogen Vehicle Market. Www.trade.gov. https://www.trade.gov/market-intelligence/china-hydrogen-vehicle-market#:~:text=China
[12]. Leading hydrogen exporting countries. (2023). Statista. https://www. statista.com/statistics/ 1411880/hydrogen-leading-exporting-countries/
Cite this article
Chen,K. (2024). The application of renewable energy in transportation systems in China. Applied and Computational Engineering,63,28-33.
Data availability
The datasets used and/or analyzed during the current study will be available from the authors upon reasonable request.
Disclaimer/Publisher's Note
The statements, opinions and data contained in all publications are solely those of the individual author(s) and contributor(s) and not of EWA Publishing and/or the editor(s). EWA Publishing and/or the editor(s) disclaim responsibility for any injury to people or property resulting from any ideas, methods, instructions or products referred to in the content.
About volume
Volume title: Proceedings of the 4th International Conference on Materials Chemistry and Environmental Engineering
© 2024 by the author(s). Licensee EWA Publishing, Oxford, UK. This article is an open access article distributed under the terms and
conditions of the Creative Commons Attribution (CC BY) license. Authors who
publish this series agree to the following terms:
1. Authors retain copyright and grant the series right of first publication with the work simultaneously licensed under a Creative Commons
Attribution License that allows others to share the work with an acknowledgment of the work's authorship and initial publication in this
series.
2. Authors are able to enter into separate, additional contractual arrangements for the non-exclusive distribution of the series's published
version of the work (e.g., post it to an institutional repository or publish it in a book), with an acknowledgment of its initial
publication in this series.
3. Authors are permitted and encouraged to post their work online (e.g., in institutional repositories or on their website) prior to and
during the submission process, as it can lead to productive exchanges, as well as earlier and greater citation of published work (See
Open access policy for details).
References
[1]. Rantanen, M., Karpechko, A. Y., Lipponen, A., Nordling, K., Hyvärinen, O., Ruosteenoja, K., Vihma, T., & Laaksonen, A. (2022). The Arctic has warmed nearly four times faster than the globe since 1979. Communications Earth & Environment, 3(1), 1–10.
[2]. Paris agreement. (2023). Unfccc.int. https://unfccc.int/process-and-meetings/the-paris-agreement?gclid=Cj0KCQiA4NWrBhD-ARIsAFCKwWvUrxtQdBZgOMP1pYr9gXBaapc4pP0qA7xI1Nk5UzJ_XaxCpMXzW_caAgqIEALw_wcB
[3]. Jayakumar, M., Kaleab Bizuneh Gebeyehu, Lata Deso Abo, Amberbir Wondimu Tadesse, B. Vivekanandan, Venkatesa Prabhu Sundramurthy, Bacha, W., Veeramuthu Ashokkumar, & Gurunathan Baskar. (2023). A comprehensive outlook on topical processing methods for biofuel production and its thermal applications: Current advances, sustainability and challenges. Fuel, 349, 128690–128690.
[4]. Hao, H., Liu, Z., Zhao, F., Ren, J., Chang, S., Rong, K., & Du, J. (2018). Biofuel for vehicle use in China: Current status, future potential and policy implications. Renewable and Sustainable Energy Reviews, 82, 645–653.
[5]. Erin Covert and FAS China Staff. (2023). Biofuel Annual, .United States Department of Agriculture, pp. 9, 13, 18, 19, 21.
[6]. Hao, X., Zhou, Y., Wang, H., & Ouyang, M. (2020). Plug-in electric vehicles in China and the USA: a technology and market comparison. Mitigation and Adaptation Strategies for Global Change, 25(3), 329–353.
[7]. Wang, Y. (2022). The Industrial Structure and Operating Model of Emerging Electric Vehicle Charging Infrastructure in China. BCP Business & Management, 32, 109–117.
[8]. Statista. (2022).. China: import volume of new energy vehicles 2021. Statista. https://www.statista.com/statistics/1197538/china-import-volume-of-new-energy-vehicles/#:~:text=Import%20volume%20of%20new%20energy%20cars%20from%20China%202017%2D2021&text=In%202021%2C%20China%20imported%20around
[9]. Song, Y., Zhang, X., Xu, S., Guo, X., Wang, L., Zheng, X., Huang, W., He, Y., Liu, R., Yan, X., & Ma, J. (2020). International Hydrogen Energy Policy Summary and Chinese Policy Analysis, IEEE Conference Publication.
[10]. Sun, Z., Liu, F.-S., Liu, X., Sun, B., & Sun, D.-W. (2012). Research and development of hydrogen fuelled engines in China. International JournalofHydrogenEnergy,37(1),664–681.
[11]. International Trade Administration of the United State. (2022). China Hydrogen Vehicle Market. Www.trade.gov. https://www.trade.gov/market-intelligence/china-hydrogen-vehicle-market#:~:text=China
[12]. Leading hydrogen exporting countries. (2023). Statista. https://www. statista.com/statistics/ 1411880/hydrogen-leading-exporting-countries/