


1. Introduction
This article will review the research on New York City taxi demand forecasting over the past decade, with the aim of comprehensively reviewing the application and development of the Autoregressive Integrated Moving Average Model (ARIMA) model in this field. Through a detailed analysis and summary of the relevant literature, we will discuss the limitations of the existing research and the problems to be solved, and propose the direction and prospect of future research. At present, a series of improved models and algorithms have been put into use and achieved certain results. Aling Luo et al. proposed a new approach: Spatiotemporal diffusion Convolutional networks (STDCN), used to predict the demand for taxis, The performance of this method is better than many recent deep learning models such as Long Short-Term Memory (LSTM), Diffusion Convolutional Recurrent Neural Network (DCRNN), Space-Time Graph Convolutional Network (STGCN) [1]. Chen et al. predicted the taxi flow through the multi-task GCNLSTM(MGLN) network, used LSTM to extract the time characteristics of the traffic flow, and trained the model with multi-task learning strategies, with an effect superior to the most advanced traffic prediction methods [2]. Chen et al. established and compared three models of Reconfigurable Furnace Module (RFM), Radio Resource Management (RRM) and Constitutive Force Model (CFM), and found that the prediction effect of CFM is better than the other two methods [3]. Zhi et al. combined Classification and Regression Trees (CART) and K-Nearest Neighbor (KNN) models to forecast the short-term demand of taxis, taking into account the spatiotemporal heterogeneity of taxi demand, and effectively improving the prediction accuracy [4]. Zhu et al. used Spark parallel computing to train the temporal horizontal and longitudinal analysis model through deep neural network Deep Neural Networks (DNN) [5]. Based on the theoretical overview of travel hotspot areas, Zhang used K-means algorithm, BIRCH algorithm and GMM algorithm to excavate hot spots in working days and non-working days, compares and analyzes residents' travel hotspot areas in working days and non-working days, and describes residents' travel behaviors [6].
As a mathematical analysis method, ARIMA plays an important role in time series analysis. Hu conducted the ARIMA model time series prediction and analysis on the change of Guangzhou's water ecological footprint, and predicted the future change of Guangzhou's water ecological footprint according to its development and change law [7]. Based on China's total energy consumption data from 1978 to 2005, Liu et al. applied ARIMA model to forecast, and achieved the optimal forecasting effect under the meaning of minimum variance [8].
For different aspects of the problem, also through different models and algorithms targeted to solve. Aiming at the dynamic uncertainty of urban taxi demand, Lu Yi et al. built artificial neural network BP network prediction model on the basis of analyzing the characteristics and influencing factors of urban taxi demand system, and carried out numerical simulation with MATLAB to study the dynamic law of changes in urban taxi demand, so as to make effective prediction of urban taxi demand [9]. In view of the problems such as long empty taxi driving time, low matching efficiency between people and vehicles, and short supply in real life, Meng et al. studied a taxi demand prediction model based on Spark and optimized BP neural network to forecast the total rental demand of a certain area in the city in the future day [10]. Chen et al. proposed a data processing model based on DBSCAN algorithm to solve the problems of the high empty load rate of urban taxis and the difficulty for passengers to take taxis [11]. K-means algorithm was used to perform cluster analysis on the data to obtain the hot spots for passengers and passengers, providing a feasible method to solve the problem.
It is necessary to study the taxi demand forecast and the relevant data of taxi resource allocation under the big data platform. Zhang et al. selected the intelligent travel platform of Didi Kuaidi and Autonade LBS Big data platforms such as open platform and analyzable think tank, combined with the judgment of some big data research institutions on the current taxi resource allocation problem, analyzed the taxi resource allocation situation and proposed an optimization plan [12].
Through this review, the objective is to attain a comprehensive understanding of the forecast demand for New York City taxis and the current situation and challenges of taxi scheduling. The research will provide valuable reference and guidance, and provide new ideas and methods for future research and practical work. Research found that with sound forecasting and optimized scheduling, taxi services in New York City will be able to better meet the needs of citizens and provide more efficient and convenient transportation options.
2. Methods
2.1. Data source and description
The data is obtained from the database of yellow taxis in New York City. These data were collected from yellow taxis in the New York from January 2nd to January 4th, 2019. The data is stored in csv files which contains detailed itinerary information, including itinerary length, start and end times, departure and destination. It shows as Table 1.
Table 1. Attribute information. | ||
Field | Instruction | |
tpep_pickup_datetime | Pick up time | |
tpep_dropoff_datetime | Drop off time | |
trip_distance | Distance of trip | |
PULocationID | Pick up place | |
2.2. Indicator selection and description
The researchers used the number of daily taxi orders in the New York area as an indicator. On an hourly basis, the difference in orders within each hour reflects the demand of passengers at different time periods. In this way, we can understand the number of taxis required at different time periods, so that the company can determine a reasonable scheduling and arrangement of taxis at different times (Figure 1).
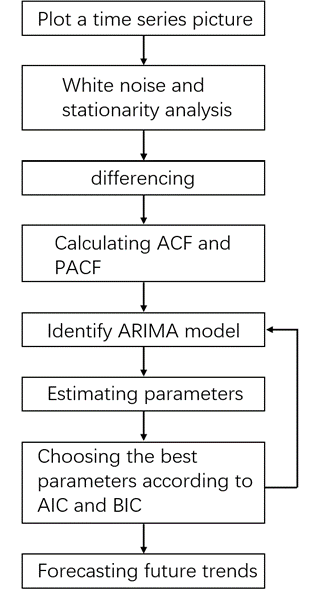
Figure 1. Flow chart of establishing predicting model.
2.3. Method introduction
Based on a preliminary analysis of the data, it is clear that the demand for taxis is closely related to time. According to the correlation between taxi demand and time series, we use ARIMA model to forecast taxi demand. Autoregressive Integrated Moving Average Model is shortly named ARIMA. It is composed of three techniques of autoregressive (AR), differencing and moving average. ARIMA transforms a non-stationary time series into a stationary time series, regresses the dependent variable only on its lagged value and the present and lagged values of the random error term. Based on the results after the first and second differencing, we make a choice of d. Then p and q are selected by the calculation results of ACF and PACF.
\( {y_{t}}=μ+\sum _{i=1}^{p}{γ_{i}}{y_{t-i}}+{ε_{t}}+\sum _{i=1}^{q}{θ_{i}}{ε_{t-i}} \) (1)
\( PACF(k)=\frac{cov[({Z_{t}}-\bar{{Z_{t}}}),({Z_{t-k}}-\bar{{Z_{t-k}}})]}{\sqrt[]{var({Z_{t}}-\bar{{Z_{t}}})}\sqrt[]{var({Z_{t-k}}-\bar{{Z_{t-k}}})}} \) (2)
\( ACF(k)=\frac{\sum _{t=k+1}^{n}({Z_{t}}-\bar{{Z_{t}}})({Z_{t-K}}-\bar{Z})}{\sum _{t=1}^{n}({{Z_{t-K}}-\bar{Z})^{2}}} \) (3)
3. Results and discussion
3.1. Time series plot
The first step is plotting the time series, turn the non-stationary series into stationary series according to the first and second order differences, and make a choice of d.
\( ∆{x_{t}}={x_{t}}-{x_{t-1}}={ω_{t}} \) (4)
According to the time series diagram in Figure 2, these data show stationarity without difference, so the value of d is preliminarily determined to be 0.
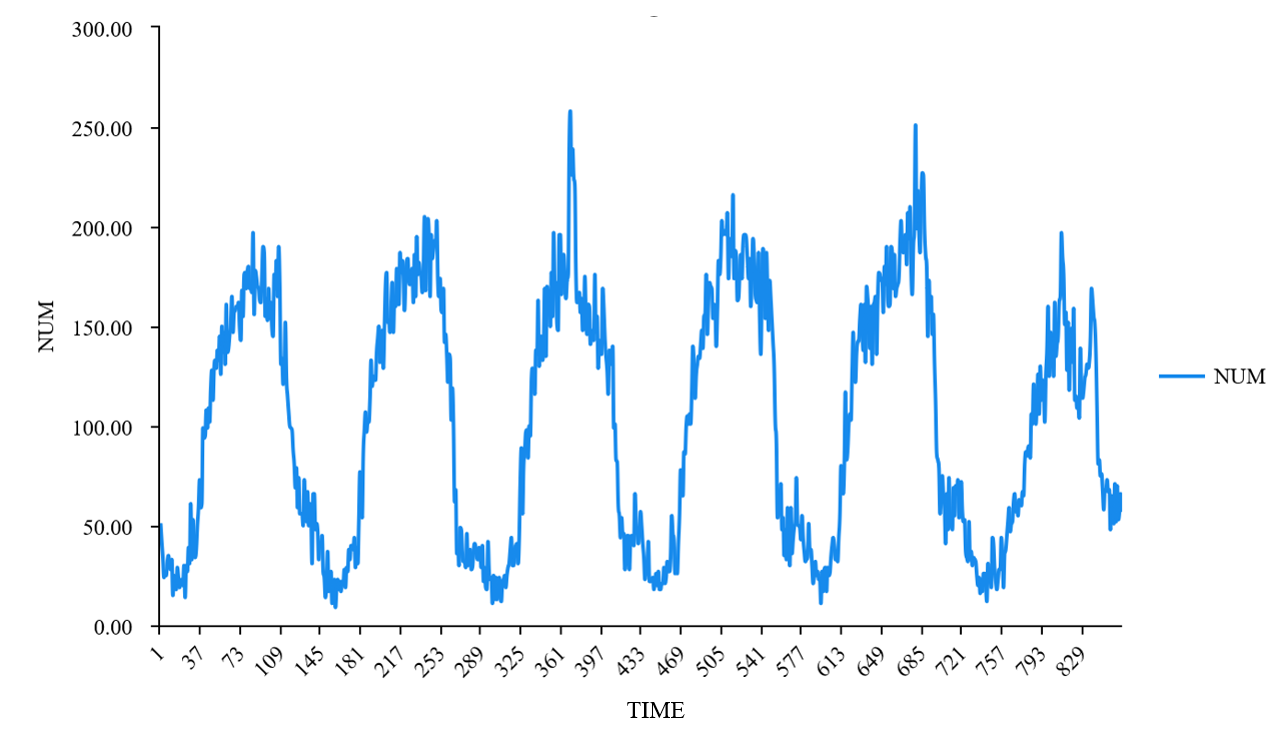
Figure 2. The Time Series Plot.
The ADF test on these data without differencing shows that, as shown in Table 2, the p-value is 0.001 which is less than 0.05 and these data are stationary series, so no differencing is required. So in the ARIMA model, d is 0. This model is also transformed to ARMA.
Table 2. ADF Test of Order Quantity
critical value | ||||||
differencing order | t | p | 1% | 5% | 10% | |
0 | -4.217 | 0.001 | -3.438 | -2.865 | -2.569 | |
3.2. ACF and PACF test
According to Fig 3 and Fig 4, ACF presents a trailing state and PACF is significantly censored after order 2, so p is tentatively determined to be 2 and q needs to be further tested and compared, so different groups of parameters were selected, the first group (p,d,q) = (1,0,1) , the second group (p,d,q) = (2,0,1) , the third group (p,d,q) = (1,0,2) ,the fourth group is (2,0,2) ,the fifth group is (2,0,3) and the last group is (3,0,2).
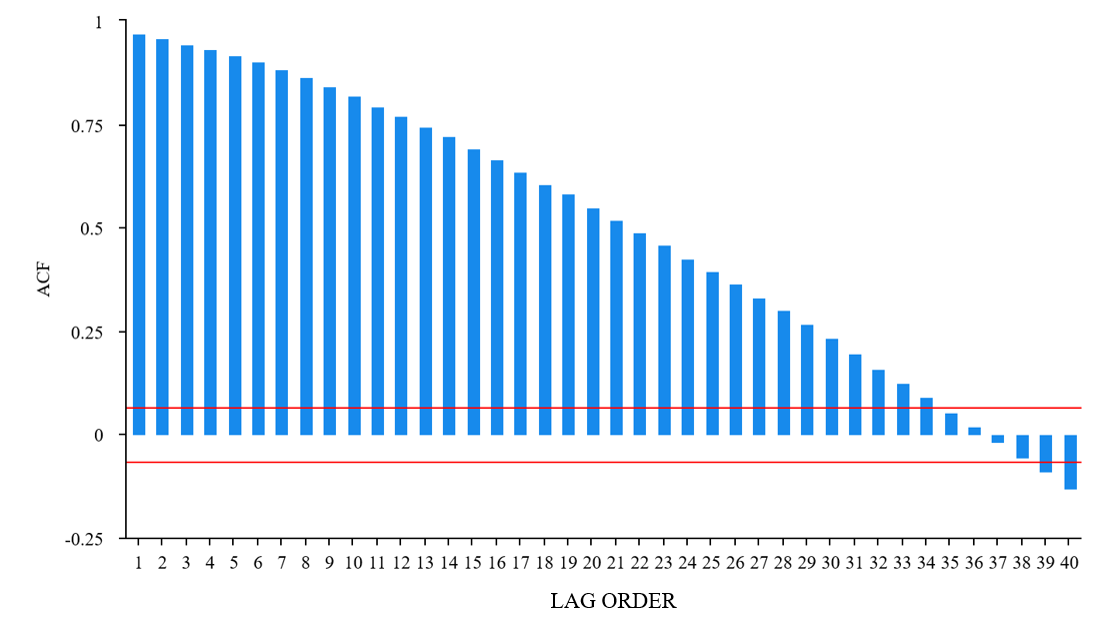
Figure 3. ACF Plots
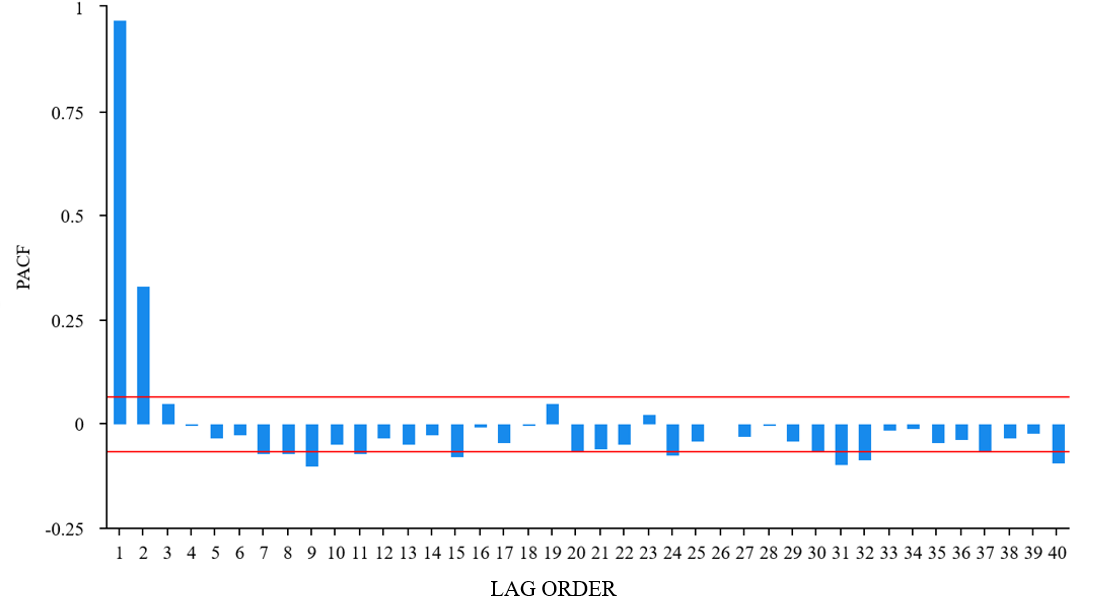
Figure 4. PACF Plots
3.3. The choice of parameters
Several close values of p and q are selected to determine which set of parameters is optimal by calculating AIC and BIC. AIC represents a compromise between the quality of data fitting and the complexity of the model, and provides a value to balance the complexity of the model. AIC selects the model that provides the minimum AIC value, and the smaller the AIC, the better the model's predictive performance on new data. When the sample size is large, the information of AIC fitting error is amplified and cannot converge to the real model. The Bayesian criterion compensates for the shortcomings of AIC.
\( AIC=2k-2ln{(L)} \) (5)
\( BIC=kln{(n)}-2ln{(L)} \) (6)
The parameters can be chosen by these methods and the ARIMA model is built by these parameters.
It can be clearly seen from Table 3 that the AIC and BIC of the fourth group of parameters are the lowest. Root Mean Square Error (RMSE) and Mean Absolute Error (MAE) are also the smallest. Considering the fitting effect and the model complexity, it can be concluded that the model has the best effect when (p,d,q) = (2,0,2) .
Table 3. Comparison of different parameters.
(p,d,q) | (1,0,1) | (1,0,2) | (2,0,1) | (2,0,2) | (2,0,3) | (3,0,2) |
AIC | 7057.095 | 7053.671 | 7054.118 | 6991.363 | 7015.91 | 7057.141 |
BIC | 7076.142 | 7077.479 | 7077.926 | 7019.933 | 7049.241 | 7090.472 |
MAE | 11.089 | 11.0463 | 11.0519 | 10.4424 | 10.6456 | 11.0485 |
RMSE | 14.3525 | 14.311 | 14.3139 | 13.818 | 13.9666 | 14.3069 |
3.4. Model results
According to this parameter, a line chart between the fitted curve and the true value is obtained. The dark blue line is the true value, and the light blue line is the fitted value, which basically coincides, indicating that the model fits well.
Based on this set of parameters, 30 epochs are predicted backward, and the results are shown in Table 4, the green curve on the right is the prediction, and the orange curve is the 95% lower bound of the prediction.
Through the analysis of the results, it is found that the model has a high accuracy rate, which proves that its ability to predict short-term taxi demand is strong. At the same time, with the increase of input data, the degree of fitting and prediction accuracy of the model are gradually improved. By improving the fit of the model to the actual data, a positive relationship between the amount of data and model performance is evident, leading to more accurate prediction.
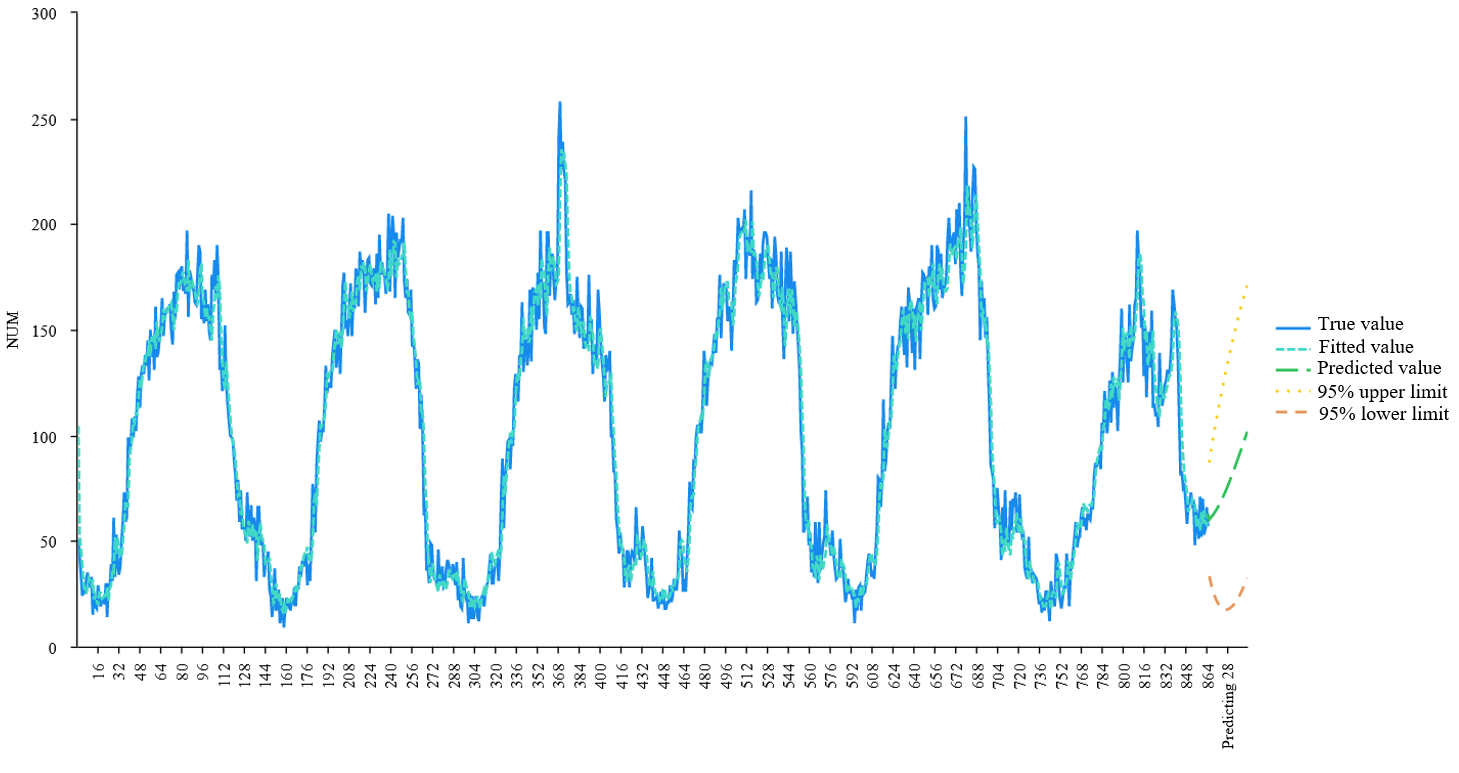
Figure 5. The ARMA (2,2) Model Fitting Plot
4. Conclusion
This paper presents an in-depth analysis of taxi demand in New York City, using an ARIMA model to predict taxi demand every 10 minutes of the day. This study employs a dataset containing full-day taxi trip times that allows researchers to simulate demand fluctuations throughout the day, scrutinizes model fit and forecast accuracy to gain deeper insight into taxi demand patterns and help forecast future demand.
Through the study, it is found that ARIMA model can be used to analyze and predict significant stationary data under time series. For example, train demand prediction and shared bicycle demand prediction during regular periods. However, this method has certain limitations, it cannot study the data prediction under the influence of multiple factors, and the dimension is single, which is not suitable for analyzing the data affected by complex factors.
In summary, this paper affirms the utility of using ARIMA models for predictive analysis in the context of taxi demand. The high fit of the predicted data to the actual data highlights the potential value of the model for urban transportation planning and operations. Predictive analytics can be a powerful tool for the transportation industry, not only for individual drivers, but also for urban planners and taxi companies to strategically manage resources and improve service levels for commuters.
References
[1]. Luo L, et al. 2022 Spatiotemporal Diffusion Convolutional Networks: A New Framework for Taxi Demand Forecasting. ISPRS International Journal of Geographic Information, 11, 193.
[2]. Chen Z, et al. 2020 Multitasking learning and traffic road network based on GCN taxi demand forecast. Journal of Sensors, 13, 3776.
[3]. Liu Z, Chen H, Li Y and Zhang Q 2014 Multi-path urban traffic demand forecasting model. Journal of Traffic Management, 32, 1-2.
[4]. Yan Z and Lu S 2021 A short-term forecast model of taxi demand based on spatiotemporal heterogeneity. Journal of Intelligent & Fuzzy Systems, 4122, 4175-4186.
[5]. Shi Z, et al. 2024 A prediction method of taxi boarding demand based on deep learning. Working paper.
[6]. Zhang C 2023 Research on the hot spots of taxi travel demand short-term forecast model. Doctoral dissertation, Dalian Maritime University.
[7]. Hu Y H 2006 Time series analysis of regional water ecological footprint based on ARIMA model. The Ecological Environment, 11, 5.
[8]. Liu Y and Wang X 2007 Application of ARIMA Model in Energy consumption forecasting in China. Economic Economics, 4.
[9]. Lu Y, Wang L and Lu X 2007 Research on Simulation and prediction Model of Urban taxi Demand. Traffic Science and Engineering, 44.
[10]. Meng Z and Yu S 2023 Taxi demand prediction model based on Spark and optimized BP neural network. Data and Computing Development Frontier, 544, 112-126.
[11]. Chen L and Nie W 2019 Hot research hotspots and taxi passenger data. Computer System Application, 2844, 32-38.
[12]. Zhang D, He X and Wang X 2016 Analysis and Optimization of taxi resource allocation under Big Data Platform. Modern Marketing, 20, 190.
Cite this article
Li,Z.;Liu,J.;Yang,X. (2024). New York city taxi demand forecast based on ARIMA model. Applied and Computational Engineering,68,143-149.
Data availability
The datasets used and/or analyzed during the current study will be available from the authors upon reasonable request.
Disclaimer/Publisher's Note
The statements, opinions and data contained in all publications are solely those of the individual author(s) and contributor(s) and not of EWA Publishing and/or the editor(s). EWA Publishing and/or the editor(s) disclaim responsibility for any injury to people or property resulting from any ideas, methods, instructions or products referred to in the content.
About volume
Volume title: Proceedings of the 6th International Conference on Computing and Data Science
© 2024 by the author(s). Licensee EWA Publishing, Oxford, UK. This article is an open access article distributed under the terms and
conditions of the Creative Commons Attribution (CC BY) license. Authors who
publish this series agree to the following terms:
1. Authors retain copyright and grant the series right of first publication with the work simultaneously licensed under a Creative Commons
Attribution License that allows others to share the work with an acknowledgment of the work's authorship and initial publication in this
series.
2. Authors are able to enter into separate, additional contractual arrangements for the non-exclusive distribution of the series's published
version of the work (e.g., post it to an institutional repository or publish it in a book), with an acknowledgment of its initial
publication in this series.
3. Authors are permitted and encouraged to post their work online (e.g., in institutional repositories or on their website) prior to and
during the submission process, as it can lead to productive exchanges, as well as earlier and greater citation of published work (See
Open access policy for details).
References
[1]. Luo L, et al. 2022 Spatiotemporal Diffusion Convolutional Networks: A New Framework for Taxi Demand Forecasting. ISPRS International Journal of Geographic Information, 11, 193.
[2]. Chen Z, et al. 2020 Multitasking learning and traffic road network based on GCN taxi demand forecast. Journal of Sensors, 13, 3776.
[3]. Liu Z, Chen H, Li Y and Zhang Q 2014 Multi-path urban traffic demand forecasting model. Journal of Traffic Management, 32, 1-2.
[4]. Yan Z and Lu S 2021 A short-term forecast model of taxi demand based on spatiotemporal heterogeneity. Journal of Intelligent & Fuzzy Systems, 4122, 4175-4186.
[5]. Shi Z, et al. 2024 A prediction method of taxi boarding demand based on deep learning. Working paper.
[6]. Zhang C 2023 Research on the hot spots of taxi travel demand short-term forecast model. Doctoral dissertation, Dalian Maritime University.
[7]. Hu Y H 2006 Time series analysis of regional water ecological footprint based on ARIMA model. The Ecological Environment, 11, 5.
[8]. Liu Y and Wang X 2007 Application of ARIMA Model in Energy consumption forecasting in China. Economic Economics, 4.
[9]. Lu Y, Wang L and Lu X 2007 Research on Simulation and prediction Model of Urban taxi Demand. Traffic Science and Engineering, 44.
[10]. Meng Z and Yu S 2023 Taxi demand prediction model based on Spark and optimized BP neural network. Data and Computing Development Frontier, 544, 112-126.
[11]. Chen L and Nie W 2019 Hot research hotspots and taxi passenger data. Computer System Application, 2844, 32-38.
[12]. Zhang D, He X and Wang X 2016 Analysis and Optimization of taxi resource allocation under Big Data Platform. Modern Marketing, 20, 190.