


Cloud computing, Multimodal data, Traffic flow forecast, LSTM neural network.
1. Introduction
With the economic development and the improvement of social productivity, the number of motor vehicles continues to rise sharply. According to the latest data, private car ownership has reached 312 million by 2024. This growing trend has led to many traffic problems. In order to solve these problems, the development of big data technology makes Intelligent Traffic System (ITS) [1] become an important means to solve traffic problems. Traffic flow prediction can be performed by Neural networks, such as Back Propagation Neural Network (BP neural Network), which is a multi-layer feedforward neural network trained according to the reverse propagation of errors, that is, its output results are propagated forward while errors are propagated back. Traditional BP neural network is a local search optimization method to solve complex nonlinear problems. The weight of the network is gradually adjusted along the direction of local improvement, which may cause the algorithm to fall into local extreme value, and the weight converges to the local minimum point, resulting in the failure of network training.This method can help the traffic management department to understand the traffic situation more accurately, and take timely measures to guide and manage the traffic flow, so as to improve traffic efficiency, reduce traffic congestion and accidents, and reduce pollutant emissions, and provide support for the sustainable development of urban transportation system.
2. Related work
2.1. Cloud computing multimodal data
Multimodal cloud computing refers to the method of using cloud computing platforms to process and analyze multiple types of data from different sources and types. This method combines the powerful computing and storage capabilities of cloud computing and the rich information of multi-modal data to realize the comprehensive analysis and solution of complex problems. In practical applications, multimodal cloud computing is widely used in many fields. These include issues such as data security and privacy protection, the complexity of data integration and processing, and the management and cost of computing resources. [2] Therefore, further research and development of relevant technologies and methods are needed in the future to overcome these challenges and achieve wider application and sustainable development of multimodal cloud computing in various fields.
2.2. Traditional traffic flow forecasting
Traditional forecasting models include historical average model, time series model, Kalman filter model, non-parametric regression model, neural network model and combined forecasting model. However, these models have some disadvantages in terms of prediction effect and prediction accuracy. For example, the historical average model ignores the trend and periodicity of data, the time series model is limited by the stationarity and seasonality of data, and the neural network model requires high computational resources and time cost for training and tuning large-scale data sets. Therefore, it is necessary to propose new forecasting models and methods to overcome these disadvantages and improve the accuracy and reliability of traffic flow forecasting. Regression analysis prediction model is a method to predict by analyzing the causal relationship and the degree of impact between things, which is often used to analyze multiple road segments, and the establishment of multiple regression prediction model by stepwise regression method has received great attention. [3-4] The method of regression analysis and prediction is to establish the linear regression equation between the parameters of each section on the basis of obtaining multi-section traffic data. When the data is limited, this method cannot be realized. New prediction models and methods can include neural network models based on deep learning, graph neural network models combining spatiotemporal information, multimodal prediction models integrating multi-source data, etc.
2.3. LSTM prediction model
Recurrent neural network (RNN) models are widely used to manipulate sequence data in machine learning. However, RNN has limitations in learning long-term dependencies due to the disappearance of gradients in multiple backpropagation processes. LSTM networks aim to mitigate the weaknesses of [5] RNN models in long-term sequence data sets. LSTM has a great improvement in recurrent neural networks. LSTM algorithm can accurately predict multivariate time series data. Therefore, LSTM network with excellent ability to process time series data is adopted in this study (Figure 1).
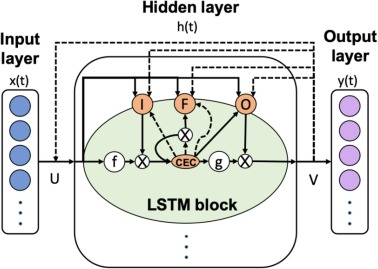
Figure 1. Diagram of Long Short-term memory network (LSTM) structure and LSTM module
The excerpt refers to Figure 1, which depicts a diagram of the Long Short-Term Memory (LSTM) [6] network structure and its module. The LSTM prediction model is highlighted for its significant advantages in urban traffic flow prediction. These advantages stem from its potent time-series modeling capabilities, allowing it to effectively capture long-term dependencies in traffic data, thereby enhancing the accuracy of future traffic flow predictions.
3. Experiment and methodology
3.1. Experimental data set
The experiment will use the PMS-08 dataset, which contains traffic data from the [8-9] SAN Bernardino area from July to August 2016. The data set consists of three characteristics: flow, occupy, and speed. Flow represents the number of vehicles passing through the loop detector in each 5-minute interval; Occupancy rate indicates the proportion of the detector occupied by the vehicle during the 5-minute interval; Therefore, the goal of the prediction model is to predict the occupancy variable in a given period of time and correctly rank the locations with high vehicle traffic to optimize the selection of patrol locations [7]. The formal problem statement is: For N times of the occupancy variable prediction and K positions, build a prediction model to minimize the sum of Spearman correlations between the predicted and actual values. The current strategy is to first focus on minimizing \( \sum _{t=0}^{N-1}{p_{t}} \) ,where \( {p_{t}} \) is defined as the Spearman correlation of the prediction values and the actual values.for the actual value of occupancy and then simply use ranking of the values. To do this, an LSTM model is trained, using the moving average of previous occupancy values as a baseline.
3.2. Data Formatting
Contains the converted traffic data set, where each row represents traffic information at a location under a time step. The dataset has a total of 17,856 time steps and 170 locations. Each row contains five features: timestep, location, flow, occupy, and speed. Through this table, we can analyze and study the changes of traffic flow at different times and locations.In addition, the data formatting of this dataset makes it more suitable for further data analysis and modeling. Traffic flow can be predicted and analyzed by statistical methods, machine learning algorithms and other means, so as to provide more information and support for traffic management and planning. By studying these data, we can better understand the regularity and trend of traffic flow, so as to provide reference and guidance for the optimization and improvement of urban traffic system.
3.3. Data preprocessing and model
In this section, we perform data visualization and exploratory data analysis [8](EDA) on the traffic data to better understand the characteristics and distribution of the data in preparation for subsequent modeling efforts.we load the traffic data and convert it to DataFrame format. By outputting the basic information of the data, statistical description and drawing the histogram, we have carried on the preliminary observation and analysis of the data.
Table 2. Data set preprocessing result table
timestep | location | flow | occupy | speed | |
count | 3.035520e+06 | 3.035520e+06 | 3.035520e+06 | 3.035520e+06 | 3.035520e+06 |
mean | 8.928500e+03 | 8.450000e+01 | 2.306807e+02 | 6.507109e-02 | 6.376300e+01 |
std | 5.154584e+03 | 4.907393e+01 | 1.462170e+02 | 4.590215e-02 | 6.652010e+00 |
min | 1.000000e+00 | 0.000000e+00 | 0.000000e+00 | 0.000000e+00 | 3.000000e+00 |
25% | 4.464750e+03 | 4.200000e+01 | 1.100000e+02 | 3.570000e-02 | 6.260000e+01 |
50% | 8.928500e+03 | 8.450000e+01 | 2.150000e+02 | 6.010000e-02 | 6.490000e+01 |
75% | 1.339225e+04 | 1.270000e+02 | 3.340000e+02 | 8.390000e-02 | 6.740000e+01 |
max | 1.785600e+04 | 1.690000e+02 | 1.147000e+03 | 8.955000e-01 | 8.230000e+01 |
Table 2 shows the pre-processing of traffic flow data, including the number, mean value, standard deviation, minimum value, 25% quantile, median value, 75% quantile and maximum value. These statistics can help us to have a preliminary understanding of the overall distribution and characteristics of the data.
These statistical information are of great significance to the experiment, which can help us understand the distribution and characteristics of traffic data, and provide reference for the subsequent data processing and modeling work. Especially in data cleaning, feature engineering and model selection, these statistical information can guide us to choose appropriate methods and strategies to improve the efficiency and accuracy of the experiment.Understanding speed distribution helps assess traffic congestion and safety, providing crucial inputs for traffic management and planning. Additionally, focusing on a specific location (location_0) highlights clear seasonal trends, particularly in occupancy rates, which can aid in predictive modeling for traffic management.
3.4. Model Training
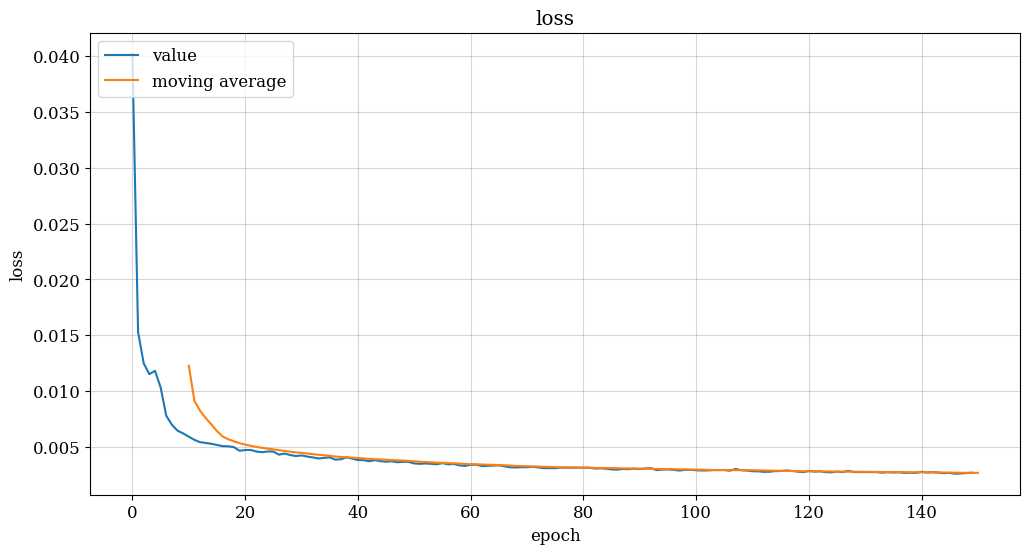
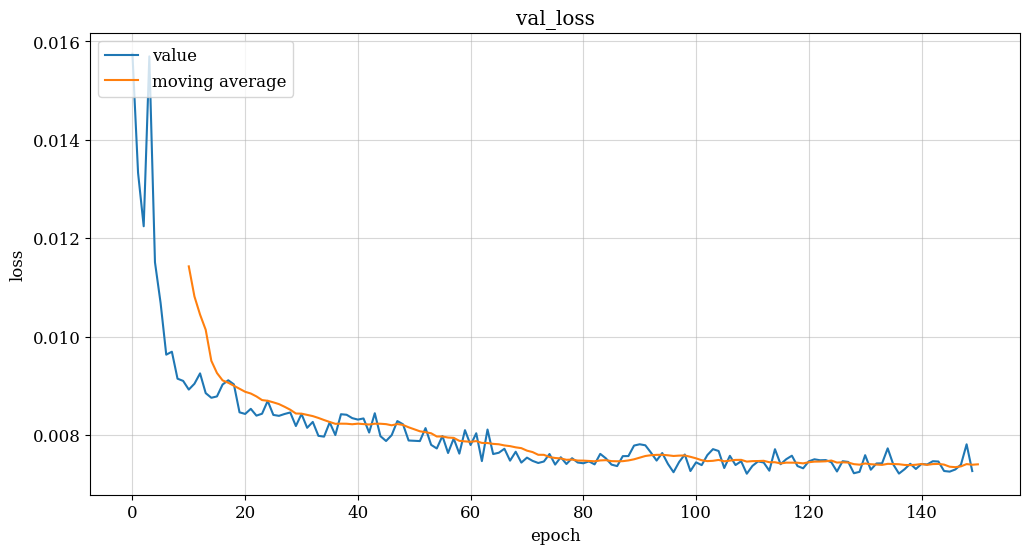
In this section, we will use a model with two LSTM layers to make predictions. The input layer will be an LSTM layer, and the output layer will output a vector of 170 values, each of which is used to predict the traffic occupancy of each location. The LSTM layer was chosen because LSTM can remember information about previous time steps and derive information from the relationships between them.Once the model architecture, as depicted in Figure 3, is determined, training the model involves tuning hyperparameters such as epoch (the number of training iterations) and batch_size (the number of data instances processed in each forward and backward pass). Additionally, a validation split of 0.1 can be applied, where 10% of the data is reserved for validation purposes, aiding in the assessment of model performance on unseen data during training.
(a) (b)
(c)
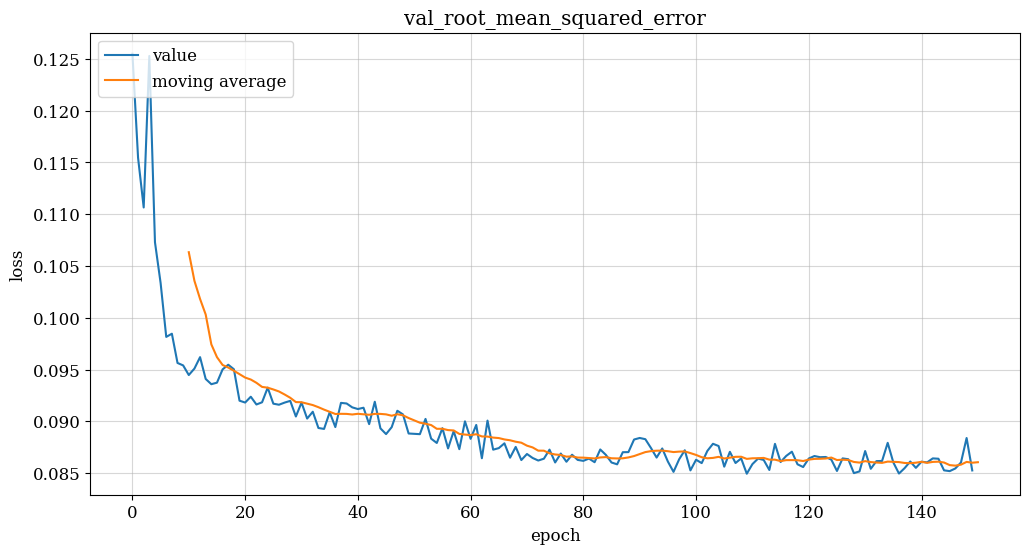
Figure 3. Model training results (flow, speed, occupancy model)
Based on the provided passage and the results from the three training models depicted in Figure 3, several conclusions can be drawn:
(1) Training Progress: The verified loss value begins to level off after approximately 120 epochs of training, while the training loss continues to decrease. This indicates that the model is improving progressively on the training set. However, the performance on the validation set does not show significant improvement. (2) Potential Overfitting: Continuing training beyond this point may lead to overfitting, where the model becomes too specialized to the training data. [9-10] This phenomenon is suggested by the possibility that while training losses continue to decrease, validation losses start to rise, indicating that the model is not generalizing well to unseen data. (3) Preventing Overfitting: To mitigate the risk of overfitting, it is advisable to limit the number of epochs trained to around 150 epochs. This approach aims to strike a balance between achieving sufficient fit on the training set and avoiding signs of overfitting on the validation set. By doing so, the model can potentially generalize better to unseen data and maintain its predictive performance. In summary, monitoring the convergence of loss values on both training and validation sets is crucial during model training. Limiting the number of epochs to an appropriate value, such as around 150 epochs in this case, can help prevent overfitting and ensure the model's effectiveness in predicting traffic flow, speed, and occupancy.
3.5. Experimental result
In evaluating the forecast results, a moving average was added as a baseline. The reason we need a baseline is to see if our RMSE and Spearman scores are really good, not just because of random guesses. And define a function 'predict_and_calc_score(X, Y)' to predict and calculate the score. The function first uses the model to make predictions about Y and then calculates the moving average of Y. Next, the predicted and moving average values are scaled back to the original scale, and the baseline RMSE and model RMSE are calculated.
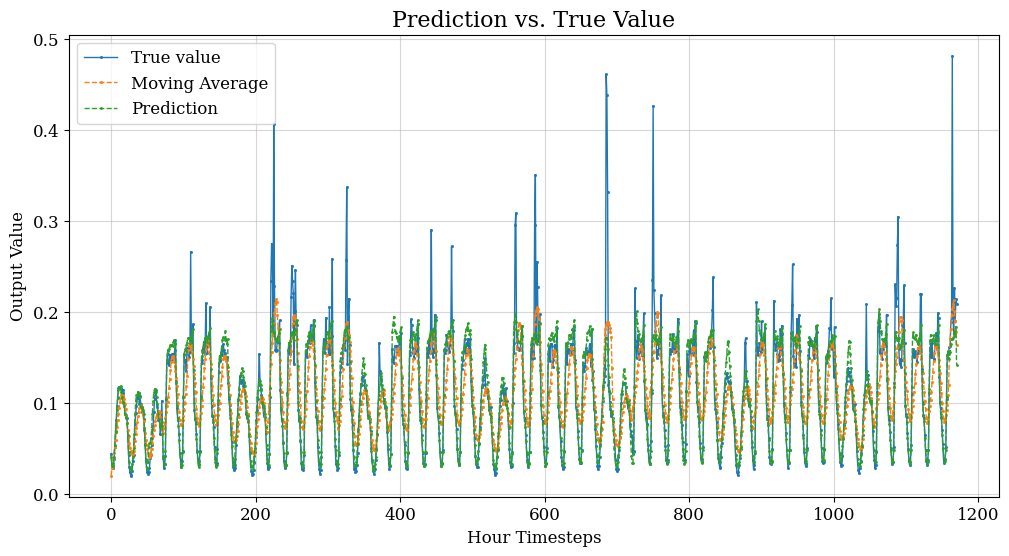
Figure 4. Schematic diagram of traffic flow prediction results
Based on the information provided, Figure 4 depicts a schematic diagram of the traffic flow prediction results. The experiment defines a function called 'plot prediction (actual, prediction, moving average)' to visualize the predicted values, true values, and moving average on an hourly time step.
Following the visualization, the functions are called to output the moving average] RMSE (Root Mean Square Error), predicted RMSE, moving average Spearman correlation, and predicted Spearman correlation on the training set. Additionally, a specific location is selected for the graphical display of the forecast results. Based on the results and conclusions drawn from the experiment, a prediction model utilizing LSTM neural network architecture is constructed. The model incorporates hour and lag features and carefully manages data scaling and splitting. The results indicate that the model outperforms the baseline, which is the moving average of previous values, on both the training set and the test set. This suggests that the model neither overfits nor generalizes poorly to new data.
4. Conclusion
Based on the abstract and content provided, the study on traffic flow prediction using LSTM neural networks and multi-modal data processing on a cloud computing platform has yielded promising results. By integrating data from multiple dimensions such as traffic flow, occupancy, and speed, the constructed LSTM model demonstrates superior performance compared to traditional forecasting models and a baseline moving average. By leveraging the capabilities of LSTM neural networks and cloud computing platforms, the developed prediction model provides reliable tools for traffic management departments to monitor, analyze, and predict traffic flow in real time, thus contributing to the development of intelligent traffic systems and sustainable urban transportation management.
In conclusion, the research presents a comprehensive framework for traffic flow prediction that harnesses the power of LSTM neural networks, multi-modal data processing, and cloud computing technology. The successful implementation of this approach underscores its potential to address complex traffic management challenges and improve decision-making processes. Moving forward, further optimization and refinement of the prediction model could enhance its applicability in real-world scenarios, offering valuable insights and support for traffic management authorities and contributing to the development of smarter, more efficient urban transportation systems.
References
[1]. Kashyap, Anirudh Ameya, et al. "Traffic flow prediction models–A review of deep learning techniques." Cogent Engineering 9.1 (2022): 2010510.
[2]. YinX. et al.Multi-stage attention spatial-temporal graph networks for traffic prediction,Neurocomputing,(2021)
[3]. Treiber, Martin, and Arne Kesting. "Traffic flow dynamics." Traffic Flow Dynamics: Data, Models and Simulation, Springer-Verlag Berlin Heidelberg (2013): 983-1000.
[4]. Varga, Norbert, et al. "An architecture proposal for V2X communication-centric traffic light controller systems." 2017 15th International Conference on ITS Telecommunications (ITST). IEEE, 2017Razali, Noor Afiza Mat, et al. "Gap, techniques and evaluation: traffic flow prediction using machine learning and deep learning." Journal of Big Data 8.1 (2021): 1-25.
[5]. Navarro-Espinoza, A., López-Bonilla, O. R., García-Guerrero, E. E., Tlelo-Cuautle, E., López-Mancilla, D., Hernández-Mejía, C., & Inzunza-González, E. (2022).
[6]. Zheng, Jiajian, et al. "The Random Forest Model for Analyzing and Forecasting the US Stock Market in the Context of Smart Finance." arXiv preprint arXiv:2402.17194 (2024).
[7]. Yang, Le, et al. "AI-Driven Anonymization: Protecting Personal Data Privacy While Leveraging Machine Learning." arXiv preprint arXiv:2402.17191 (2024).
[8]. Cheng, Qishuo, et al. "Optimizing Portfolio Management and Risk Assessment in Digital Assets Using Deep Learning for Predictive Analysis." arXiv preprint arXiv:2402.15994 (2024).
[9]. Zhu, Mengran, et al. "Utilizing GANs for Fraud Detection: Model Training with Synthetic Transaction Data." arXiv preprint arXiv:2402.09830 (2024).
[10]. K. Xu, X. Wang, Z. Hu and Z. Zhang, "3D Face Recognition Based on Twin Neural Network Combining Deep Map and Texture," 2019 IEEE 19th International Conference on Communication Technology (ICCT), Xi'an, China, 2019, pp. 1665-1668, doi: 10.1109/ICCT46805.2019.8947113.
Cite this article
Ding,W.;Tan,H.;Zhou,H.;Li,Z.;Fan,C. (2024). Immediate traffic flow monitoring and management based on multimodal data in cloud computing. Applied and Computational Engineering,67,267-272.
Data availability
The datasets used and/or analyzed during the current study will be available from the authors upon reasonable request.
Disclaimer/Publisher's Note
The statements, opinions and data contained in all publications are solely those of the individual author(s) and contributor(s) and not of EWA Publishing and/or the editor(s). EWA Publishing and/or the editor(s) disclaim responsibility for any injury to people or property resulting from any ideas, methods, instructions or products referred to in the content.
About volume
Volume title: Proceedings of the 2nd International Conference on Software Engineering and Machine Learning
© 2024 by the author(s). Licensee EWA Publishing, Oxford, UK. This article is an open access article distributed under the terms and
conditions of the Creative Commons Attribution (CC BY) license. Authors who
publish this series agree to the following terms:
1. Authors retain copyright and grant the series right of first publication with the work simultaneously licensed under a Creative Commons
Attribution License that allows others to share the work with an acknowledgment of the work's authorship and initial publication in this
series.
2. Authors are able to enter into separate, additional contractual arrangements for the non-exclusive distribution of the series's published
version of the work (e.g., post it to an institutional repository or publish it in a book), with an acknowledgment of its initial
publication in this series.
3. Authors are permitted and encouraged to post their work online (e.g., in institutional repositories or on their website) prior to and
during the submission process, as it can lead to productive exchanges, as well as earlier and greater citation of published work (See
Open access policy for details).
References
[1]. Kashyap, Anirudh Ameya, et al. "Traffic flow prediction models–A review of deep learning techniques." Cogent Engineering 9.1 (2022): 2010510.
[2]. YinX. et al.Multi-stage attention spatial-temporal graph networks for traffic prediction,Neurocomputing,(2021)
[3]. Treiber, Martin, and Arne Kesting. "Traffic flow dynamics." Traffic Flow Dynamics: Data, Models and Simulation, Springer-Verlag Berlin Heidelberg (2013): 983-1000.
[4]. Varga, Norbert, et al. "An architecture proposal for V2X communication-centric traffic light controller systems." 2017 15th International Conference on ITS Telecommunications (ITST). IEEE, 2017Razali, Noor Afiza Mat, et al. "Gap, techniques and evaluation: traffic flow prediction using machine learning and deep learning." Journal of Big Data 8.1 (2021): 1-25.
[5]. Navarro-Espinoza, A., López-Bonilla, O. R., García-Guerrero, E. E., Tlelo-Cuautle, E., López-Mancilla, D., Hernández-Mejía, C., & Inzunza-González, E. (2022).
[6]. Zheng, Jiajian, et al. "The Random Forest Model for Analyzing and Forecasting the US Stock Market in the Context of Smart Finance." arXiv preprint arXiv:2402.17194 (2024).
[7]. Yang, Le, et al. "AI-Driven Anonymization: Protecting Personal Data Privacy While Leveraging Machine Learning." arXiv preprint arXiv:2402.17191 (2024).
[8]. Cheng, Qishuo, et al. "Optimizing Portfolio Management and Risk Assessment in Digital Assets Using Deep Learning for Predictive Analysis." arXiv preprint arXiv:2402.15994 (2024).
[9]. Zhu, Mengran, et al. "Utilizing GANs for Fraud Detection: Model Training with Synthetic Transaction Data." arXiv preprint arXiv:2402.09830 (2024).
[10]. K. Xu, X. Wang, Z. Hu and Z. Zhang, "3D Face Recognition Based on Twin Neural Network Combining Deep Map and Texture," 2019 IEEE 19th International Conference on Communication Technology (ICCT), Xi'an, China, 2019, pp. 1665-1668, doi: 10.1109/ICCT46805.2019.8947113.