


1. Introduction
Product recommendations in online shopping constitute a key application domain for recommendation systems. Conventional product recommendation primarily focuses on newly introduced items, often overlooking suggestions for products within the second-hand market. Considering the distinctive attributes of products, those within the second-hand market differ significantly from new items in aspects such as product descriptions, usage, brand, user sentiment, reviews, price, and ratings. Assessments of second-hand products tend to prioritize attributes like pricing and utility. Moreover, due to the comprehensive evaluation by potential buyers, second-hand products necessitate a heightened awareness of implicit features embedded in their characteristics.
With the rise of information-driven e-commerce, preemptive evaluation and prediction of second-hand products hold greater significance in influencing user decisions. On one hand, from the seller's perspective, for items listed for sale, sellers aspire to predict their products' evaluations by considering reviews, descriptions, categories, and prices. This estimation aids in accruing business reputation by enabling adjustments like price reductions or more detailed descriptions. On the other hand, buyers also prefer purchasing from sellers with higher ratings when selecting second-hand products. However, practical second-hand platforms only feature a limited number of rated sellers, as seen in platforms like Taobao, where the rating ratio is around 35%.
Existing methods for assessing second-hand sellers largely rely on collaborative filtering or neural network models. These approaches struggle to fully capture the implicit relationships within seller characteristics, leading to information loss and an inability to exploit higher-order features in business data, consequently yielding inaccurate evaluation outcomes.
To address these issues, this paper combines the advantageous feature extraction capabilities of both Factorization Machines (FM) and Deep Neural Networks (DNN). A second-hand seller evaluation model based on the DeepFM architecture "DeepSec" is proposed.
DeepSec comprehensively extracts implicit relationships and high-order features from second-hand data. To assess the effectiveness of DeepSec, we conduct comparative experiments on a substantial dataset collected from real platforms. The results demonstrate DeepSec's favorable performance across various metrics and its consistent performance compared to traditional FM and DNN prediction methods.
In summary, the contributions of this paper can be outlined as follows:
1) We venture into the realm of seller ratings within the second-hand commodity market, shedding light on the positive influence of second-hand seller ratings.
2) We advocate the application of the DeepFM model to extract high-order features and implicit relationships between attributes, thereby enhancing the accuracy of rating predictions.
3) Through a comprehensive analysis of comparative results on a large-scale dataset, we substantiate the effectiveness of the proposed model, offering insights into the comparison outcomes.
2. DeepFM-Based Approach
This section provides an overview of the foundational techniques underlying the DeepFM methodology. These encompass word embedding, factorization machines, deep neural networks, among others. Subsequently, we delve into an in-depth exposition of the DeepFM concept.
2.1. Word Embedding
Word embedding serves the purpose of establishing a mapping relationship between words within natural language and numerical values within a computational context. The Skip-Gram model [1] represents one approach for achieving word embedding, wherein it forecasts words in the vicinity of a central word. Precisely, the model's input comprises a One-Hot encoded central word, subsequently multiplied by a weight matrix W to derive the word vector associated with the word. The matrix W, in this context, functions as the essential Word embedding matrix. This resultant word vector is further subject to multiplication by an additional weight matrix M, followed by utilization of the Softmax function to derive a probability distribution concerning its contextual words. Consequently, optimization revolves around employing the maximal logarithmic likelihood function as the optimization objective. A visual representation of the model is depicted in Figure 1[1].
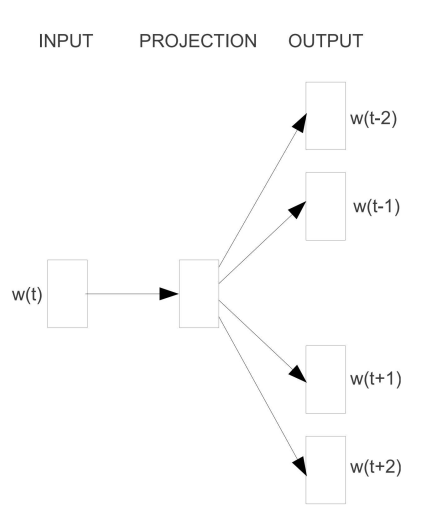
Figure 1. Skip-Gram [1].
We leverage the Skip-Gram technique to embed product descriptions and user comments sourced from trading platform data. This transformation yields continuous vectors capable of serving as input for the model.
2.2. Factorization Machine
The conventional Logistic regression can be represented by equation (1), which addresses straightforward classification and prediction tasks by linearly weighing all features. However, a drawback of this approach lies in its failure to account for interactions between features.
\( \hat{y}={w_{0}}+\sum _{i=1}^{n}{w_{i}}{x_{i}} \) (1)
Hence, in the context of Factorization Machines [2], a second-order cross feature is introduced by incorporating the inner product between two features, followed by a weighted summation. Yet, when dealing with sparse samples, optimizing the weight \( {w_{i,j}} \) becomes challenging due to the abundance of zeros in the feature \( {x_{i}} \) . To mitigate this issue, Factorization Machines allocate a low-dimensional latent vector \( {v_{i}} \) to each feature component \( {x_{i}} \) , characterizing the weight \( {w_{i,j}} \) between \( {x_{i}} \) and \( {x_{j}} \) as the inner product of \( {v_{i}} \) and \( {v_{j}} \) . This strategy not only diminishes the model's parameter count but also circumvents the impact of sparse data. Consequently, the output of the factorizer is expressed as equation (2).
\( \hat{y}={w_{0}}+\sum _{i=1}^{n}{w_{i}}{x_{i}}+\sum _{i=1}^{n}\sum _{j=i+1}^{n} \lt {v_{i}},{v_{j}} \gt {x_{i}}\cdot {x_{j}} \) (2)
2.3. Deep Neural Network
A deep neural network constitutes a multi-layered arrangement of neurons, each layer within the network comprising numerous neurons. The interconnection structure between these layers employs full connections, encompassing a linear relationship combined with an activation function, as illustrated in equation (3) In this formula, \( {a^{(l)}} \) signifies the output of the network's initial layer, \( {W^{(l)}} \) and \( {b^{(l)}} \) represent the weight and bias parameters of the current layer's model, while \( σ \) denotes the activation function. Commonly used activation functions include Sigmoid, Tanh, ReLU, and others.
\( {a^{(l+1)}}=σ({W^{(l)}}{a^{(l)}}+{b^{(l)}}) \) (3)
2.4. DeepFM
The DeepFM model [3] is comprised of two primary components: the FM module and the DNN module, designed for the extraction of low-order and high-order feature interactions, respectively. These two modules operate in parallel, sharing a common input, and undergo joint training. A visual representation of the model structure can be observed in Figure 2 [3].
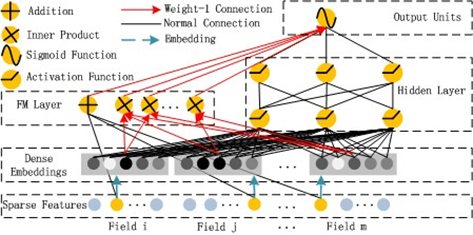
Figure 2. DeepFM [3].
Initially, sparse input features are subjected to dimensionality reduction through an embedding layer, wherein the weights of this layer mirror the hidden vector \( {v_{i}} \) of the FM module. This approach affords the advantage of simultaneous learning of relationships between low and high-dimensional features stemming from the initial input, effectively obviating the necessity for supplementary feature engineering. The outcome of the embedding layer serves as the input for the DNN module. Ultimately, as depicted in equation (4), the output of the DNN module is concatenated with that of the FM module, culminating in the model's final output achieved via the sigmoid function.
\( \hat{y}=sigmod({y_{FM}}+{y_{DNN}}) \) (4)
In our context of predicting ratings for second-hand commodity transactions, input features such as product quantity, duration, and user reviews are harnessed within the DeepFM model. This predictive task is framed as a binary classification problem, yielding a prediction in the form of a score ranging from 0 to 1.
3. Evaluation
3.1. Dataset
We gathered data from 6,588 second-hand sellers with associated user ratings on the Taobao platform through the utilization of web crawler scripts. Within this dataset, sellers boasting fewer than 10 reviews and fewer than 5 products were excluded, ultimately yielding a final dataset comprising 3,837 seller records. The dataset encompasses various characteristics, including the quantity of products, duration, and user reviews, as outlined in Table 1.
Table 1. Dataset Description.
Features | Data Types |
AP (Average Price) | Continuous Value |
Review | Textual Data (8-dimensional vector after embedding) |
Cat. (Category) | Discrete Value |
Dur. (Duration) | Continuous Value (Normalized to [0-1]) |
PD (Product Description) | Textual Data (8-dimensional vector after embedding) |
NP (Number of Products) | Discrete Value |
DR (Depreciation Rate) | Continuous Value (Normalized to [0-1]) |
For seller ratings, we underwent a simulation process to convert regression predictions into a classification task. Ratings within the range of [4.6-5] were designated as 1, while ratings below 4.5 were assigned a value of 0. The training and test sets were split in a ratio of 8:2.
3.2. Experimental Settings
To assess the performance of the DeepFM model, we employed the TensorFlow framework, leveraging the Python programming language for its implementation. In our experimental setup, the dimension of the latent vector \( {v_{i}} \) within the model was set at 8. For the DNN component, a fully connected network with two hidden layers was utilized. Each layer comprised 128 neurons, employing the Rectified Linear Unit (ReLU) function as the activation function.
Additionally, we employed the Adam optimizer with a learning rate of 0.0002, accompanied by L2 regularization using a regularization coefficient of 0.01. The chosen loss function for the model was Log Loss. Furthermore, we incorporated the Dropout technique with a dropout rate of 30%.
Within the experimentation, we adopted a 3-fold cross-validation approach. This involved dividing the dataset into three segments, utilizing two segments as the training set while the remaining segment served as the validation set. The training process was repeated three times, and the resultant metrics were averaged to yield the final evaluation for each model.
3.3. Metric
In our experiments, we have opted to utilize the Area Under the Curve (AUC) as the primary metric for assessment. AUC stands as a widely employed evaluation criterion within recommendation systems. It is defined as the area beneath the Receiver Operating Characteristic (ROC) curve. This ROC curve plots True Positive Rate (TPR) along the vertical axis against False Positive Rate (FPR) along the horizontal axis, as depicted in Figure 3. Here, TPR represents the proportion of correctly predicted positive samples, while FPR signifies the proportion of erroneously predicted positive samples.
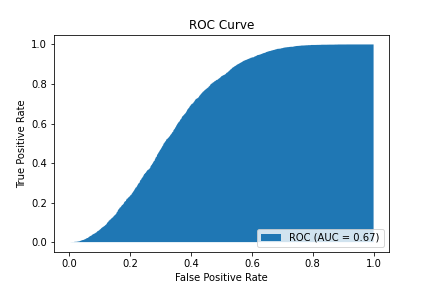
Figure 3. Example of ROC curve.
Within the context of binary classification, the model's output takes the form of probability values. By introducing a threshold, a demarcation is established between positive and negative cases. As the threshold escalates, both TPR and FPR experience an increment. Our aim is to maximize TPR and minimize FPR. Consequently, a model's performance is deemed superior when its AUC value approaches 1, indicating higher discriminatory power.
3.4. Result Analysis
As depicted in Figure 4, the performance of the DeepFM, FM, and DNN models throughout the training process is illustrated. Over the course of 250 epochs, the AUC values of all three models demonstrated relatively stable behavior on the validation set. Notably, beyond approximately 100 epochs, the AUC of the DeepFM consistently outperformed that of both the DNN and FM models.
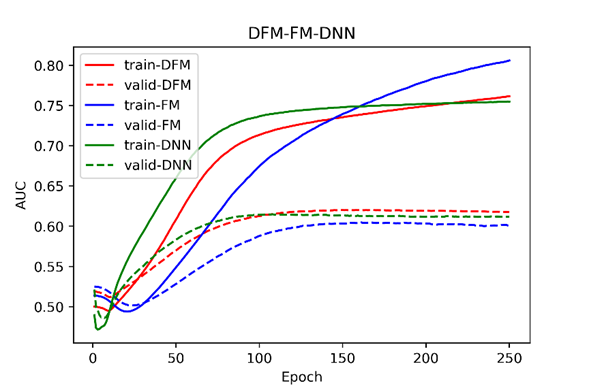
Figure 4. AUC Comparison of DeepFM, FM, and DNN.
Table 2 furnishes the Log Loss and AUC values of the three models on the test set. Notably, the DeepFM model exhibited superior performance in terms of both AUC and Log Loss as opposed to the FM and DNN models. This discrepancy indicates that the incorporation of high-order and low-order feature interactions within the DeepFM model bestows advantages in prediction stability and accuracy. These experimental findings underscore the commendable predictive prowess of the DeepFM model concerning the ratings of second-hand commodity merchants.
Table 2. AUC and Log Loss Comparison in DeepFM, FM, and DNN
DeepFM | FM | DNN | |
Log Loss | 0.1582 | 0.1616 | 0.1585 |
AUC | 0.6176 | 0.6008 | 0.6120 |
4. Related Work
4.1. DeepFM
The DeepFM model has gained substantial traction across various domains in recent times. For instance, Yu et al. applied the DeepFM model to disease prediction [4]. Their experimentation underscored the model's enhanced predictive capability in forecasting hepatitis incidence rates. In a separate context, Chen et al. established a movie recommendation system founded on the DeepFM model [5]. This system demonstrated an improved ability to accurately anticipate user preferences for suggested movies. Furthermore, Wang et al. harnessed the DeepFM model to uncover composite relationships within grid features, furnishing area recommendations for taxi drivers [6]. Xu et al., on the other hand, employed the K-means algorithm to dimensionally reduce data before leveraging DeepFM to glean feature combinations from log data. This approach facilitated the creation of a personalized product recommendation technique [7]. Meanwhile, Li et al. adopted the DeepFM model to forecast Click-Through Rates (CTR) within Taobao advertising data [8]. While their exploration aligns closely with ours, our study distinguishes itself by centering on second-hand transaction data.
4.2. Rating Prediction
Rating prediction, a pivotal task within recommendation systems, has undergone significant advancement over the years. Traditional recommendation systems can be broadly categorized into collaborative filtering, content-based filtering, or hybrid filtering methods [9]. Collaborative filtering seeks out users akin to the current user and utilizes their product evaluations to infer the current user's preferences. Content-based filtering, on the other hand, exploits item and user-related information to align item features with user characteristics. Hybrid filtering methods amalgamate these techniques to circumvent their individual limitations. In the current landscape, driven by the rapid evolution of deep learning, the field of recommendation systems has also witnessed remarkable progress. A notable instance is evident in YouTube's recommendation system [10], which employs two deep networks to conduct initial video screening and sorting. Notably, Google's Wide&Deep model has achieved commendable outcomes on Google Play [11]. This model melds Wide and Deep components—where the Wide component adopts a Logistic Regression (LR) model and the Deep component embraces a Deep Neural Network (DNN). Intriguingly, this configuration shares resemblance with the DeepFM model employed in this article. The divergence lies in DeepFM's utilization of the FM model in lieu of the Wide component, and notably, the FM model and DNN model share a common embedding layer.
5. Conclusion
Secondhand transaction data possesses distinctive characteristics, including intricate relationships between objects and challenging predictability of ratings. In response to these intricacies, this study delved into a second-hand transaction recommendation system grounded in the DeepFM model. We conducted comprehensive experiments utilizing a second-hand trading dataset sourced from Taobao, comparing its efficacy against traditional DNN and FM methods. Our findings underscore the superiority of the DeepFM model, surpassing both DNN and FM methodologies. Remarkably, the DeepFM model exhibited a noteworthy enhancement in AUC by 1% - 3%, spotlighting the algorithm's prowess in the realm of second-hand transaction data. The outcomes of our experiments affirm the DeepFM model's adeptness in extracting implicit features from product attributes within second-hand transaction data, thereby elevating the precision of rating predictions.
References
[1]. Mikolov T, Chen K, Corrado G, Dean J. 2013. Efficient estimation of word representations in vector space. arXiv preprint arXiv:13013781.
[2]. Rendle S. 2010. Factorization machines. In: 2010 IEEE International conference on data mining. pp 995–1000.
[3]. Guo H, Tang R, Ye Y, Li Z, He X. 2017. DeepFM: a factorization-machine based neural network for CTR prediction. arXiv preprint arXiv:170304247.
[4]. Yu Z, Amin SU, Alhussein M, Lv Z. 2021. Research on disease prediction based on improved DeepFM and IoMT. IEEE Access; 9: 39043–39054.
[5]. Chen X, Su W. 2022. Movie Recommendation System based on DeepFM. In: CAIBDA 2022; 2nd International Conference on Artificial Intelligence, Big Data and Algorithms. pp 1–6.
[6]. Wang X, Liu Y, Liao Z, Zhao Y. 2021. DeepFM-Based taxi pick-up area recommendation. In: Pattern Recognition. ICPR International Workshops and Challenges: Virtual Event, January 10–15, 2021, Proceedings, Part V. pp 407–421.
[7]. Xu J, Hu Z, Zou J. 2021. Personalized product recommendation method for analyzing user behavior using DeepFM. Journal of Information Processing Systems; 17: 369–384.
[8]. Li L, Hong J, Min S, Xue Y. 2021. A novel CTR prediction model based on DeepFM for taobao data. In: 2021 IEEE International Conference on Artificial Intelligence and Industrial Design (AIID). pp 184–187.
[9]. Isinkaye FO, Folajimi YO, Ojokoh BA. 2015. Recommendation systems: Principles, methods and evaluation. Egyptian informatics journal; 16: 261–273.
[10]. Covington P, Adams J, Sargin E. 2016. Deep neural networks for youtube recommendations. In: Proceedings of the 10th ACM conference on recommender systems. pp 191–198.
[11]. Cheng H-T, Koc L, Harmsen J, Shaked T, Chandra T, Aradhye H et al. 2016. Wide & deep learning for recommender systems. In: Proceedings of the 1st workshop on deep learning for recommender systems. pp 7–10.
Cite this article
Yang,G. (2024). DeepFM-based rating prediction for second-hand product sellers. Applied and Computational Engineering,73,50-56.
Data availability
The datasets used and/or analyzed during the current study will be available from the authors upon reasonable request.
Disclaimer/Publisher's Note
The statements, opinions and data contained in all publications are solely those of the individual author(s) and contributor(s) and not of EWA Publishing and/or the editor(s). EWA Publishing and/or the editor(s) disclaim responsibility for any injury to people or property resulting from any ideas, methods, instructions or products referred to in the content.
About volume
Volume title: Proceedings of the 2nd International Conference on Software Engineering and Machine Learning
© 2024 by the author(s). Licensee EWA Publishing, Oxford, UK. This article is an open access article distributed under the terms and
conditions of the Creative Commons Attribution (CC BY) license. Authors who
publish this series agree to the following terms:
1. Authors retain copyright and grant the series right of first publication with the work simultaneously licensed under a Creative Commons
Attribution License that allows others to share the work with an acknowledgment of the work's authorship and initial publication in this
series.
2. Authors are able to enter into separate, additional contractual arrangements for the non-exclusive distribution of the series's published
version of the work (e.g., post it to an institutional repository or publish it in a book), with an acknowledgment of its initial
publication in this series.
3. Authors are permitted and encouraged to post their work online (e.g., in institutional repositories or on their website) prior to and
during the submission process, as it can lead to productive exchanges, as well as earlier and greater citation of published work (See
Open access policy for details).
References
[1]. Mikolov T, Chen K, Corrado G, Dean J. 2013. Efficient estimation of word representations in vector space. arXiv preprint arXiv:13013781.
[2]. Rendle S. 2010. Factorization machines. In: 2010 IEEE International conference on data mining. pp 995–1000.
[3]. Guo H, Tang R, Ye Y, Li Z, He X. 2017. DeepFM: a factorization-machine based neural network for CTR prediction. arXiv preprint arXiv:170304247.
[4]. Yu Z, Amin SU, Alhussein M, Lv Z. 2021. Research on disease prediction based on improved DeepFM and IoMT. IEEE Access; 9: 39043–39054.
[5]. Chen X, Su W. 2022. Movie Recommendation System based on DeepFM. In: CAIBDA 2022; 2nd International Conference on Artificial Intelligence, Big Data and Algorithms. pp 1–6.
[6]. Wang X, Liu Y, Liao Z, Zhao Y. 2021. DeepFM-Based taxi pick-up area recommendation. In: Pattern Recognition. ICPR International Workshops and Challenges: Virtual Event, January 10–15, 2021, Proceedings, Part V. pp 407–421.
[7]. Xu J, Hu Z, Zou J. 2021. Personalized product recommendation method for analyzing user behavior using DeepFM. Journal of Information Processing Systems; 17: 369–384.
[8]. Li L, Hong J, Min S, Xue Y. 2021. A novel CTR prediction model based on DeepFM for taobao data. In: 2021 IEEE International Conference on Artificial Intelligence and Industrial Design (AIID). pp 184–187.
[9]. Isinkaye FO, Folajimi YO, Ojokoh BA. 2015. Recommendation systems: Principles, methods and evaluation. Egyptian informatics journal; 16: 261–273.
[10]. Covington P, Adams J, Sargin E. 2016. Deep neural networks for youtube recommendations. In: Proceedings of the 10th ACM conference on recommender systems. pp 191–198.
[11]. Cheng H-T, Koc L, Harmsen J, Shaked T, Chandra T, Aradhye H et al. 2016. Wide & deep learning for recommender systems. In: Proceedings of the 1st workshop on deep learning for recommender systems. pp 7–10.