


1. Introduction
Tumors do serious harm to people's health. According to the International Agency for Research (IARC ) data, in 2012, cancer claimed the lives of 8.2 million people, with an estimated 27 million new cancer cases projected by 2030 [1]. Among the various cancer types, breast cancer ranks as one of the most common among women. Data from the World Health Organization (WHO), The report shows that breast cancer is the second leading cause of death among women in 2014, and the incidence of women over the age of 34 is increasing. According to surveys of Chinese women, breast cancer is one of the most prevalent malignant tumors, with its incidence on the rise as well [2].
Furthermore, compared to other cancer types, breast cancer exhibits a notably high mortality rate. Although with the progress of molecular biology technology and the emergence of new molecular markers, human understanding of breast disease has made great progress. Although with the development of emergence of new molecular markers and the molecular biology technology, people's understanding of breast disease has made great progress. [3].
Early diagnosis and treatment are pivotal in reducing breast cancer mortality. Presently, Mammography is the most common method of breast cancer screening. However, because of its large number of samples and fine imaging characteristics, it is facing great challenges in clinical practice. In recent years, due to the progress of imaging analysis and imaging, pathological section image analysis has gradually developed to provide a new method for early diagnosis of breast cancer. One prominent manifestation of breast cancer is the presence of masses. The fundamental steps of pathological image processing include image preprocessing, which involves eliminating chest muscles, artifacts, background noise, and breast segmentation, as well as image enhancement. Subsequently, essential image processing techniques are employed to identify regions of interest, followed by the extraction of quality-representing features such as texture and morphological characteristics. Eventually, the tissue of the tumor is.On this basis, the feature segmentation is carried out according to the selected image. Another symptom of breast cancer is the high density of breast tissue shown by X-rays. [4].
The acquisition and interpretation of medical images form the foundation of breast cancer diagnosis . The use of image processing method to detect breast cancer cells, and its image processing, location and matching, as well as the feature extraction of the injury. The detection of breast cancer can be achieved through supervised learning or classical image processing techniques to locate candidate lesions. In recent years, there have been significant improvements in image acquisition speed and resolution. However, image diagnosis is subject to subjective factors such as a physician's experience and expertise, with limited replicability and generalization capabilities. In order to reduce the dependence on doctors, the method of image analysis is introduced into medical images. On this basis, In this paper, wavelet analysis is used to analyze and process the image. Medical image analysis plays an irreplaceable role in medical teaching, surgical planning, surgical simulation and so on. [5].
Due to the progress of deep learning technologies in last several years, deep learning has found widespread application in machine learning problems and computer vision [6]. Clinically, compared to X-rays, mammography, In MRI and other imaging examinations, pathological imaging is an important basis for clinical diagnosis of breast cancer. Accurate classification of Pathological histological examination is an important basis for clinical diagnosis of breast cancer. Accurate classification of lesion images is very important for doctors to choose appropriate diagnosis and treatment methods. Currently, manual pathological image classification is not only time-consuming but also susceptible to various subjective factors. Using CAD technology to classify the images of benign and malignant lesions can not only effectively improve the speed of diagnosis, but also provide more objective and accurate diagnosis results. As a result, it has great practical value in clinic.
Automatic recognition of breast cancer lesions is a challenging task. First of all, due to the slight differences between lesion images, cell overlap, uneven color distribution and other characteristics, image recognition has become a very challenging topic. Secondly, the lack of large, open, labeled datasets presents challenges for algorithmic research [7].
The fusion of image processing and Convolutional Neural Networks (CNN) is one of the success stories of deep learning in last several years. Applying convolutional neural networks to breast cancer image analysis involves mapping input layers, pooling layers, rectified linear units, all-chain layers, and output layers, Predict the information shown in medical images. Such as Setio et al. proposed to detect nodules in 3D thoracic CT images from 9 different angles, then select appropriate candidate regions, and then use CNN to classify candidate regions. Ross et al., decomposed three-dimensional images into two-dimensional patches and randomly rotated the two-dimensional patches to obtain "2.5D" views. CNNs were used to detect early cancer features from 2.5D views. The combination of image processing and deep learning significantly improved lesion detection accuracy [8], whereas achieving high accuracy with non-deep learning classifiers (such as support vector machines) is challenging. The accuracy of CNN algorithms depends on expert training for initial labeling, necessitating broad case coverage. Therefore, the widespread adoption of CNNs in medical image processing is constrained by the limitations of resource "transfer learning," which can reduce CNN's reliance on initial label training to some extent [9]. However, due to its own limitations, how to apply it to the transfer learning between medical organ images has become a difficult problem.
To address the aforementioned challenges in automatically classifying breast cancer pathology images, this paper presents an approach based on Convolutional Neural Networks (CNNs) and image processing, constructing a ResNet (Residual Network) model. The breast tissue pathology image dataset used in this model is sourced from Kaggle. Various techniques, including max-pooling, dropout, fully connected layers, and binary cross-entropy loss functions, are used to better shape the feature extraction process, enabling the recognition and classification of positive and negative breast ductal carcinoma in situ (DCIS) with significantly higher accuracy compared to previous algorithmic models. This model holds potential assistance in the early diagnosis and treatment of breast cancer.
2. Previous Works
The detection of tumor markers is an important means of early detection of breast cancer. Like protein, or genetic variation. Tumor marker is an active component synthesized and secreted by cancer cells at the stage of growth and proliferation. Once this material accumulates to a certain extent, it will change.Extracted from the breast image. Methods like Scale-Invariant Feature Transform (SIFT) or Histogram of Oriented Gradients (HOG) can identify early features of breast cancer, providing support for early diagnosis. However, this approach has some notable limitations. Firstly, it exhibits limited universality; for instance, common tumor markers like AFP lack specificity, making it difficult to accurately locate the affected area. Secondly, it demands substantial time and resource costs, especially in the case of gene mutation testing, which involves intricate steps and significant expenses. In contrast, image processing techniques, by recognizing and classifying pathological images, can accurately pinpoint affected areas. Moreover, these techniques are characterized by speed and high applicability, making them well-suited for early breast cancer diagnosis needs.
The combination of enhanced learning and image analysis technology can effectively reduce the over-reliance on human medical practice.The image processing technology is used to analyze the data of the 2D layer, and the reinforcement learning technology is used to enhance the data. Through the evaluation of each separate 2D slice, the best decision-making strategy can be determined.The diagnostic value of complete cross-section of 2D lesions. Through the analysis and processing of 2D cross-sectional images, the segmentation and extraction of breast tissue, surrounding soft tissue and lesions, as well as 3D reconstruction and 3D display were realized. On this basis, the reinforcement learning method was used to quantitatively analyze the focus and peripheral breast, and the repeated learning method was used to complete it. [10]. Historically, At present, the research on digital lesion image processing mostly focuses on color standardization, kernel segmentation and feature extraction of the underlying image. Then, traditional learning methods, such as regression, support vector machine(SVM) and so on, were employed to build classification models. These algorithms typically require a relatively small set of image features, around 10 in number. Below, we provide an introduction and comparison of some conventional models and elaborate on the rationale for choosing the CNN model [11].
2.1. Linear Regression Model
Regression analysis is an important traditional method for studying relationships between variables, especially before the rise of deep learning and machine learning. Regression analysis has been a fundamental approach to exploring the relationships between variables [12]. In practical applications, linear regression analysis, while simple and effective, is prone to misuse due to a lack of full awareness of its limitations and considerations, leading to inaccurate or even contradictory conclusions. Not all phenomena can be accurately described by linear relationships.
2.2. SVM Model
SVM models can be applied to common classification and regression problems, with low generalization error, strong learning capabilities, and good generalization of results. Additionally, SVM models can address machine learning problems in small sample cases, perform well in high-dimensional scenarios, and avoid the issues of neural network structure selection and local minimums. SVM stands as one of the best ready-made classifiers, meaning it can be directly used without modification. It can also provide low error rates for classifying data points outside the training set. However, if the number of features is larger than the sample size, the performance of SVM will become very bad, and the algorithm can not directly give a costly interactive confirmation algorithm. [13].
2.3. Random Forest Model
A random forest is a collection of several trees, and its result is determined according to most classes in each tree. The random forest model has many advantages, such as strong performance on datasets, resistance to overfitting due to the introduction of two sources of randomness, and adaptability to high-dimensional data without the need for feature selection. It can handle both discrete and continuous data, does not require data normalization, and offers good noise resistance among many other benefits [14]. However, it also has some disadvantages. For instance, in datasets with significant noise, the random forest model can be prone to overfitting. Features with a large number of value divisions can have a greater impact on RF decision making, affecting model fitting effectiveness [15].
2.4. Naive Bayes Algorithm
One of the advantages of the Naive Bayes algorithm is its efficiency and simplicity. Relatively to other complex classification algorithms, the Naive Bayes algorithm has lower computational complexity and can rapidly perform training and classification on large-scale datasets. Furthermore, it is easy to implement, as it is based on straightforward probability theory, making its principles intuitive. Additionally, the Naive Bayes algorithm offers strong interpretability, as its classification results can be explained through probability values [16].
However, the Naive Bayes algorithm also has its drawbacks. Firstly, it assumes that all features are independent, which is not always the case in practical scenarios [16]. Secondly, it makes strong assumptions about the distribution of input data, which may not hold true in real-world applications, leading to a decrease in classification performance. Moreover, the Naive Bayes algorithm is not flexible in handling missing data and continuous data. For continuous data, the Naive Bayes algorithm typically assumes a specific distribution, which may not align with real-world data [17].
In summary, the Naive Bayes algorithm has the advantages of simplicity, efficiency, ease of implementation, and strong interpretability. However, it has limitations related to feature correlations, assumptions about data distribution, and the handling of missing and continuous data [17].
2.5. Deep Learning Models
Since 2012, the large-scale machine vision competition represented by deep learning has achieved good results. In last several years, pathological diagnosis techniques rely on deep learning have also shown good potential for development. Compared with some previous machine learning techniques for digital pathology, deep learning technology has unique advantages in target detection, target segmentation and feature extraction. In contrast, deep learning only takes a picture or a picture (such as 1 or 0) as the data source, and learns instructive annotations through high-dimensional and complex model parameters [18].
The characteristic of this project is to construct a breast cancer diagnosis model rely on deep neural network, and the effect is similar to that of normal people in the experimental samples. It is worth noting that the mistakes in our deep neural network are not caused by the mistakes of human pathologists. Therefore, although the existing pathological diagnosis results are much better than the traditional deep neural network, the error of disease diagnosis can be effectively reduced through the fusion of deep neural network and pathological experts. The research results will provide new ideas for clinicopathological diagnosis and disease diagnosis.
3. Dataset and Preprocessing
The breast tissue pathology image dataset used in this study was obtained from Kaggle (https://www.kaggle.com/datasets/paultimothymooney/breast-histopathology-images) and contains two image categories: Invasive Ductal Carcinoma negative (IDC(-))and Invasive Ductal Carcinoma positive (IDC(+)). The filenames of each image contain information about their category. In terms of dataset size, there are 78,786 images for normal breast tissue and 78,786 images for IDC(+) breast tissue. The image resolutions were adjusted to 50x50 pixels during preprocessing to ensure consistency with the model input. In data preprocessing, images were loaded from the file system using the glob module, and image labels of IDC(-) or IDC(+) were identified based on the filenames. Subsequently, all images were resized to 50x50 pixels to match the model's input. Although image normalization is not explicitly shown in the code, it is a common and recommended step, typically involving dividing image data by 255 to normalize it to the 0-1 range. Finally, the dataset was split into a testing set (30%) and a training set (70%). This breast tissue pathology image dataset is crucial for training and evaluating the ResNet model as it enables us to train the model to recognize and classify positive and negative Invasive Ductal Carcinoma, which is vital for the early diagnosis and treatment of breast cancer.
4. Model
Regarding the model architecture, this experiment employed the ResNet (Residual Network) architecture, which has the following key features: Firstly, it starts with initial convolution layers comprising 32 filters of size 3x3 and ReLU activation functions. Next, On this basis, a function learning algorithm rely on neural network is proposed. In addition, this pattern contains the maximum point, Dropout, and three complete link layers to better describe the element extraction process.
In terms of training, the ADAM optimizer uses the binary cross-entropy loss function and sets the learning rate to 0.0001. Thirty-five samples were selected, the length of each batch of samples was 40, and the training time was 40. The dataset was divided into a 30% training set and a 70% testing set. In order to prevent overfitting, early stopping was also implemented. To further enhance model performance, data augmentation and transfer learning strategies could be considered.
Table 1. Explanation of the network structure of the ResNet model [19]
layer name | output size | 18-layer | 34-layer | 50-layer | 101-layer | 152-layer | |
Conv l | 112x112 | 7x7,64,stride 2 | |||||
conv2.x | 56x56 | 3x3 max pool,stride 2 | |||||
\( [\begin{matrix}3x3, & 64 \\ 3x3, & 64 \\ \end{matrix}]×2 \) | \( [\begin{matrix}3x3, & 64 \\ 3x3, & 64 \\ \end{matrix}]×3 \) | \( [\begin{matrix}1x1 & 64 \\ 3x3 & 64 \\ 1x1 & 256 \\ \end{matrix}]×3 \) | \( [\begin{matrix}1x1 & 64 \\ 3x3 & 64 \\ 1x1 & 256 \\ \end{matrix}]×3 \) | \( [\begin{matrix}1x1 & 64 \\ 3x3 & 64 \\ 1x1 & 256 \\ \end{matrix}]×3 \) | |||
conv3.x | 28x28 | \( [\begin{matrix}3x3, & 64 \\ 3x3, & 64 \\ \end{matrix}]×2 \) | \( [\begin{matrix}3x3, & 64 \\ 3x3, & 64 \\ \end{matrix}]×4 \) | \( [\begin{matrix}1x1 & 128 \\ 3x3 & 128 \\ 1x1 & 512 \\ \end{matrix}]×4 \) | \( [\begin{matrix}1x1 & 128 \\ 3x3 & 128 \\ 1x1 & 512 \\ \end{matrix}]×4 \) | \( [\begin{matrix}1x1 & 128 \\ 3x3 & 128 \\ 1x1 & 512 \\ \end{matrix}]×8 \) | |
conv4.x | 14x14 | \( [\begin{matrix}3x3, & 256 \\ 3x3, & 256 \\ \end{matrix}]×2 \) | \( [\begin{matrix}3x3, & 256 \\ 3x3, & 256 \\ \end{matrix}]×6 \) | \( [\begin{matrix}1x1 & 256 \\ 3x3 & 256 \\ 1x1 & 1024 \\ \end{matrix}]×6 \) | \( [\begin{matrix}1x1 & 256 \\ 3x3 & 256 \\ 1x1 & 1024 \\ \end{matrix}]×23 \) | \( [\begin{matrix}1x1 & 256 \\ 3x3 & 256 \\ 1x1 & 1024 \\ \end{matrix}]×36 \) | |
conv5.x | 7x7 | \( [\begin{matrix}3x3, & 512 \\ 3x3, & 512 \\ \end{matrix}]×2 \) | \( [\begin{matrix}3x3, & 512 \\ 3x3, & 512 \\ \end{matrix}]×3 \) | \( [\begin{matrix}1x1 & 512 \\ 3x3 & 512 \\ 1x1 & 2048 \\ \end{matrix}]×3 \) | \( [\begin{matrix}1x1 & 512 \\ 3x3 & 512 \\ 1x1 & 2048 \\ \end{matrix}]×3 \) | \( [\begin{matrix}1x1 & 512 \\ 3x3 & 512 \\ 1x1 & 2048 \\ \end{matrix}]×3 \) | |
Table 2. The process of running the ResNet model.
Layer | Type | Output Shape | Param |
nput_1 | InputLayer | (None, 50, 50, 3) | 0 |
conv2d | Conv2D | (None, 50, 50, 32) | 896 |
batch_normalization | BatchNormalization | (None, 50, 50, 32) | 128 |
conv2d_1 | (None, 50, 50, 32) | 0 | |
batch_normalization_1 | BatchNormalization | (None, 50, 50, 32) | 128 |
activation | Activation | (None, 50, 50, 32) | 0 |
conv2d_2 | Conv2D) | (None, 50, 50, 32) | 9248 |
batch_normalization_2 | BatchNomalization | (None, 50, 50, 32) | 128 |
add | Add | (None, 50, 50, 32) | 0 |
activation_1 | Activation | (None, 50, 50, 32) | 0 |
conv2d_3 | Conv2D) | (None, 50, 50, 32) | 9248 |
batch_normalization_3 | batch_normalization | (None, 50, 50, 32) | 128 |
activation_2 | Activation | (None, 50, 50, 32) | 0 |
conv2d_4 | Conv2D) | (None, 50, 50, 32) | 9248 |
batch_normalization_4 | batch_normalization | (None, 50, 50, 32) | 128 |
add_1 | Add | (None, 50, 50, 32) | 0 |
activation_3 | Activation | (None, 50, 50, 32) | 0 |
conv2d_5 | Conv2D) | (None, 50, 50, 32) | 9248 |
batch_normalization_5 | batch_normalization | (None, 50, 50, 32) | 128 |
activation_4 | Activation | (None, 50, 50, 32) | 0 |
conv2d_6 | Conv2D) | (None, 50, 50, 32) | 9248 |
batch_normalization_6 | batch_normalization | (None, 50, 50, 32) | 128 |
add_2 | Add | (None, 50, 50, 32) | 0 |
activation_5 | Activation | (None, 50, 50, 32) | 0 |
conv2d_7 | Conv2D) | (None, 50, 50, 32) | 9248 |
batch_normalization_7 | batch_normalization | (None, 50, 50, 32) | 128 |
activation_6 | Activation | (None, 50, 50, 32) | 0 |
conv2d_8 | Conv2D) | (None, 50, 50, 32) | 9248 |
batch_normalization_8 | batch_normalization | (None, 50, 50, 32) | 128 |
add_3 | Add | (None, 50, 50, 32) | 0 |
activation_7 | Activation | (None, 50, 50, 32) | 0 |
max_pooling2d | MaxPooling2D | (None, 25, 25, 32) | 0 |
dropout | Dropout | (None, 25, 25, 32) | 0 |
flatten | Flatten | (None, 20000) | 0 |
dense | Dense | (None, 128) | 2560128 |
batch_normalization_9 | BatchNomalization | (None, 128) | 512 |
dense_ 1 | Dense | (None, 64) | 8216 |
batch_normalization_10 | BatchNomalization | (None, 64) | 256 |
dense_2 | Dense | (None, 64) | 4160 |
dropout_1 | Dropout | (None, 64) | 0 |
dense_3 | Dense | (None, 2) | 130 |
Trainable params: 2,648,514
Non-trainable params: 960
Total params: 2,649,474
5. Results
As far as something is concerned model performance, an analysis of the model's performance during training and testing over time can be conducted by examining the changes in accuracy and loss. Visualizations of accuracy and loss illustrate the model's performance during the training process (Fig. 1). Additionally, we provide confusion matrices to demonstrate the relationship between actual categories and predicted categories, aiding in a comprehensive understanding of the model's performance across different categories. Furthermore, a percentage-based confusion matrix is presented (Fig. 2) for a more intuitive view of the percentage of classification errors. At the end, we provide the renderings as a reference for what is right and what is wrong(Fig. 3)
|
|
a.Model test set and training set accuracy performance | b.Model test set and training set loss rate performance |
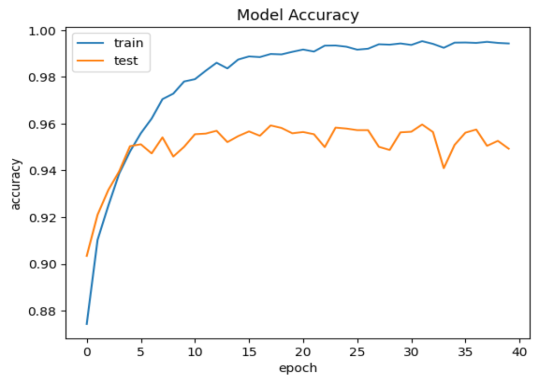
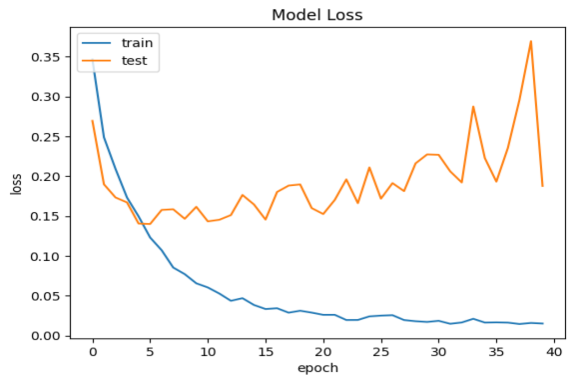
Figure 1. Model test set and training set performance
|
|
a Confusion Matrix Training Results Quantity Classification Performance | b Confusion Matrix Training Results Percentage Classification Performance |
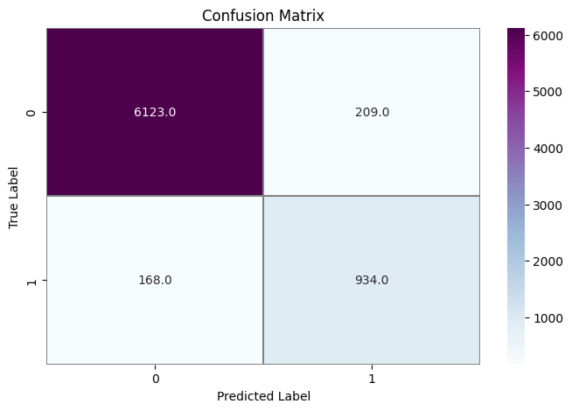
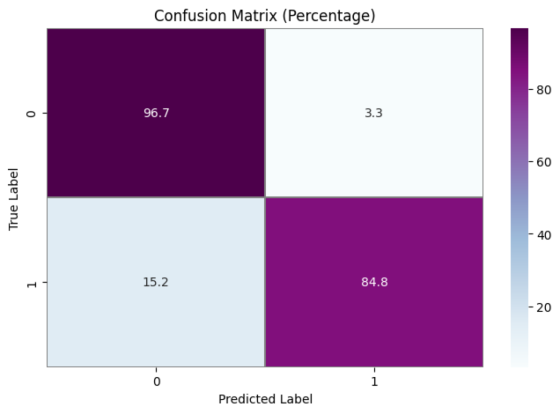
Figure 2. Confusion Matrix Training Results Classification Performance
|
|
a.Correct Prediction | b. Wrong Predictio |
Predicted:0 True:1 | Predicted;0 True:1 |
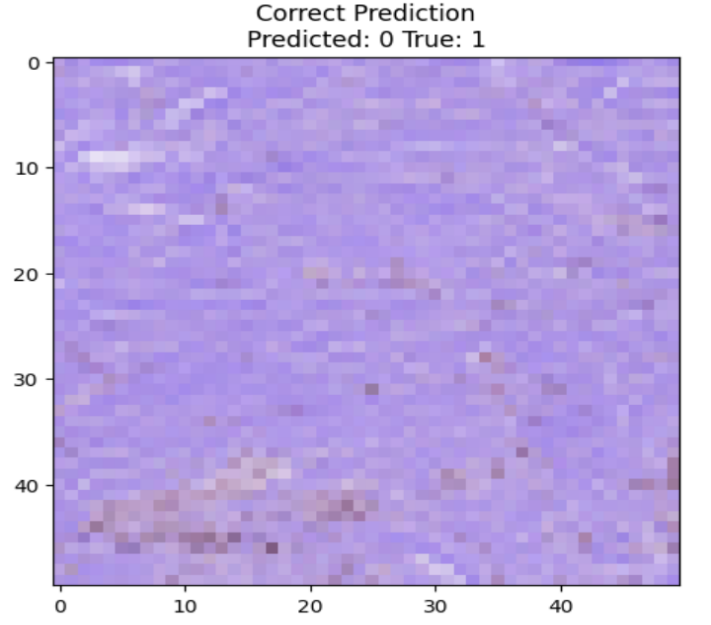
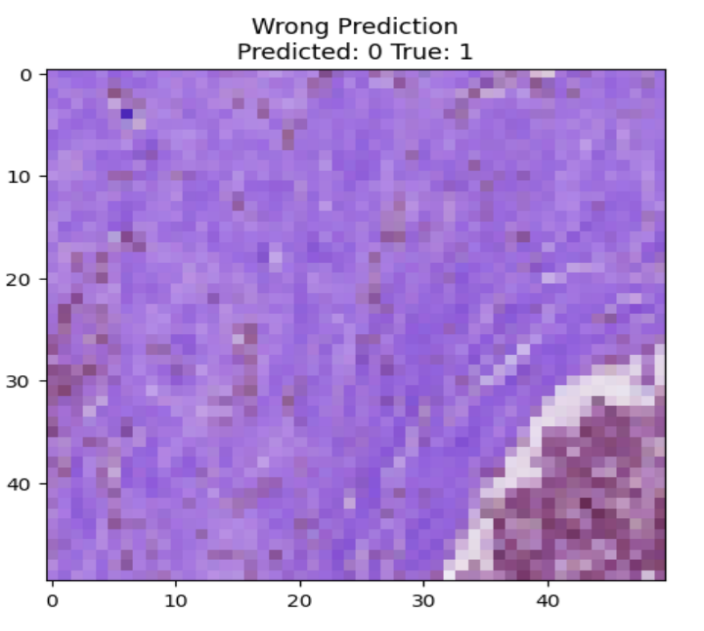
Figure 3. Correct Prediction and Wrong Prediction
Based on the CNN topology structure, the model underwent 40 iterations of training. According to the confusion matrix results, the accuracy achieved was 90.75%. This result is compared with some state-of-the-art multi-classification algorithms. In [20], Chen et al. The support vector machine is used to analyze the benign and malignant types of breast cancer cells. The F value is 0.979 and the amplification factor is 40 ×. In [21], he same is true of Span Hall and his men. On this basis, the pre-trained BVLC CaffeNet is used as the feature extractor, which is used as the input to realize the classification of benign and malignant breast tumors. The results show that the correct rate of this study is 86.7% to 88.8%.In terms of accuracy, our method outperforms the approaches proposed by Bardou et al. [22] and Chan et al. [23].
6. Discussion
Considering the model's results comprehensively, it is evident that the model performs well. However, the results of this method indicate that, Compared with the existing test samples, the algorithm proposed in this project still has room for improvement in recognition effect. The accuracy is still relatively low, and substantial computational resources are required for both training and inference, particularly in the case of deep networks and potential overfitting. Techniques like regularization could be considered to address this issue, suggesting areas for improvement. To enhance the model's robustness and generalization, more complex network structures, hyperparameter tuning, or the introduction of additional data augmentation techniques can be considered.
Deep learning, as a multi-layered neural network approach, has shown remarkable effectiveness in processing images and audio signals but has not yet demonstrated the same level of performance in natural language processing. From a statistical perspective, deep learning aims to predict data distributions by learning models from data and utilizing them for predicting new data. To extract enough datasets from the same dataset. The idea at first was to learn deeply to mimic the workings of the human brain. On this basis, a method based on depth neural network is proposed to solve the difficulties and limitations of manual extraction in traditional methods, so as to achieve the purpose of automatic recognition of breast disease images. On this basis, the improved methods of data enhancement and fine adjustment are adopted to effectively solve the training problem under low training samples based on training, thus effectively solving the problems existing in the training process.
To solve this problem, a new breast cancer image classification algorithm based on CNN is proposed in this paper. The parameter adjustment in the convolution network has a great influence on the effect of the image. The unsupervised learning method has a good application prospect for the image analysis of breast cancer. In transfer learning, using pre-trained CNNs as network initializations followed by supervised training is a viable method. However, labeling breast cancer image datasets remains a challenge. Privacy concerns regarding breast cancer image data have garnered widespread attention. In the process of analyzing breast tumor images, it is necessary to further promote its precision on the premise of ensuring patients' right to privacy and avoid unauthorized access to picture data. Establishing auditable access paths throughout the image access process is crucial to secure image data access [24].
7. Conclusion
In last several years, the method of breast cancer diagnosis rely on deep learning has been well applied in many CAD. In this project, we have made a lot of improvements to the structure of convolution neural network, and integrated it with migration, fusion and other methods to improve the recognition effect. This project intends to use superposition ResNet fusion algorithm to grade the good and bad of the tumor.This ensemble incorporated Dropout, max-pooling , and three connected layers, successfully shaping the feature extraction process and achieving an accuracy of over 90%, surpassing traditional algorithm models. This outcome validates the ability of CNN models to effectively reduce a large volume of images to a smaller dataset while preserving image features, aligning with the principles of image processing and highlighting the potential of CNNs in breast tissue pathology image classification. Understanding the principles and internal workings of CNNs can provide valuable insights into visual and cognitive processes, benefiting the fields of neuroscience and cognitive science.
Furthermore, we can speculate that research into convolutional neural networks can help uncover new application areas and tasks. For instance, applying CNNs to fields like natural language processing, image generation, and reinforcement learning can expand their application scope, generating broader societal and economic value. This implies that CNNs can be applied to solve real-world problems such as autonomous driving, medical diagnosis, drone surveillance, and more. Research in CNNs can enhance performance and reliability in these applications, resulting in greater practical value. Additionally, research on CNNs spans multiple disciplines, including computer science, mathematics, statistics, neuroscience, and others. Investigating CNNs can promote interdisciplinary communication and collaboration, propelling the development of related fields.
In summary, the study of convolutional neural networks holds multifaceted significance. By improving model performance, understanding visual and cognitive processes, enhancing efficiency, expanding application domains, addressing real-world problems, and fostering interdisciplinary research, further research and development of CNN models should be encouraged to enhance the accuracy and efficiency of breast cancer diagnosis.
References
[1]. Elston C. W, Ellis I. O, Pinder S. E 1999 Pathological prognostic factors in breast cancer. Critical Reviews in Oncology/Hematology . 31(3):209–223.
[2]. Udupa J. K, Herman G. T 2002 Medical image reconstruction, processing, visualization, and analysis: the MIPG perspective. IEEE Transactions on Medical Imaging . 21(4):281–295.
[3]. Roth H. R, Lu L, Liu J, et al 2016 Improving computer-aided detection using convolutional neural networks and random view aggregation. IEEE Transactions on Medical Imaging .35(5):1170–1181.
[4]. Cserni G, Amendoeira I, Apostolikas N, et al 2003 Pathological work-up of sentinel lymph nodes in breast cancer. Review of current data to be considered for the formulation of guidelines. European Journal of Cancer .39(12):1654–1667.
[5]. Hou Y 2020 Breast cancer pathological image classification based on deep learning. Journal of X-Ray Science and Technology .28(4):727–738.
[6]. Wu S. G, Wang J, Lei J, et al 2020 Prognostic validation and therapeutic decision-making of the AJCC eighth pathological prognostic staging for T3N0 breast cancer after mastectomy. Clinical and Translational Medicine .10(1):125–136.
[7]. Mcinerney T, Terzopoulos D 1996 Deformable models in medical image analysis: a survey. Medical Image Analysis .1(2):91–108.
[8]. Litjens G., Kooi T, Bejnordi B. E, et al 2017 A survey on deep learning in medical image analysis. Medical Image Analysis .42:60–88.
[9]. (ne Lehmann) T. M. D, Handels H, (ne Fritzsche) K. H. M. H, et al 2013 Viewpoints on medical image processing: from science to application. Current Medical Imaging Reviews .9(2):79–88.
[10]. Setio A, Ciompi F, Litjens G, et al 2016 Pulmonary nodule detection in CT Images: False Positive Reduction using Multi-View convolutional networks. Medical Imaging .35(5):1160–1169.
[11]. Guo Z, Liu H, Ni H, et al 2020 Publisher correction: a fast and refined cancer regions segmentation framework in whole-slide breast pathological images. Scientific Reports .10(1):p. 8591.
[12]. Roth H. R, Lu L, Seff A, et al 2014 A new 2.5D representation for lymph node detection using random sets of deep convolutional neural network observations. pp. 520–527.
[13]. Moeskops P, Viergever M. A, Mendrik A. M, de Vries L. S, Benders M. J. N. L, Isgum I 2016 Automatic segmentation of MR brain images with a convolutional neural network. IEEE Transactions on Medical Imaging .35(5):1252–1261.
[14]. Pham D. L, Xu C, Prince J. L 2000 Current methods in medical image segmentation. Annual Review of Biomedical Engineering .2(1):315–337.
[15]. Lehmann T. M, Gonner C, Spitzer K 1999 Survey: interpolation methods in medical image processing. IEEE Transactions on Medical Imaging .18(11):1049–1075.
[16]. Cootes T. F, Taylor C. J 2001 Statistical models of appearance for medical image analysis and computer vision. Proceedings of SPIE - The International Society for Optical Engineering .4322(1)
[17]. Ghesu F. C, Georgescu B, Mansi T, Neumann D, Hornegger J, Comaniciu D 2016 An artificial agent for anatomical landmark detection in medical images. Vol. 9902. Cham: Springer;.
[18]. Ghesu F. C, Krubasik E, Georgescu B, et al 2016 Marginal space deep learning: efficient architecture for volumetric image parsing. IEEE Transactions on Medical Imaging .35(5):1217–1228.
[19]. He, Kaiming; Zhang, Xiangyu; Ren, Shaoqing; Sun, Jian 2016. IEEE Conference on Computer Vision and Pattern Recognition (CVPR) - Deep Residual Learning for Image Recognition. 770–778.
[20]. Brosch T, Tang L. Y. W, Yoo Y, Li D. K. B, Traboulsee A, Tam R. 2016 Deep 3D convolutional encoder networks with shortcuts for multiscale feature integration applied to multiple sclerosis lesion segmentation. Medical Imaging .35(5):1229–1239.
[21]. Wahab N, Khan A, Lee Y. S 2019 Transfer learning based deep CNN for segmentation and detection of mitoses in breast cancer histopathological images. Microscopy .68(3):216–233.
[22]. Sohail A, Mukhtar M. A, Khan A, Zafar M. M, Zameer A, Khan S. 2020 Deep Object Detection Based Mitosis Analysis in Breast Cancer Histopathological Images. http://arxiv.org/abs/2003.08803.
[23]. Milletari F., Navab N., Ahmadi S. A 2016 V-Net: Fully Convolutional Neural Networks for Volumetric Medical Image Segmentation. 2016 Fourth International Conference on 3D Vision (3DV); Stanford, CA, USA. pp. 565–571.
[24]. Ishihara S, Ishihara K, Nagamachi M, Matsubara Y 1997 An analysis of Kansei structure on shoes using self-organizing neural networks. International Journal of Industrial Ergonomics .19(2):93–104.
Cite this article
Liu,Z. (2024). Improving breast cancer classification using histopathology images through deep learning. Applied and Computational Engineering,73,187-196.
Data availability
The datasets used and/or analyzed during the current study will be available from the authors upon reasonable request.
Disclaimer/Publisher's Note
The statements, opinions and data contained in all publications are solely those of the individual author(s) and contributor(s) and not of EWA Publishing and/or the editor(s). EWA Publishing and/or the editor(s) disclaim responsibility for any injury to people or property resulting from any ideas, methods, instructions or products referred to in the content.
About volume
Volume title: Proceedings of the 2nd International Conference on Software Engineering and Machine Learning
© 2024 by the author(s). Licensee EWA Publishing, Oxford, UK. This article is an open access article distributed under the terms and
conditions of the Creative Commons Attribution (CC BY) license. Authors who
publish this series agree to the following terms:
1. Authors retain copyright and grant the series right of first publication with the work simultaneously licensed under a Creative Commons
Attribution License that allows others to share the work with an acknowledgment of the work's authorship and initial publication in this
series.
2. Authors are able to enter into separate, additional contractual arrangements for the non-exclusive distribution of the series's published
version of the work (e.g., post it to an institutional repository or publish it in a book), with an acknowledgment of its initial
publication in this series.
3. Authors are permitted and encouraged to post their work online (e.g., in institutional repositories or on their website) prior to and
during the submission process, as it can lead to productive exchanges, as well as earlier and greater citation of published work (See
Open access policy for details).
References
[1]. Elston C. W, Ellis I. O, Pinder S. E 1999 Pathological prognostic factors in breast cancer. Critical Reviews in Oncology/Hematology . 31(3):209–223.
[2]. Udupa J. K, Herman G. T 2002 Medical image reconstruction, processing, visualization, and analysis: the MIPG perspective. IEEE Transactions on Medical Imaging . 21(4):281–295.
[3]. Roth H. R, Lu L, Liu J, et al 2016 Improving computer-aided detection using convolutional neural networks and random view aggregation. IEEE Transactions on Medical Imaging .35(5):1170–1181.
[4]. Cserni G, Amendoeira I, Apostolikas N, et al 2003 Pathological work-up of sentinel lymph nodes in breast cancer. Review of current data to be considered for the formulation of guidelines. European Journal of Cancer .39(12):1654–1667.
[5]. Hou Y 2020 Breast cancer pathological image classification based on deep learning. Journal of X-Ray Science and Technology .28(4):727–738.
[6]. Wu S. G, Wang J, Lei J, et al 2020 Prognostic validation and therapeutic decision-making of the AJCC eighth pathological prognostic staging for T3N0 breast cancer after mastectomy. Clinical and Translational Medicine .10(1):125–136.
[7]. Mcinerney T, Terzopoulos D 1996 Deformable models in medical image analysis: a survey. Medical Image Analysis .1(2):91–108.
[8]. Litjens G., Kooi T, Bejnordi B. E, et al 2017 A survey on deep learning in medical image analysis. Medical Image Analysis .42:60–88.
[9]. (ne Lehmann) T. M. D, Handels H, (ne Fritzsche) K. H. M. H, et al 2013 Viewpoints on medical image processing: from science to application. Current Medical Imaging Reviews .9(2):79–88.
[10]. Setio A, Ciompi F, Litjens G, et al 2016 Pulmonary nodule detection in CT Images: False Positive Reduction using Multi-View convolutional networks. Medical Imaging .35(5):1160–1169.
[11]. Guo Z, Liu H, Ni H, et al 2020 Publisher correction: a fast and refined cancer regions segmentation framework in whole-slide breast pathological images. Scientific Reports .10(1):p. 8591.
[12]. Roth H. R, Lu L, Seff A, et al 2014 A new 2.5D representation for lymph node detection using random sets of deep convolutional neural network observations. pp. 520–527.
[13]. Moeskops P, Viergever M. A, Mendrik A. M, de Vries L. S, Benders M. J. N. L, Isgum I 2016 Automatic segmentation of MR brain images with a convolutional neural network. IEEE Transactions on Medical Imaging .35(5):1252–1261.
[14]. Pham D. L, Xu C, Prince J. L 2000 Current methods in medical image segmentation. Annual Review of Biomedical Engineering .2(1):315–337.
[15]. Lehmann T. M, Gonner C, Spitzer K 1999 Survey: interpolation methods in medical image processing. IEEE Transactions on Medical Imaging .18(11):1049–1075.
[16]. Cootes T. F, Taylor C. J 2001 Statistical models of appearance for medical image analysis and computer vision. Proceedings of SPIE - The International Society for Optical Engineering .4322(1)
[17]. Ghesu F. C, Georgescu B, Mansi T, Neumann D, Hornegger J, Comaniciu D 2016 An artificial agent for anatomical landmark detection in medical images. Vol. 9902. Cham: Springer;.
[18]. Ghesu F. C, Krubasik E, Georgescu B, et al 2016 Marginal space deep learning: efficient architecture for volumetric image parsing. IEEE Transactions on Medical Imaging .35(5):1217–1228.
[19]. He, Kaiming; Zhang, Xiangyu; Ren, Shaoqing; Sun, Jian 2016. IEEE Conference on Computer Vision and Pattern Recognition (CVPR) - Deep Residual Learning for Image Recognition. 770–778.
[20]. Brosch T, Tang L. Y. W, Yoo Y, Li D. K. B, Traboulsee A, Tam R. 2016 Deep 3D convolutional encoder networks with shortcuts for multiscale feature integration applied to multiple sclerosis lesion segmentation. Medical Imaging .35(5):1229–1239.
[21]. Wahab N, Khan A, Lee Y. S 2019 Transfer learning based deep CNN for segmentation and detection of mitoses in breast cancer histopathological images. Microscopy .68(3):216–233.
[22]. Sohail A, Mukhtar M. A, Khan A, Zafar M. M, Zameer A, Khan S. 2020 Deep Object Detection Based Mitosis Analysis in Breast Cancer Histopathological Images. http://arxiv.org/abs/2003.08803.
[23]. Milletari F., Navab N., Ahmadi S. A 2016 V-Net: Fully Convolutional Neural Networks for Volumetric Medical Image Segmentation. 2016 Fourth International Conference on 3D Vision (3DV); Stanford, CA, USA. pp. 565–571.
[24]. Ishihara S, Ishihara K, Nagamachi M, Matsubara Y 1997 An analysis of Kansei structure on shoes using self-organizing neural networks. International Journal of Industrial Ergonomics .19(2):93–104.