


1. Introduction
|
|
The person here is wearing a full-body tracking suit to track movements | The developed body movement tracking system allows for results from only videos. |
*.https://www.rokoko.com/insights/types-of-motion-trackers | |
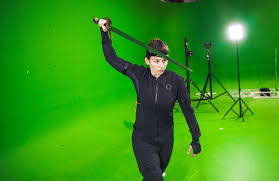
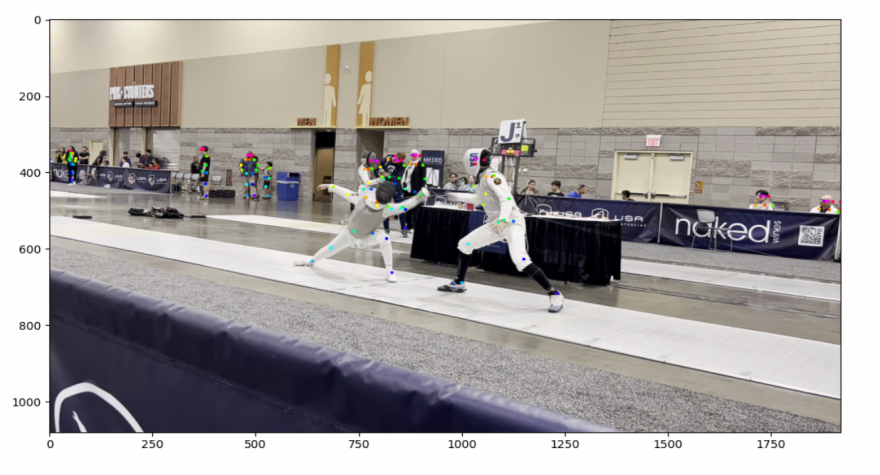
Figure 1. Types of body movements tracking
In athletics, people are very prone to injury, and these injuries may cause detrimental problems to their careers. The information on movement can be used as data and can be analyzed to find movements that create injury. Especially in athletics, tracking movements is a good way to find places where technique and posture are incorrect, allowing room for less room for injury and more room for improvement. Therefore, the tracking of body parts is very valuable. One way this could be done is by using sensors, which are usually attached to a person by using something that sticks the tracker onto the body part that wants to be tracked. Another way this could be done is by wearing clothing containing sensors. Though this form of tracking works, the cost, and the comfort come as a setback for the subject. A better way of tracking body movement would be through videos. In today’s world, everyone has access to a device with a camera, and by using them, the ability to track movement is available. To track the people in the videos, a deep learning algorithm is needed. In this algorithm, a system is created based on deep learning and Convolutional Neural Networks (CNN). The algorithm predicts the joint positions of each individual in the captured video. It then connects the corresponding joints to create a skeleton-like frame. In the end, the movement of the people can be seen from these skeletons. This system not only produces accurate results but also can be used in real-time applications due to its high efficiency.
There are two strategies to create 2D body tracking, one of which is the so-called top-down approach, this approach first uses object detection algorithms to obtain the bounding boxes of each individual. Then, the single-person post estimation is applied to each bounding box. This strategy heavily relies on the performance of the object detection algorithm. For example, if the bounding boxes are not accurate, then it is impossible to track body movement optimally. Moreover, the object detection algorithms are very resource-consuming, which creates limitations to real-time applications. Another approach would be to directly estimate all the joints of the people in the frame. This approach is more challenging in the sense that a more complicated pose estimation algorithm is needed. Although more challenging, this one-stage algorithm is faster and more straightforward than the two-stage top-down strategy. In this paper, the system follows the second, or bottom-up, strategy to compute the 2D body movement.
In this system, the use of CNN is needed. CNN is a powerful deep-learning architecture specialized in image recognition tasks. By stacking convolutional layers, it can extract visual features from fine-grain to larger scale in a hierarchical manner. Since the labeling of human body parts is resource-consuming, only a limited size of data is available to train the pose estimation algorithm. Therefore, CNN is first trained on a large-scale ImageNet dataset for classification tasks. Then, this pretrained CNN can be used for extracting features in this work. The extractions are fed into a preceding predictor to produce the body part positions.
The contributions of this work are as follows:
• A body movement tracker is successfully developed based on CNNs, which is accurate and efficient for real-time applications.
• The system can understand visual representations of the images from the use of pretrained CNN or transferred learning. Therefore, the resulting system achieves excellent performance.
• A graphic interface based on the tracking program has been developed, which can mark the body parts of athletes in the captured video, and is beneficial for real-world applications.
2. Related works
2.1. Sensor-based Sport Analysis
In analyses that are mainly focused on sports, the typical idea is to use a sensor that is attached to the subject’s joints, which then gives data to be analyzed. Similar to the proposal seen in this situation, the recorded data from the sensors is analyzed using deep learning. Existing sport analysis approaches can be mainly divided into two categories, one relies on body sensors to collect data on body movement such as the speed and angle of each body part [1]. The collected data has been successfully used in numerous sports analysis applications, including preperformance optimization, post-injury diagnosis, etc. For instance, Ghasemzadeh Hassan, Vitali Loseu, and Roozbeh Jafari [2] have proposed a wearable wrist device to improve the quality of golf movements. Panindre Prabodh, Vijay Gandhi, and Sunil Kumar [3] have created a device to track heart rate and predict and prevent the events of cardioembolic stroke and Atrial Fibrillation (AFib) episodes by using. They found that to classify AFib, Recurrent Neural Network (RNN) with Bi-directional Long Short-Term Memory (LSTM) is a better pick than the other AI algorithm. Choi, Edward, et al. [4] chose to use RNN to predict the initial diagnosis of heart failure. They found that using RNN worked better than other non-deep learning approaches.
2.2. Camera-based Sport Analysis
Although wearable sensors can provide accurate results, it is not universally applicable. For example, during the competitions or non-controlled areas. With the use of cameras, the analysis will not only be cheaper but will also relieve the athletes from wearing the sensors and devices. This approach became possible after the invention of convolutional neural networks. For example, Cao, Zhe, et al. [5] have built a pose estimation system solely with cameras via convolutional neural networks. There is a proposition to employ a neural network to first detect the bounding box of each person and then estimate the pose using an additional neural network [6, 7]. Since the bottom-up is more efficient than the top-down approach, the system proposed in this paper employs the bottom-up in the pose estimation module.
3. Background
The main building blocks of CNNs are convolutional layers, pooling layers, and fully-connected layers. A CNN network is built by stacking convolutional and pooling layers and adding a fully connected layer. As shown in the figure,
At a convolution layer, the input features are convolved with trainable kernels to generate the output features, which are often referred to as feature maps. Each trainable kernel will generate a corresponding feature map, capturing different visual aspects of the original image. The formulation of convolution [5] is as follows:
\( x_{j}^{l}=f({∑_{n∈{M_{j}}}} x_{i}^{l-1}*k_{ij}^{l}+b_{j}^{l}) \) ,
where \( {M_{j}} \) represents a selection of input maps and \( l \) denotes the layer number. Each output map is assigned an additive bias b. For a particular output map, the input maps will be convolved with distinct kernels.
As presented in the figure below, the process of pooling in a convolutional network is shown. From the input vector, a 3x3 matrix is taken as a pooled vector. A 3x3 kernel is then placed over the pooled vector to apply element-wise multiplication. Since one kernel only generates one feature map, multiple kernels are applied to have a diverse representation of the input image. After these processes, the sum is taken and placed in the corresponding destination in a smaller-sized matrix.
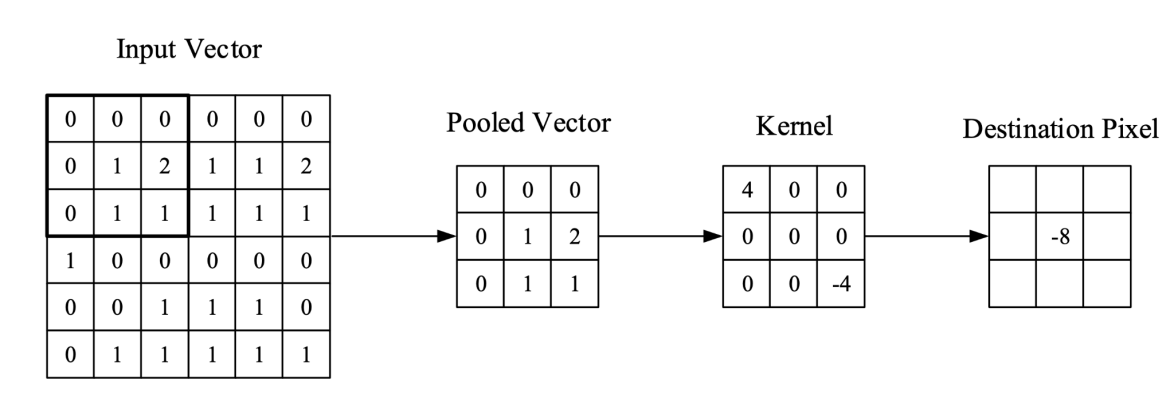
Figure 2. The process of a convolutional layer in the network [8]. The kernel is placed over the pooled vector that is taken from the input vector. Element-wise multiplication is applied between the kernel weight and the input values. The sum is taken from the pooled vector after the multiplication and is then placed in the array for the final destination.
Typical convolutional networks consist of the following components:
• Convolutional layers: Here, multiple convolutional filters are applied to the input image
to extract the image features from the low-level details to the global summary
information. This is achieved by stacking those convolutional layers in a hierarchical
manner.
• Activation function: To introduce non-linearity to the network, the Rectified linear unit
activation function (ReLu) is employed in between two consecutive convolutional layers. This activation function takes only the positive inputs and sets all of the negative inputs to zero.
• Fully connected layers: After obtaining the extracted features from the convolutional layers, they are pooled into a high-dimensional feature vector which represents the global information of the input image. This feature vector goes further to fully connected layers for predicting the final results.
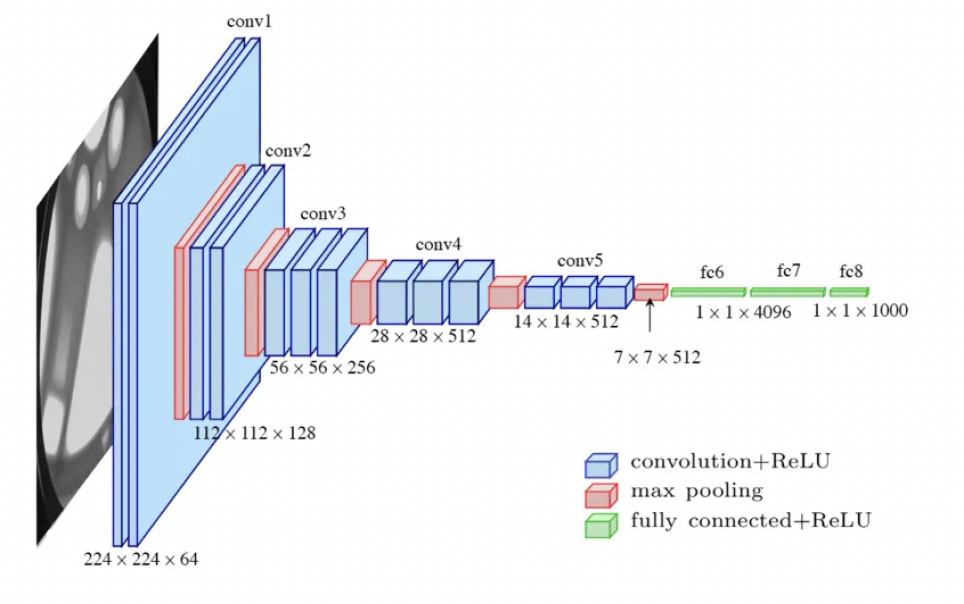
Figure 3. The architecture of a VGG network [9].
As shown in Fig. 3, VGG [10] networks are pretrained and employed as the feature extractor in this paper. This network is a powerful architecture for classification and proves to successfully learn representative features of the input image as well as outperform benchmarks in a variety of tasks. VGG finds its application in a variety of downstream tasks and archives remarkable performance results.
4. Method
In this paper, the application of convolutional networks for real-time body movement tracking of athletes is studied. More particularly, the body movement tracking system developed purely relies on cameras to successfully capture the movement of athletes. At the core of the system lies the pose estimation algorithm that uses the application of convolutional networks. The convolutional network is trained on a prepared dataset not only including the images but also the corresponding labels to accurately train the network. Furthermore, a graphical user interface (GUI) is developed based on the pose estimation algorithm. The user has the choice to select the desired video files captured by a camera which could also be played in the interface. In addition, there is a button to start the pose estimation process. This is important for users who do not know programming. In the following sections, each technical design will be described in more detail.
4.1. Pose Estimation
To accurately estimate the pose, a VGG network pretrained on ImageNet data is selected as the feature extractor. The network generates a set of feature maps that is input to the first stage of each branch. The pose estimation algorithm is based on OpenPose [5].
4.1.1. Generation of Confidence Map. Each 2D confidence map represents the probability that a particular body part appears at each pixel location. Within a single confidence map, the number of peaks should be the number of people as long as the body part is not hidden.
\( M_{j,k}^{*}(P)=exp(-\frac{||p-{x_{j,k}}||_{2}^{2}}{{σ^{2}}}) \)
In confidence map M, with j being the row and k being the column of the pixel’s position, the equation above calculates the probability of the targetted body part being at that location. The value p is the location or the coordinate of a pixel on the image. σ is a coefficient that is chosen to be 1 by default. It can be adjusted to further control the spread of the peak.
As mentioned above, the figure is given as an input to a VGG network that is a feature extractor. After obtaining the extracted features, the features are further fed into a sequence of convolutional layers that form the final prediction of joint locations on the image. The prediction module is divided into several stages. In the first stage, a set of confidence maps \( {S^{1}}={p^{1}}(F) \) is produced by the network. These confidence maps are fed into successive stages together with the original feature.
\( {S^{t}}={p^{t}}(F,{S^{t-1}}),for any t≥2 \)
In Figure 4, the refinement of the confidence maps is illustrated. To assist the network in having more precise prediction, a loss function is applied at the end of the stage. Mean squared error loss is adopted as the loss function between the prediction and the ground truth label. Notably, an additional weight is added to consider the case in which some body parts of a person are not shown in the image and should not be addressed in the loss function.
\( f_{S}^{t}=∑_{j=1}^{J} {∑_{p}} W(p)\cdot ||S_{j}^{t}(p)-S_{j}^{*}(p)||_{2}^{2} \)
For each joint, there will be a predicted confidence map. The corresponding ground truth confidence map is denoted by the symbol *. Finally, the losses from each stage will be totaled together to obtain the final loss.
\( f=∑_{t=1}^{T} (f_{S}^{t}) \)
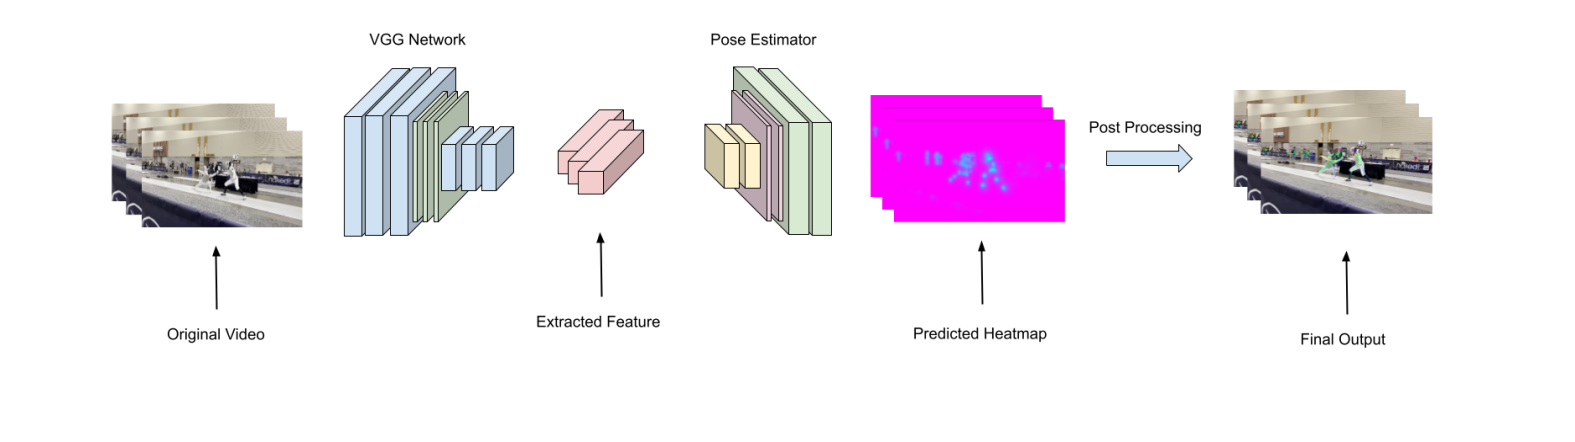
Figure 4. The image provided here shows the whole pipeline of the pose estimation algorithm. From left to right, the flowchart shows the process of the pose estimation algorithm. The feature extractor takes RGB images as input and gives summary information about the image in the form of tensors. The pose estimator takes the extracted features and makes predictions in the form of heat maps. The final result is the most possible positions being marked out on the image.
4.2. Body Movement Tracking System Design
Based on the pose estimation algorithm above, the graphic user interface is designed using Python version 3.6 in the work. The address of the recorded video should be given to the software and will be loaded and divided into a sequence of frames. The pose estimation mentioned above will be applied to each frame simultaneously. At the end, the output will be formed again into a video. In the designed GUI, there are a number of user options for visualizing the body movement. They are laid out as a design as follows:
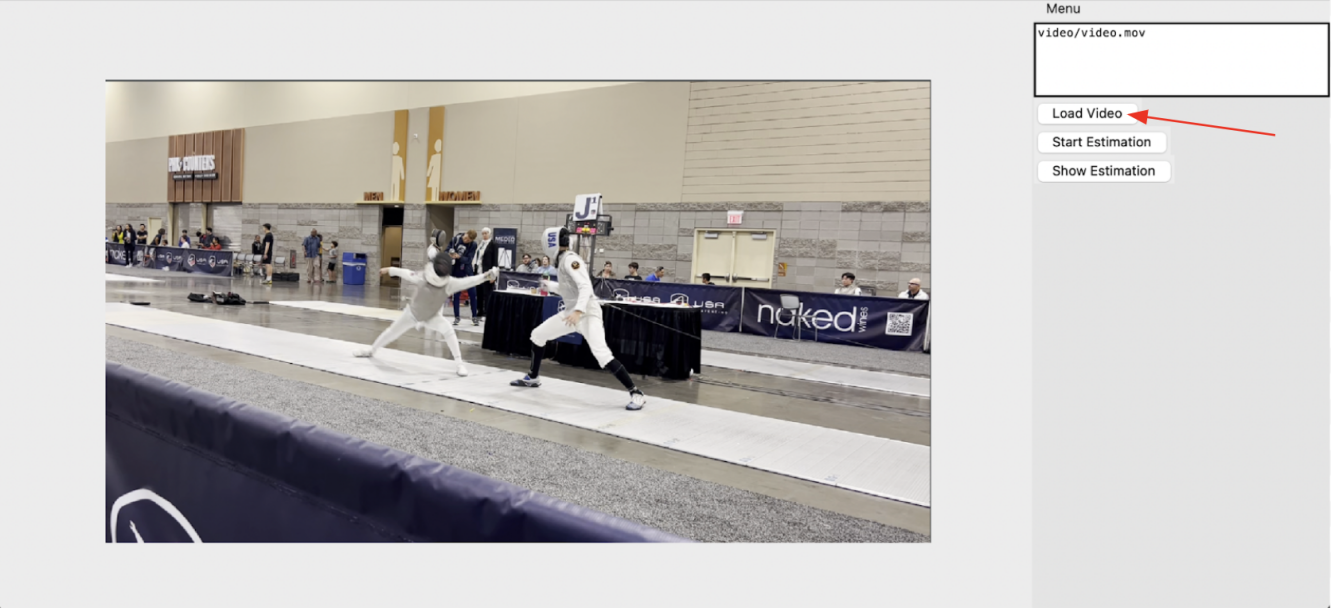
Figure 4. A video is chosen and loaded to be shown in the interface.
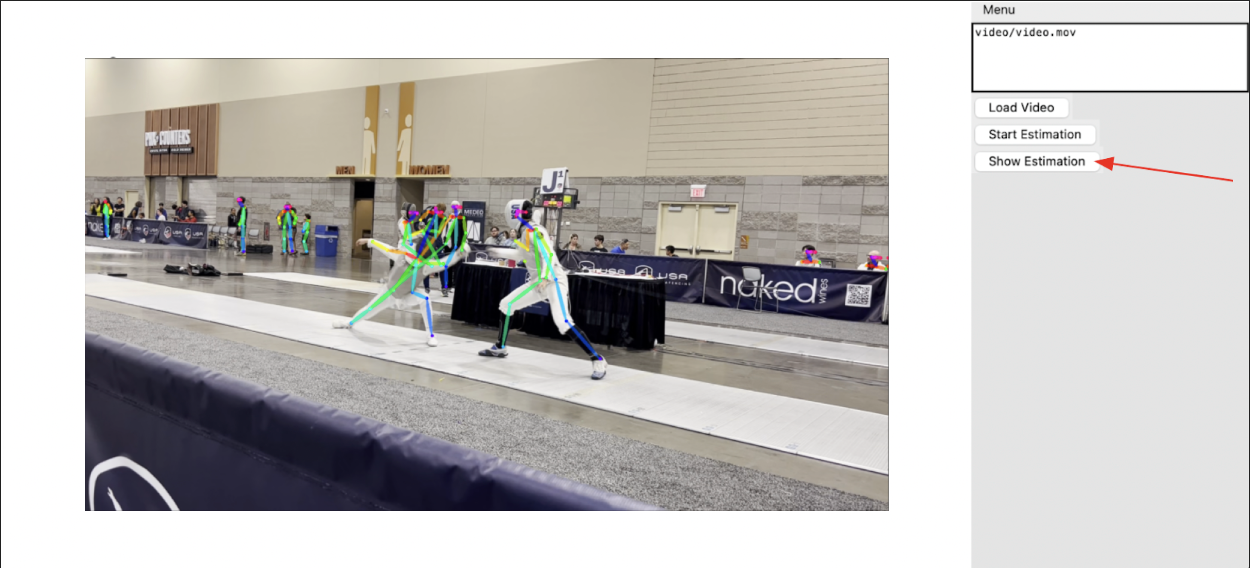
Figure 5. The loaded video is analyzed by the body movement tracking system.
4.2.1. Layout design. In the images shown above, Figure 4 shows the video chosen by the user that will be analyzed. The left side of the interface is used to display the original video along with the estimated results when the user decides. The menu on the right shows the video path as well as the buttons that will be used to control the estimation. Each button is as follows:
• Load Video: The button provided here takes the inputted path in the textbox and loads the video into the space on the left, which is used for displaying the estimations.
• Start Estimation: When this button is clicked, the program runs the implemented algorithm in the background. The estimated results will be stored in the file system.
• Show Estimation: The estimated results will be retrieved from the file system and shown on the left panel.
4.2.2. Estimation Pipeline. The video provided by the user is first separated into a sequence of frames. Once this is done, the algorithm generates a series of heatmaps corresponding to these frames. The heatmaps are used to represent the probability of a specific kind of joint located at each position in the input image. That is to say, 18 heatmaps will be generated for a single input image.
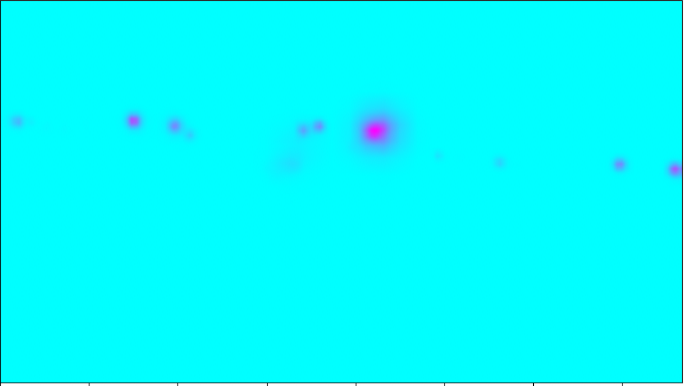
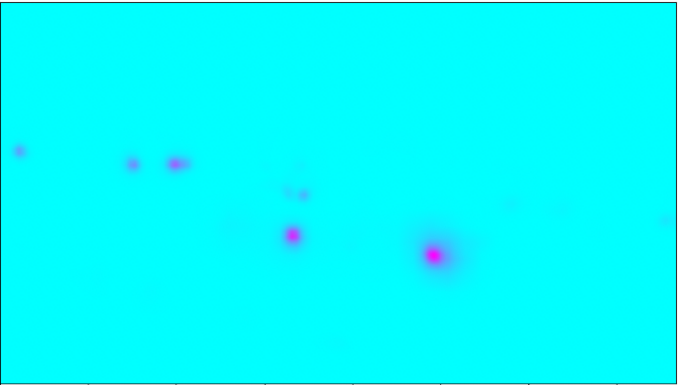
Figure 6. The heatmap on the left represents the probability of the head position. The heatmap on the left represents the probability of the left foot positions.
After obtaining these heat maps, the peak positions will be regarded as the final predictions of the joint location. The program will automatically combine these 18 heatmap positions into a single output as shown below.
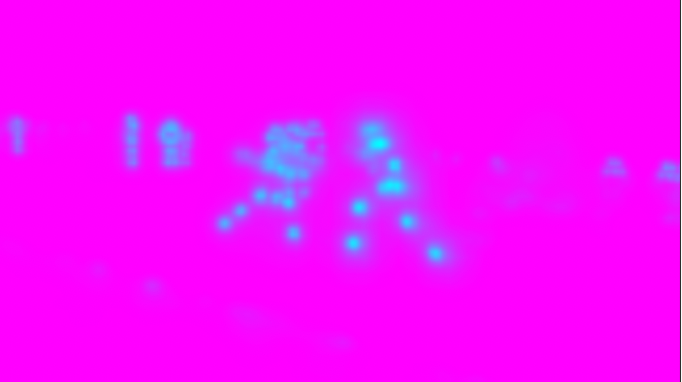
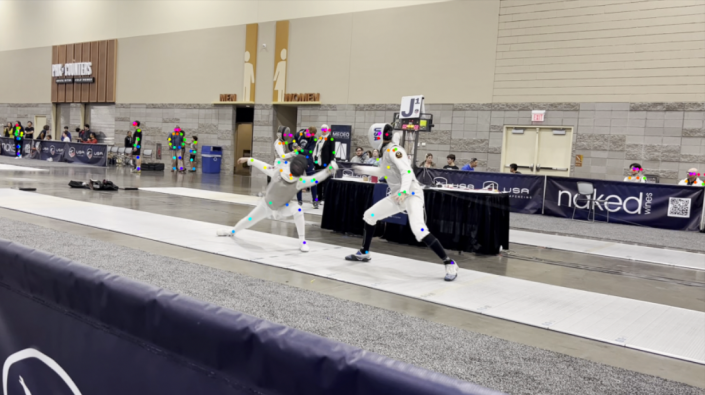
Figure 7. The heatmap on the left shows the combined heatmaps of the peak positions, which are the joints. On the right, the dots represent the joints determined from the heatmaps.
The joint positions are connected following the pre-defined skeleton model and visualized using colored lines representing the bones. The resulting image is shown below.
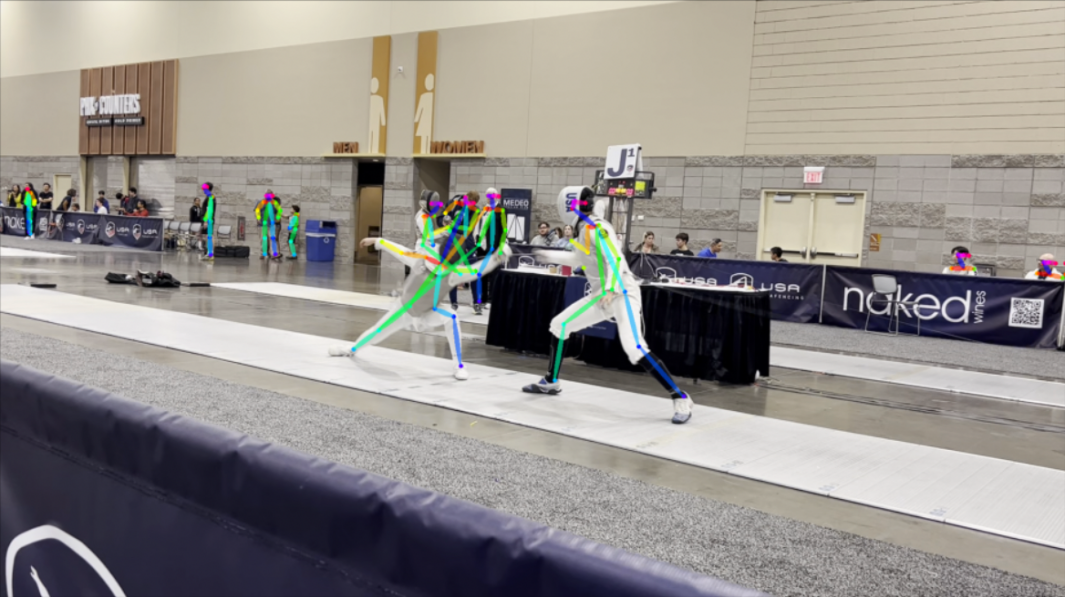
Figure 8. This is the image with the connected joints predicted from the pre-defined skeleton model.
Each frame taken from the original video goes through the exact process mentioned above. The resulting frames are put back together to form a video again, which is then displayed to the user.
5. Experiments
5.1. Experiment Setup
This code is implemented using Python 3.6 and Tensorflow 1.15. The pose estimation algorithm is based on the official implementation of OpenPose[5]. The pose estimator is pretrained on the COCO 2016 keypoint challenge dataset and applied to the own photos of the author. For computation reduction, I resized the input image to the standard size of 1080x1920. A skeleton template with 18 joints is adopted to represent the human body.
5.2. Experiment Results
Table 1. Pretrained results on the COCO 2016 keypoint challenge. AP50 is for OKS (Object Keypoint Similarity) = 0.5, and APL is for large-scale persons. The COCO evaluation defines the object keypoint similarity (OKS) and uses the mean average precision (AP). The OKS is calculated by taking how close a predicted keypoint is to its true keypoint normalized to 0-1. AP is obtained by dividing the predictions into correct and wrong using the threshold.
Method | AP | AP50 | AP75 | APM | APL |
OpenPose[5] | 61.8 | 84.9 | 67.5 | 57.1 | 68.2 |
G-RMI [11] | 60.5 | 82.2 | 66.2 | 57.6 | 66.6 |
DL-61 | 54.4 | 75.3 | 50.9 | 58.3 | 54.3 |
R4D | 51.4 | 75.0 | 55.9 | 47.4 | 56.7 |
The model was first pretrained on the COCO 2016 dataset and the performance evaluation is shown in Table 1. It can be seen that OpenPose performs better than the other methods. Considering the performance and efficiency of the OpenPose model, it is adopted as the default pose estimator in this motion tracking system in this paper.
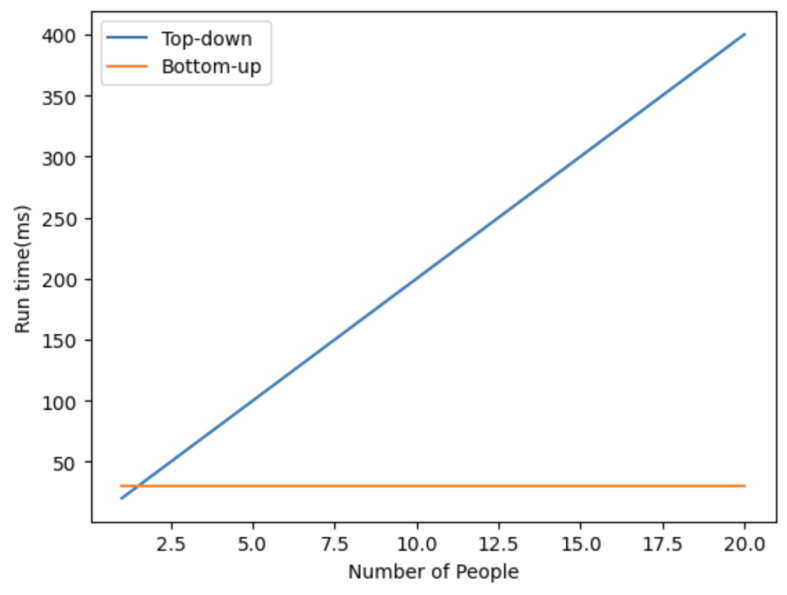
Figure 9. Runtime comparison between bottom-up and top-down methods. As the number of people increases, the top-down method also has an increase in the runtime while the bottom-up method is constant in runtime [5].
As shown in Figure 9, the computation efficiency is evaluated and compared. From this, it is evidently shown the top-down method increases in runtime as the number of people in the frame increases. On the other hand, the bottom-up method has a constant runtime despite having an increase in the number of bounding boxes. This is especially beneficial in sports scenarios with numerous players or referees. Fencing, for example, has at least two people in the frame. The referee, coaches, or other bystanders may also be included. With the bottom-up approach, it can achieve the real-time analysis of movement tracking.
In Figure 10, I show the effect of using a different number of stages on the final product with mean average precision as a measurement. From this, the graph shows there to be an overall growth with the increase of normalized distance. At the last stage, or Stage 6, the is a higher accuracy than the other stages. This is due to the balance in model capacity and overfitting. Therefore, the number of stages is set to 6 by default for the rest of the experiment.
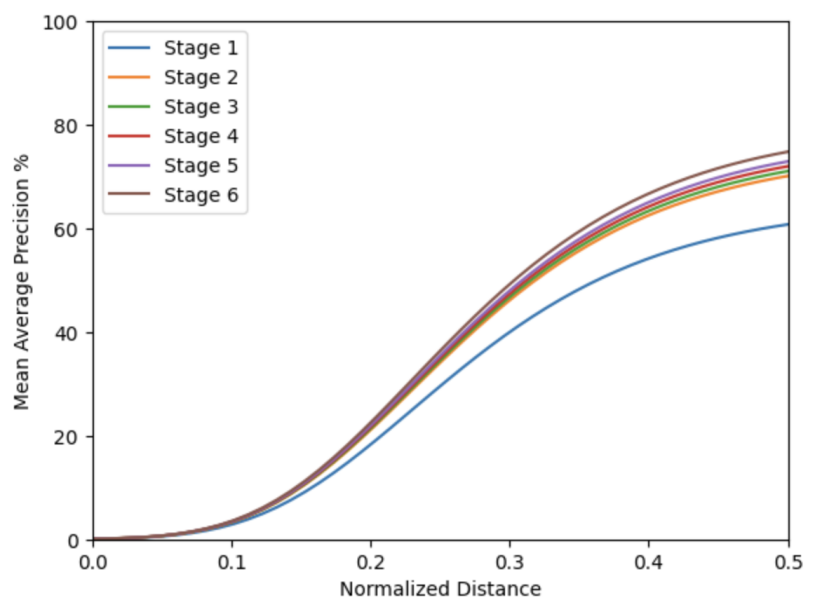
Figure 10. Mean average precision over normalized distance for the number of stages. The normalized distance represents the margin of error when considering the prediction as accurate or not. Given this, the graph shows the accuracy growing as the normalized distance grows.
6. Conclusion
The resonating problem with the injuries of athletes due to the lack of attention and ability to analyze their technique has been an issue. With modern cameras and the capability to store videos, the body movement data can be captured without having subject wear sensors. This is because deep learning allows capturing movement to understand the behaviors and movements of those in the video. To do this, I have researched existing approaches and found the bottom-up method to be the most appropriate algorithm. It allows for efficiency for multi-person frames. Based on this algorithm, a movement tracking system is designed to complete the task of successfully identifying the joint positions. Additionally, for the convenience of the user, a software was created to easily present the results. Given the provided software, anyone is able to receive the tracked movements with just their smartphone.
The next step is to going above and beyond with this application is to have a higher-level analysis. Currently, the system only allows for movement tracking. A more complex analysis of the movement would be to have an automatic examination of when the movement of the subject becomes dangerous. The task of deeply examining the tracked movements, done by coaches or other sports authorities, is extremely tedious and time-consuming. The overall idea to counter this issue is to have a system that allows for automatic identification of when there is an incorrect or dangerous movement done by the subject. By doing this, there will be a greater and faster improvement for a more successful and safer performance.
References
[1]. Ma, Biao, et al. "Research and analysis of sports training real-time monitoring system based on mobile artificial intelligence terminal." Wireless Communications and Mobile Computing 2020 (2020): 1-10.
[2]. Ghasemzadeh Hassan, Vitali Loseu, and Roozbeh Jafari. "Wearable coach for sport training: A quantitative model to evaluate wrist-rotation in golf." Journal of Ambient Intelligence and Smart Environments 1.2 (2009): 173-184.
[3]. Panindre Prabodh, Vijay Gandhi, and Sunil Kumar. "Comparison of performance of artificial intelligence algorithms for real-time atrial fibrillation detection using instantaneous heart rate." 2020 IEEE 17th International Conference on Smart Communities: Improving Quality of Life Using ICT, IoT and AI (HONET). IEEE, 2020.
[4]. Choi, Edward, et al. "Using recurrent neural network models for early detection of heart failure onset." Journal of the American Medical Informatics Association 24.2 (2017): 361-370.
[5]. Cao, Zhe, et al. "Realtime multi-person 2d pose estimation using part affinity fields." Proceedings of the IEEE conference on computer vision and pattern recognition. 2017.
[6]. Gkioxari, Georgia, et al. "Using k-poselets for detecting people and localizing their keypoints." Proceedings of the IEEE Conference on Computer Vision and Pattern Recognition. 2014.
[7]. Sun Min, and Silvio Savarese. "Articulated part-based model for joint object detection and pose estimation." 2011 International Conference on Computer Vision. IEEE, 2011.
[8]. O'Shea, Keiron, and Ryan Nash. "An introduction to convolutional neural networks." arXiv preprint arXiv:1511.08458 (2015).
[9]. Bangar, Siddhesh. “VGG-Net Architecture Explained.” Medium, 28 June 2022, medium.com/@siddheshb008/vgg-net-architecture-explained-7117931050f.
[10]. Simonyan, Karen, and Andrew Zisserman. "Very deep convolutional networks for large-scale image recognition." arXiv preprint arXiv:1409.1556 (2014).
[11]. Papandreou, George, et al. "Towards accurate multi-person pose estimation in the wild." Proceedings of the IEEE conference on computer vision and pattern recognition. 2017.
Cite this article
Tang,A. (2024). Real-time body movement tracking of athletes via a CNN-based approach. Applied and Computational Engineering,67,31-40.
Data availability
The datasets used and/or analyzed during the current study will be available from the authors upon reasonable request.
Disclaimer/Publisher's Note
The statements, opinions and data contained in all publications are solely those of the individual author(s) and contributor(s) and not of EWA Publishing and/or the editor(s). EWA Publishing and/or the editor(s) disclaim responsibility for any injury to people or property resulting from any ideas, methods, instructions or products referred to in the content.
About volume
Volume title: Proceedings of the 2nd International Conference on Software Engineering and Machine Learning
© 2024 by the author(s). Licensee EWA Publishing, Oxford, UK. This article is an open access article distributed under the terms and
conditions of the Creative Commons Attribution (CC BY) license. Authors who
publish this series agree to the following terms:
1. Authors retain copyright and grant the series right of first publication with the work simultaneously licensed under a Creative Commons
Attribution License that allows others to share the work with an acknowledgment of the work's authorship and initial publication in this
series.
2. Authors are able to enter into separate, additional contractual arrangements for the non-exclusive distribution of the series's published
version of the work (e.g., post it to an institutional repository or publish it in a book), with an acknowledgment of its initial
publication in this series.
3. Authors are permitted and encouraged to post their work online (e.g., in institutional repositories or on their website) prior to and
during the submission process, as it can lead to productive exchanges, as well as earlier and greater citation of published work (See
Open access policy for details).
References
[1]. Ma, Biao, et al. "Research and analysis of sports training real-time monitoring system based on mobile artificial intelligence terminal." Wireless Communications and Mobile Computing 2020 (2020): 1-10.
[2]. Ghasemzadeh Hassan, Vitali Loseu, and Roozbeh Jafari. "Wearable coach for sport training: A quantitative model to evaluate wrist-rotation in golf." Journal of Ambient Intelligence and Smart Environments 1.2 (2009): 173-184.
[3]. Panindre Prabodh, Vijay Gandhi, and Sunil Kumar. "Comparison of performance of artificial intelligence algorithms for real-time atrial fibrillation detection using instantaneous heart rate." 2020 IEEE 17th International Conference on Smart Communities: Improving Quality of Life Using ICT, IoT and AI (HONET). IEEE, 2020.
[4]. Choi, Edward, et al. "Using recurrent neural network models for early detection of heart failure onset." Journal of the American Medical Informatics Association 24.2 (2017): 361-370.
[5]. Cao, Zhe, et al. "Realtime multi-person 2d pose estimation using part affinity fields." Proceedings of the IEEE conference on computer vision and pattern recognition. 2017.
[6]. Gkioxari, Georgia, et al. "Using k-poselets for detecting people and localizing their keypoints." Proceedings of the IEEE Conference on Computer Vision and Pattern Recognition. 2014.
[7]. Sun Min, and Silvio Savarese. "Articulated part-based model for joint object detection and pose estimation." 2011 International Conference on Computer Vision. IEEE, 2011.
[8]. O'Shea, Keiron, and Ryan Nash. "An introduction to convolutional neural networks." arXiv preprint arXiv:1511.08458 (2015).
[9]. Bangar, Siddhesh. “VGG-Net Architecture Explained.” Medium, 28 June 2022, medium.com/@siddheshb008/vgg-net-architecture-explained-7117931050f.
[10]. Simonyan, Karen, and Andrew Zisserman. "Very deep convolutional networks for large-scale image recognition." arXiv preprint arXiv:1409.1556 (2014).
[11]. Papandreou, George, et al. "Towards accurate multi-person pose estimation in the wild." Proceedings of the IEEE conference on computer vision and pattern recognition. 2017.