


1. Introduction
Diabetes is one of the most common chronic diseases in the world. Expected to reach 643 million people by 2030 and 783 million by 2045, diabetes affects 10 percent of the global population, according to the International Diabetes Federation (IDF). Treating and curing the mostly preventable complication requires most of the cost, accounting for nearly $1 trillion in spending [1]. Most of the traditional methods of treating diabetes are medications, which do not cure or lead to remission of the disease. Moreover, manual diagnosis is subjective, and different diagnostic result may be attribute to different clinical experience and expertise of physicians or the diversity of patients' disease manifestations [2]. Machine learning technology has advanced quickly in recent years, making it a useful tool for objective and affordable disease detection. M. Deberneh and colleagues made predictions with accuracies ranging from 71% to 73% using logistic random forest, regression, XGBoost, support vector machine, and integrated machine learning methods based on these factors [3]. Detecting outliers in these high dimensional data by isolation forest method, multivariate iterative method based on extreme random tree (extra tree) regression to interpolate missing values, hierarchical splitting strategy, for predicting the risk of diabetes mellitus in the presence of class imbalance, machine learning was used by Sadeghi et al., deep neural network (DNN) with an accuracy of 0.856. The accuracy of DNN was found to be 0.856. The accuracy of Sadeghi et al. reached 0.856 [4]. With the data from the China Health and Retirement Longitudinal Study (CHARLS), Bu et al. used screened the variables for the best predictors of the model based on 10-fold cross-validation LASSO regression analysis,and the predictors of frailty in diabetic patients were daily living activities and marital status, which was showed by multivariate logistic regression analysis. For the internal validation and predictive model set the Area Under the Curve (AUC) values were 0.881 (95% CI 0.829-0.934) and 0.912 (95% CI 0.887-0.937) respectively [5]. Different data processing methods and different models based on different predictions of diabetes obtained excellent performance, but DNN, random forest, and support vector machine consist of a large number of parameters and complex structure so the interpretability is limited; logistic regression can't fit the training data well, and the ability to handle complex data will be limited. Since XGBoost is easy to be used on the training data and is prone to overfitting on the training data because of the high complexity of the model, it leads to a decrease in generalization ability. In this study, Gradient Boosting Decision Tree (GBDT) was used for feature selection and accordingly GDBT-based diabetes prediction was performed again and the cut-off value of glycated hemoglobin level was calculated.
2. Methods
2.1. Diabetes data sets
In this study the dataset was obtained from the Kaggle website diabetes prediction. This dataset was collected from 10,000 samples and five characteristics of each sample were captured: gender, hypertension, smoking history, Body Mass Index (Body Mass Index, BMI), HbA1c_level (glycated hemoglobin level), and blood glucose level. Among them, 59% were male and 41% were female, and the mean age was about 42 years. This dataset is rich in data types and has sufficient amount of data, which is suitable for use in this study (Figure 1).
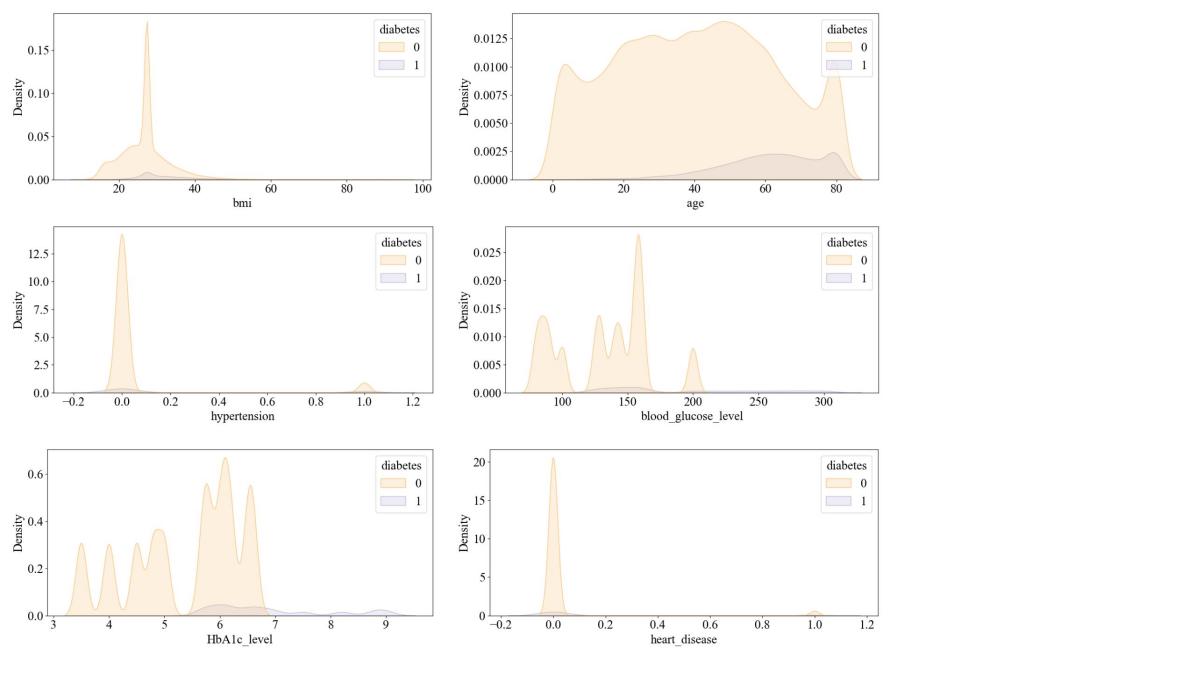
Figure 1. The visualization of data distribution of the dataset
2.2. Feature screening based on Pearson's correlation
Pearson's correlation coefficients are probably the two most commonly used correlation coefficients in medical research [6]. Pearson's coefficients are filtered algorithms in the field of feature selection, used to measure the correlation between two variables, which can be used to understand the relationship between a feature and the corresponding variable in a simple and clear way. Pearson's coefficient presents the relationship between variables in a numerical way and is directional, taking the value of the interval of [-1, 1], and the value closer to 0, the weaker the correlation of the feature.
The two sets of data were first subjected to the Z-score, which is the distance of the data from the center in a normal distribution, and it is equal to the variable minus the mean divided by the standard deviation. Denoting the Pearson's correlation coefficient by r, the formula is as follows.
\( R=\frac{{l_{xy}}}{\sqrt[]{{l_{xx}}{l_{yy}}}}=\frac{\sum _{i=1}^{n}\frac{(x-\bar{x})(y-\bar{y})}{(n-1)}}{\sqrt[]{\sum _{i=1}^{n}\frac{{(x-\bar{x})^{2}}}{(n-1)}}\cdot \sqrt[]{\sum _{i=1}^{n}\frac{{(y-\bar{y})^{2}}}{(n-1)}}}\ \ \ (1) \)
where \( R \) indicates the Pearson's correlation, \( x \) and \( y \) was two variables, \( \bar{x} \) and \( \bar{y} \) denoted the mean of the two variables respectively, \( n \) denoted the number of samples. The calculation is completed to get the results based on Pearson's correlation coefficient for visualization.
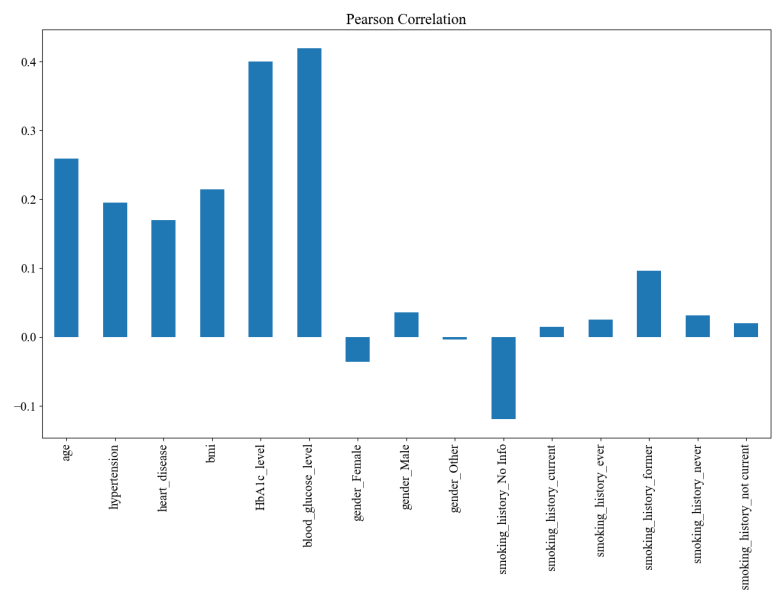
Figure 2. Visualization results of feature selection based on Pearson's coefficient
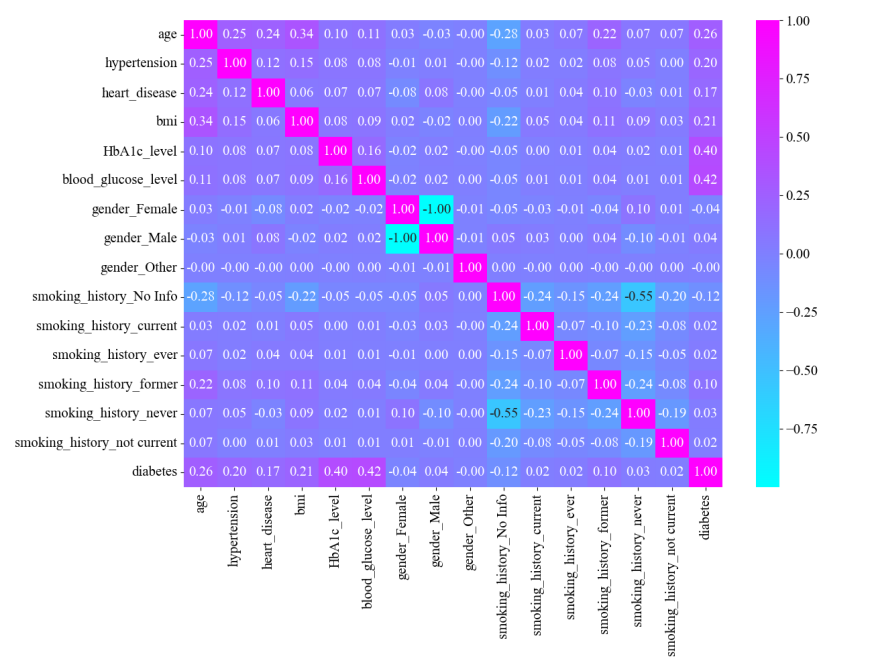
Figure 3. Feature Selection Heat Matrix Diagram
From the final visualization, the most relevant features are glycated hemoglobin levels and blood glucose levels, which are moderately correlated. The distribution of the prevalent population was further analyzed for these two features (Figure 2 and Figure 3). Diabetics have higher blood glucose levels. There is almost no distribution of diabetic patients with blood glucose levels ≤100; blood glucose levels >100 begin to have patient divisions, peaking at around 160; and blood glucose levels >200 are almost exclusively diabetic (Figure 4(a)). Diabetic patients have higher glycosylated hemoglobin levels. Glycosylated hemoglobin levels ≤5 had almost no distribution of diabetic patients; glycosylated hemoglobin levels >5 began to branch out and peaked at around 6; and glycosylated hemoglobin levels >7 were almost exclusively diabetic (Figure 4(b)).
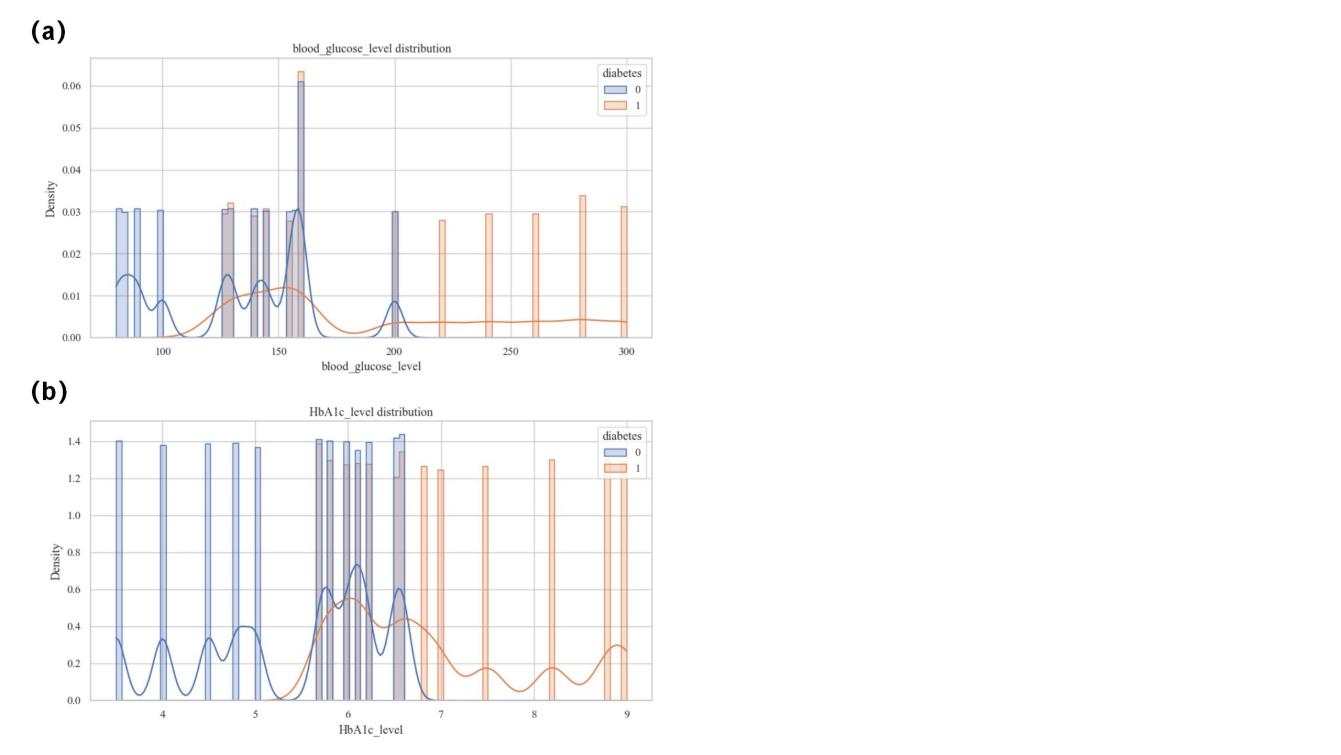
Figure 4. Population Distribution. (a)The distribution of blood glucose level. (b)The distribution of HbAlc level.
2.3. Models
2.3.1. GBDT
This study accomplished diabetes prediction based on GBDT. The computational process of GBDT prediction: GBDT first initializes a base model to predict the input sample (x) in the 0th round to get the initial prediction value. Then train a decision tree, calculate the residual between the prediction value of the previous round of the model and the true target value, and use this residual as the target value to train a new decision tree, which aims to accurately predict the residual of each training sample as much as possible Finally, the prediction result of this new decision tree is multiplied by the learning rate and added to the cumulative prediction result of all the previous decision trees, so as to update the prediction of the model.
Suppose a GBDT model containing \( N \) decision trees are trained, for each decision tree \( (T\_i) \) , its prediction of the sample \( (h\_i(x)) \) is calculated and multiplied by the corresponding learning rate. After a set number of iteration rounds, forming the final prediction model requires the accumulation of the predictions from all decision trees. The final predicted values are as follows.
\( F(x)={F_{0}}(x)+η\sum _{i=1}^{N}{h_{i}}(x)\ \ \ (2) \)
GBDT approximates the true value by accumulating the predictions of the residuals from each round of according to the number of registers.
2.3.2. Other models
The performance of GBDT was compared with those of other classical machine learning models. Logistic regression provides an effective and powerful way of analysing the effects of a set of independent variables by iteratively identifying the strongest linear combinations of variables with the highest probability of detecting an observation, using linear regression components reflected on a logarithmic scale [7]. Decision trees allows segmentation, prediction, identification-interrelation and recoding, given a wide range of possibilities and the results that can be easily understood by any user [8]. And in a random forest model, each of the trees in the algorithm evaluates each new case, and in the case of classification, the predicted outcome is the majority class, or in the case of regression, is the average of all predictions [9].Because its internal structure is an ensemble of shallow decision trees, AdaBoost is considered a typical black box that uses weighted majority voting to classify data instances [10]. XGBoost which follows the same rule fo gradient boosting, uses the objective function, tree size, and weighting, controlled by standard regularization parameters, to reduce overfitting and improve performance [11]. DNN learns data features and patterns through multiple layers of neurons, consisting of an input layer, hidden layer, activation function, forward propagation, loss function, back propagation, and a process of repetitive training to achieve prediction and classification of complex tasks.
2.4. Training process
In this study, using the characteristics as independent variables and the presence of diabetes as dependent variable, 70% of the data was used for training, while the remaining 30% was used for prediction testing. The parameter was set to 50, this parameter set the random seed to ensure reproducibility.
Several metrics were evaluated with respect to Recall Rate, F1 Score, Predictive Value, Accuracy and Area Under the Curve (AUC). In the medical field, recall rate and accuracy are crucial, so these two will be used as important evaluation criteria. After obtaining the model, the Receiver Operating Characteristic curve (ROC) and AUC values are calculated based on the result of feature screening in the previous section, i.e., glycated hemoglobin, and then the AUC curve is plotted. ROC curve specific process is as follows.
\( TPR=\frac{TP}{(TP+FN)}\ \ \ (3) \)
\( FPR=\frac{FP}{(FP+TN)}\ \ \ (4) \)
where TP denotes the number of True Positive cases, FN denotes the number of False Negative cases, FP denotes the number of False Positive cases and TN denotes the number of True Negative cases.
A common method for determining the cutoff value is the Youden Index maximum point [12], in this experiment, the cut-off value of glycated hemoglobin was obtained by calculating the Youden Index. Youden Index is calculated as follows.
\( Sensitivity=\frac{TP}{(TP+FN)}\ \ \ (5) \)
\( Specificity=\frac{TN}{(TN+FP)}\ \ \ (6) \)
\( Youden Index=Sensitivity+Specificity-1\ \ \ (7) \)
After calculating the Youden index for each categorical threshold, the largest 1categorical threshold is then the cutoff value for glycated hemoglobin.
3. Results and discussion
For AUC, the value of GBDT reaches 0.9788, but the decision tree is only 0.8554 (Figure 5(a)). For the prediction value, the value of GDBT is 0.9804, with poor decision tree performance and other mediocre performance (Figure 5(b)). For the recall rate, the value of GBDT is 0.9992, with poor decision tree performance and other mediocre performance (Figure 5(c)). Considering the accuracy rate, the GBDT value is 0.9717, which is close to AdaBoost, but the decision tree and logistic regression perform poorly, and the other performances are mediocre (Figure 5(d)). And for the F1 score, the value of GBDT is 0.9847, which is close to that of AdaBoost, but the decision tree and logistic regression perform poorly (Figure 5(e) and Table 1).
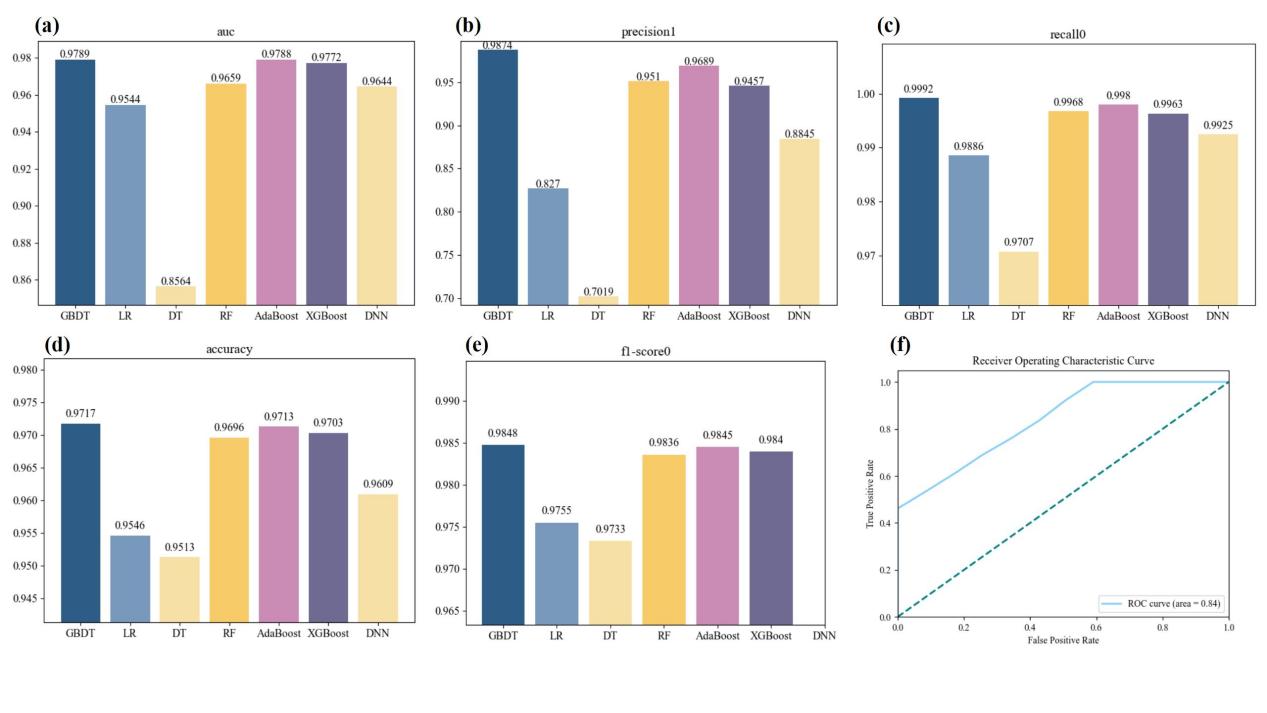
Figure 5. Metrics visualization. (a)Value of AUC for each model. (b)Value of precision for each model. (c)Value of recall for each model, (d)Value of accuracy for each model. (e)Value of f1-score for each model. (f) Receiver Operating Characteristic curve of the model for glycated hemoglobin level.
Table 1. Evaluated metrics for each model | |||||||
GBDT | Logistic regression | Decision tree | Random forest | AdaBoost | XGBoost | DNN | |
AUC | 0.9789 | 0.9544 | 0.8546 | 0.9640 | 0.9788 | 0.9772 | 0.9644 |
precision | 0.9874 | 0.8270 | 0.7019 | 0.951 | 0.9689 | 0.9457 | 0.8845 |
recall | 0.9992 | 0.9886 | 0.9707 | 0.9968 | 0.9980 | 0.9963 | 0.9925 |
accuracy | 0.9717 | 0.9546 | 0.9513 | 0.9696 | 0.9713 | 0.9703 | 0.9609 |
F1-score | 0.9848 | 0.9755 | 0.9733 | 0.9836 | 0.9845 | 0.9804 | \ |
For glycated hemoglobin level the model AUC value is 0.7307 The cut-off value for the glycosylated blood red level is approximately 6.8. Compared with models such as logistic regression, GBDT can achieve better performance for the following possible reasons. The image of the data set above reflects that although this data set has a large number of samples and types, most of them show nonlinear correlation without strong regularity, and the results presented by the linear model may be less than ideal, while GBDT captures the nonlinear relationship of the data through the combination of the decision tree, so it can show the ideal results. GBDT is robust to outliers and data noise, which can improve the stability of the model.
There are still some limitations in this study. The blood glucose level in the dataset refers to the amount of glucose in the blood at a given time, but it did not specify what time period the level is. And for the hypertension condition data the degree of hypertension condition is not specified, but only a simple distinction between 0 and 1 is made. Although the AUC value of the diabetes prediction model based on GBDT alone was very high, for glycated hemoglobin level the model AUC did not reach a very high value.
4. Conclusion
This study demonstrated the prediction of diabetes mellitus based on GBDT model and its AUC value was 0.9788, for glycated hemoglobin level the model AUC value was 0.7307. The cut-off value for the glycosylated blood red level was approximately 6.8. Diabetes prediction based on GBDT has a wide range of future developments, such as personalized medicine, intelligent health management, and building larger and more diverse datasets to enrich patient characteristics. The active use of GBDT will also lead to a better lifestyle and environment for human beings in the future.
References
[1]. International Diabetes Federation 2021 IDF Diabetes Atlas, Brussels, Belgium: International Diabetes Federation.
[2]. Wendy K Chung, Karel Erion, Jose C Florez, et al 2020 Precision medicine in diabetes: a Consensus Report from the American Diabetes Association (ADA) and the European Association for the Study of Diabetes (EASD). Diabetologia. 63 1671–93
[3]. Henock M Deberneh and Intaek Kim 2021 Prediction of Type 2 Diabetes Based on Machine Learning Algorithm. Int J Environ Res Public Health. 18 3317
[4]. Somayeh Sadeghi, Davood Khalili, Azra Ramezankhani, Mohammad Ali Mansournia and Mahboubeh Parsaeian 2022 Diabetes mellitus risk prediction in the presence of class imbalance using flexible machine learning methods. BMC Med Inform Decis Mak. 22 36
[5]. Bu F, Deng XH, Zhan NN, Cheng H, Wang ZL, Tang L, Zhao Y, Lyu QY 2023 Development and validation of a risk prediction model for frailty in patients with diabetes BMC Geriatr. 23 172
[6]. Pripp AH 2018 Pearson's or Spearman's correlation coefficients Tidsskr Nor Laegeforen. 138
[7]. Stoltzfus JC 2011 Pearson's or Spearman's correlation coefficients Acad Emerg Med. 18 1099-104
[8]. Al Fryan LH, Shomo MI, Alazzam MB and Rahman MA 2022 Processing Decision Tree Data Using Internet of Things (IoT) and Artificial Intelligence Technologies with Special Reference to Medical Application. Biomed Res Int. 2022 8626234
[9]. Rigatti SJ 2017 Random Forest. J Insur Med. 47 31-39
[10]. Hatwell J, Gaber MM and Atif Azad RM 2020 Ada-WHIPS: explaining AdaBoost classification with applications in the health sciences. BMC Med Inform Decis Mak 20 250
[11]. Davagdorj K, Pham VH, Theera-Umpon N and Ryu KH 2020 XGBoost-Based Framework for Smoking-Induced Noncommunicable Disease Prediction. Int J Environ Res Public Health. 17 6513
[12]. Farrokh Habibzadeh, Parham Habibzadeh, and Mahboobeh Yadollahie 2016 On determining the most appropriate test cut-off value: the case of tests with continuous results. Biochem Med (Zagreb). 26 297–307
Cite this article
Wu,X. (2024). Development and validation of a GBDT-based for detection of diabetes. Applied and Computational Engineering,67,115-121.
Data availability
The datasets used and/or analyzed during the current study will be available from the authors upon reasonable request.
Disclaimer/Publisher's Note
The statements, opinions and data contained in all publications are solely those of the individual author(s) and contributor(s) and not of EWA Publishing and/or the editor(s). EWA Publishing and/or the editor(s) disclaim responsibility for any injury to people or property resulting from any ideas, methods, instructions or products referred to in the content.
About volume
Volume title: Proceedings of the 2nd International Conference on Software Engineering and Machine Learning
© 2024 by the author(s). Licensee EWA Publishing, Oxford, UK. This article is an open access article distributed under the terms and
conditions of the Creative Commons Attribution (CC BY) license. Authors who
publish this series agree to the following terms:
1. Authors retain copyright and grant the series right of first publication with the work simultaneously licensed under a Creative Commons
Attribution License that allows others to share the work with an acknowledgment of the work's authorship and initial publication in this
series.
2. Authors are able to enter into separate, additional contractual arrangements for the non-exclusive distribution of the series's published
version of the work (e.g., post it to an institutional repository or publish it in a book), with an acknowledgment of its initial
publication in this series.
3. Authors are permitted and encouraged to post their work online (e.g., in institutional repositories or on their website) prior to and
during the submission process, as it can lead to productive exchanges, as well as earlier and greater citation of published work (See
Open access policy for details).
References
[1]. International Diabetes Federation 2021 IDF Diabetes Atlas, Brussels, Belgium: International Diabetes Federation.
[2]. Wendy K Chung, Karel Erion, Jose C Florez, et al 2020 Precision medicine in diabetes: a Consensus Report from the American Diabetes Association (ADA) and the European Association for the Study of Diabetes (EASD). Diabetologia. 63 1671–93
[3]. Henock M Deberneh and Intaek Kim 2021 Prediction of Type 2 Diabetes Based on Machine Learning Algorithm. Int J Environ Res Public Health. 18 3317
[4]. Somayeh Sadeghi, Davood Khalili, Azra Ramezankhani, Mohammad Ali Mansournia and Mahboubeh Parsaeian 2022 Diabetes mellitus risk prediction in the presence of class imbalance using flexible machine learning methods. BMC Med Inform Decis Mak. 22 36
[5]. Bu F, Deng XH, Zhan NN, Cheng H, Wang ZL, Tang L, Zhao Y, Lyu QY 2023 Development and validation of a risk prediction model for frailty in patients with diabetes BMC Geriatr. 23 172
[6]. Pripp AH 2018 Pearson's or Spearman's correlation coefficients Tidsskr Nor Laegeforen. 138
[7]. Stoltzfus JC 2011 Pearson's or Spearman's correlation coefficients Acad Emerg Med. 18 1099-104
[8]. Al Fryan LH, Shomo MI, Alazzam MB and Rahman MA 2022 Processing Decision Tree Data Using Internet of Things (IoT) and Artificial Intelligence Technologies with Special Reference to Medical Application. Biomed Res Int. 2022 8626234
[9]. Rigatti SJ 2017 Random Forest. J Insur Med. 47 31-39
[10]. Hatwell J, Gaber MM and Atif Azad RM 2020 Ada-WHIPS: explaining AdaBoost classification with applications in the health sciences. BMC Med Inform Decis Mak 20 250
[11]. Davagdorj K, Pham VH, Theera-Umpon N and Ryu KH 2020 XGBoost-Based Framework for Smoking-Induced Noncommunicable Disease Prediction. Int J Environ Res Public Health. 17 6513
[12]. Farrokh Habibzadeh, Parham Habibzadeh, and Mahboobeh Yadollahie 2016 On determining the most appropriate test cut-off value: the case of tests with continuous results. Biochem Med (Zagreb). 26 297–307