


1. Introduction
Social media has now become an indispensable medium for information dissemination on the Internet. Weibo, one of the earliest and most popular UGC platforms in the Chinese Internet landscape, has played a significant role. The widespread popularity of Weibo has not only led to an explosive growth of information but also brought about significant changes in the way Internet information is disseminated. It has achieved a highly integrated connection between individuals and information, allowing a single piece of information to rapidly reach millions of people.[1]
Weibo's trending search list, as one of the most mainstream hot event rankings in the country, possesses four prominent characteristics: timeliness, social relevance, wide coverage, and succinct text. By presenting concise yet impactful topic events in real-time, it provides a swift avenue for the dissemination of trending information, holding substantial societal and commercial value. The ranking of trending topics based on metrics like page views, comments, and shares directly reveals Weibo users' browsing preferences and areas of interest.
"Hotness" quantifies the level of attention a trending topic receives and stands as a core indicator of its popularity. Predicting this hotness is a crucial task in the current digital era for content creators and social media analysts.[2] Studying the factors that influence the popularity of trends and forecasting the hotness of content with specific attributes can help decision-makers better understand audience preferences and trends, leading to improved marketing strategies and sentiment analysis methods.
Simultaneously, Weibo's trending keywords themselves, as short texts lacking specific themes and with variable structures, hold academic value through information mining. This also allows members of this group to grasp the related course content through practical application.
Therefore, this project focuses on Weibo's trending search list. Through data analysis and feature extraction from the search list, a model for predicting the hotness of Weibo trends is constructed, aiming to generate value across economic, societal, and academic dimensions.
2. Dataset
This dataset was extracted from the zhaoyizhe.com Weibo Trending Search Engine, including about 360,000 pieces of data in total, from 2021-01-01 to 2023-07-31. And the following processing steps were applied to the dataset:
1) Five columns were selected for analysis: keyword name, hotness, date of entry, time on the list, and category.
2) Removing NA values.
3) Eliminating an outlier which will affect test results.
4) In order to streamline and consolidate the existing 114 categories, we eliminated the subcategories while retaining the primary ones. This ultimately resulted in 16 major categories: Society, Entertainment, Celebrities, Sports, Charity, Health, Education, Technology, Emotions, Business, Lifestyle, Culture, News, Gaming, Politics, and Others.
Table 1. Categories in the dataset
Categories | Frequency | |
1 | CP | 19 |
2 | IT技术 (Information Technology) | 11 |
3 | 财经 (Finance) | 6624 |
4 | 财经-保险 (Finance-Insurance) | 4 |
5 | 财经-产业公司 (Finance-Industrial companies) | 699 |
6 | 财经-宏观经济 (Finance-Macroeconomics) | 144 |
7 | 财经-基金 (Finance-Funds) | 18 |
8 | 财经-金融市场 (Finance-Financial Markets) | 79 |
9 | 财经-理财资讯 (Finance-Financial Information) | 31 |
10 | 财经-其他 (Finance-Others) | 543 |
(a) Initial categories
Categories | Frequency | |
1 | Business | 535 |
2 | Celebrities | 54967 |
3 | Charity | 1477 |
4 | Culture | 434 |
5 | Education | 3495 |
6 | Emotion | 4500 |
7 | Entertainment | 63581 |
8 | Gaming | 18781 |
9 | Health | 961 |
10 | Lifestyle | 7570 |
11 | News | 15051 |
12 | Others | 2248 |
13 | Politics | 1632 |
14 | Society | 112794 |
15 | Sports | 21160 |
16 | Technology | 6278 |
(b) processed categories
Table 1(a) shows the original categories in the dataset. After implementing these steps, as shown in Table 1(b) a comprehensive and usable dataset was obtained, ready for further data analysis tasks.
3. Descriptive Statistics and Correlation Analysis
3.1. Descriptive Statistics
Descriptive statistics can help us gain a visual understanding of the fundamental characteristics and distribution patterns within a dataset, preparing us for subsequent analyses.
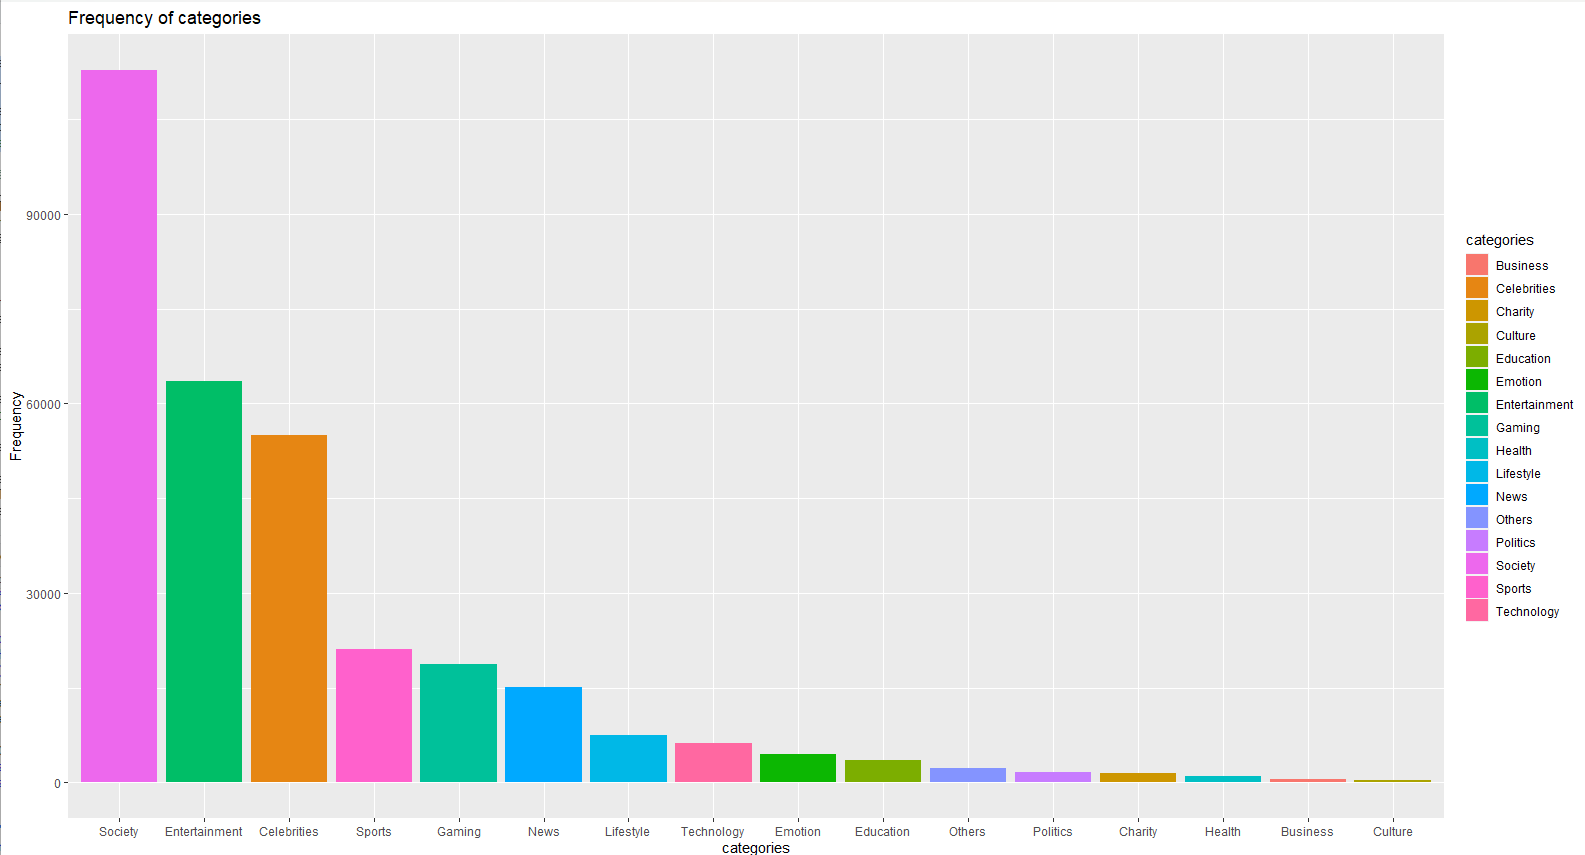
Figure 1. Frequency of categories
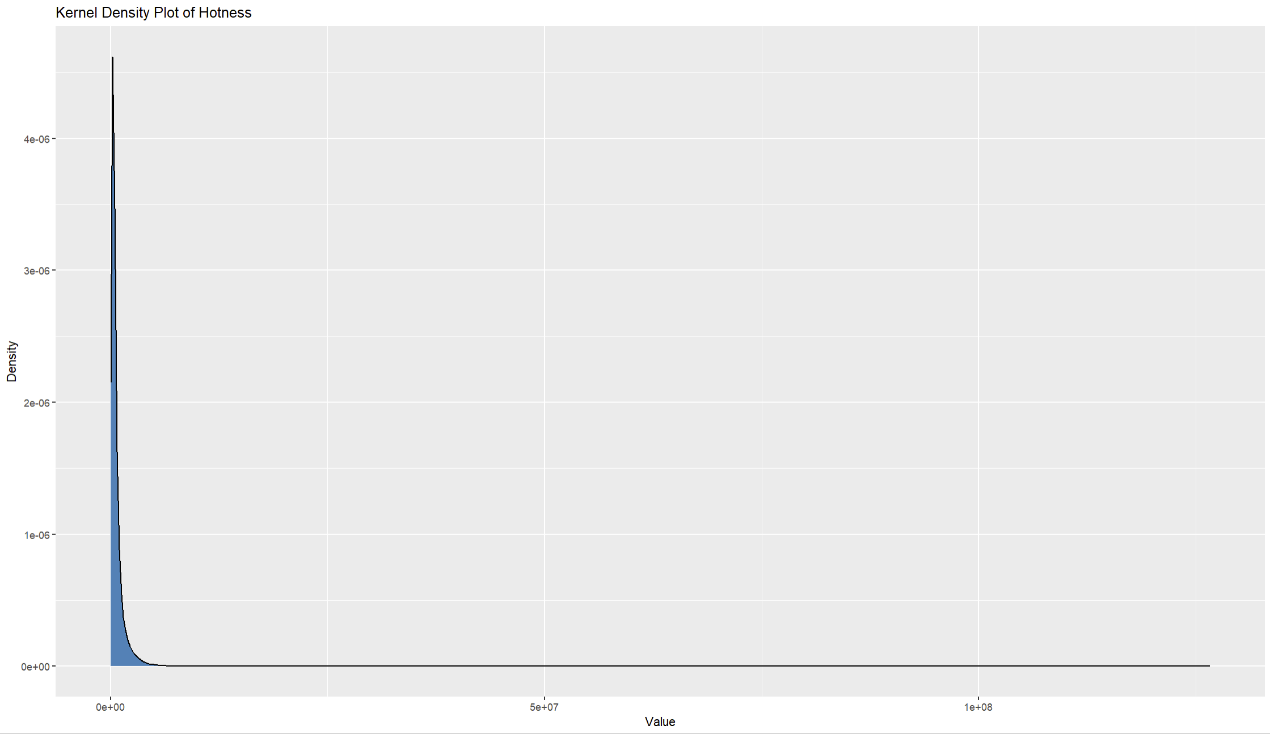
Figure 2. Distribution of Hotness
Table 2. Summary of hotness
Features | Hotness |
Min. | 180 |
1st Quartile | 220223 |
Median | 369509 |
Mean | 672619 |
3rd Quartile | 717640 |
Max. | 126621170 |
Figure 1 provided us with a general view about the distributions of different categories in the dataset. It can be easily found that topics people pay much attention to are about social problems and entertainments, including entertainment news, celebrities, and sports. Based on the Table 2 and Figure 2 above, we can observe that the distribution of hotness values is highly uneven, with some extremely high values present and most of the hotness values relatively low. This should draw our attention in subsequent analyses.
3.2. Correlation analysis
Correlation is a statistical technique used to measure the strength and direction of the linear relationship between two or more variables. It helps to understand how changes in one variable are associated with changes in another variable.[3] It provides insights into the extent to which variables move together and whether they exhibit a positive, negative, or no relationship. In this study, conducting correlation analysis between various variables in the dataset and the "hotness" factor allows us to visually discern which factors are related to the popularity of Weibo keywords. This analysis lays the foundation for subsequent modeling and prediction tasks, enabling us to identify the factors that significantly influence the hotness of Weibo keywords.
To better describe the dataset and extract features, I have constructed several metrics to characterize the attributes of the entries, including word count and sentiment index.
3.2.1. Categories and hotness
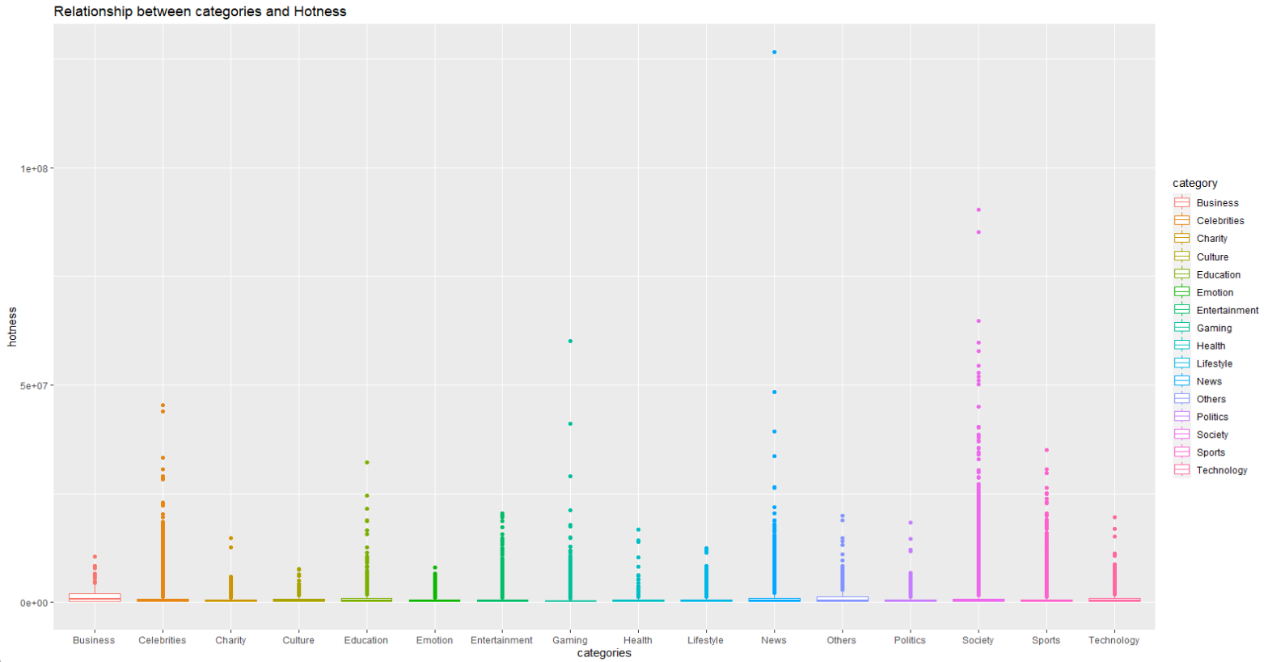
Figure 3. Relationship between categories and hotness
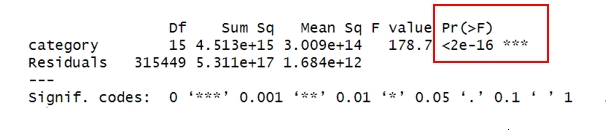
Figure 4. ANOVA between categories and hotness
After treating category as a factor variable, the results of the analysis of variance (ANOVA) [4], as shown in Figure 4, indicate a strong correlation between the category and the hotness values.
3.2.2. Word count and hotness
To transform the trending topics' titles into numerical variables for analysis, we created a word count column in Table 3. We observed whether there is a correlation between the word count of trending topics and their hotness values.
Table 3. Dataset with word count
category | title | date | hotness | time | wordcount | |
1 | Celebrities | 谢娜怀二胎 (Xie Na is expecting her second child.) | 2021-01-01 | 3469652 | 203 | 5 |
2 | Society | 上海通报一英国输入病例病毒基因序列 (Shanghai reports the virus gene sequence of a UK-imported case.) | 2021-01-01 | 3396691 | 69 | 17 |
3 | Others | 开箱2021第一缕阳光 (Unboxing the first sunlight of 2021.) | 2021-01-01 | 3365924 | 42 | 11 |
4 | Celebrities | 杜淳结婚 (Du Chun gets married.) | 2021-01-01 | 3362505 | 167 | 4 |
5 | Gaming | 和平精英代言人新年物资 (Peace Elite's spokesperson for New Year supplies.) | 2021-01-01 | 3159712 | 28 | 11 |
6 | Entertainment | 湖南卫视跨年收视第一 (Hunan TV's New Year's Eve show tops the ratings.) | 2021-01-01 | 3159422 | 74 | 10 |
7 | Entertainment | 明星大侦探 (Celebrity Detective.) | 2021-01-01 | 3083230 | 49 | 5 |
8 | Society | 华为全面下架腾讯游戏 (Huawei completely removes Tencent games.) | 2021-01-01 | 3007418 | 379 | 10 |
9 | Society | 婚姻法继承法合同法等 废止 (Marriage Law, Inheritance Law, Contract Law, etc., abolished.) | 2021-01-01 | 2988874 | 364 | 12 |
10 | Celebrities | 孙艺珍发文认爱 (Sun Yi Zhen posts a message confirming love.) | 2021-01-01 | 2942368 | 34 | 7 |
However, by calculating the correlation coefficient between word count and hotness, it was found to be 0.077, indicating that there is no significant correlation between the two. In response to this, we proceeded to construct a word count level, as shown in Table 5, converting word count into a categorical variable for ANOVA analysis. Table 4 indicates the division rules in this case.
Table 4. The conversion rules from "word count" to "word count level"
Word count | Word count level (levelnchar) |
1-4 | 1 |
5-8 | 2 |
9-12 | 3 |
13-16 | 4 |
>16 | 5 |
Table 5. Dataset with levelnchar
category | title | date | hotness | time | Word- count | levelnchar | |
1 | Celebrities | 谢娜怀二胎 (Xie Na is expecting her second child.) | 2021-01-01 | 3469652 | 203 | 5 | 2 |
2 | Society | 上海通报一英国输入病例病毒基因序列 (Shanghai reports the virus gene sequence of a UK-imported case.) | 2021-01-01 | 3396691 | 69 | 17 | 5 |
3 | Others | 开箱2021第一缕阳光 (Unboxing the first sunlight of 2021.) | 2021-01-01 | 3365924 | 42 | 11 | 3 |
4 | Celebrities | 杜淳结婚 (Du Chun gets married.) | 2021-01-01 | 3362505 | 167 | 4 | 1 |
5 | Gaming | 和平精英代言人新年物资 (Peace Elite's spokesperson for New Year supplies.) | 2021-01-01 | 3159712 | 28 | 11 | 3 |
6 | Entertainment | 湖南卫视跨年收视第一 (Hunan TV's New Year's Eve show tops the ratings.) | 2021-01-01 | 3159422 | 74 | 10 | 3 |
7 | Entertainment | 明星大侦探 (Celebrity Detective.) | 2021-01-01 | 3083230 | 49 | 5 | 2 |
8 | Society | 华为全面下架腾讯游戏 (Huawei completely removes Tencent games.) | 2021-01-01 | 3007418 | 379 | 10 | 3 |
9 | Society | 婚姻法继承法合同法等 废止 (Marriage Law, Inheritance Law, Contract Law, etc., abolished.) | 2021-01-01 | 2988874 | 364 | 12 | 3 |
10 | Celebrities | 孙艺珍发文认爱 (Sun Yi Zhen posts a message confirming love.) | 2021-01-01 | 2942368 | 34 | 7 | 2 |
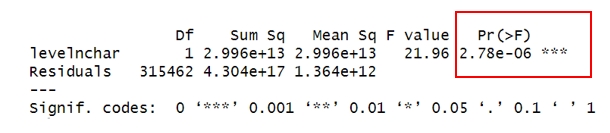
Figure 5. ANOVA between levelnchar and hotness
After the level conversion, it appears in Figure 5 that the "levelnchar" indicator is significantly correlated with "hotness", with the p-value less than 0.05. This suggests that there is a meaningful relationship between the word count levels and the hotness values.
3.2.3. Sentiment index and hotness
"SnowNLP" [5] is a Python package designed for natural language processing (NLP) tasks, with a specific focus on the Chinese language. It provides a range of tools and functionalities for text analysis, including tokenization, part-of-speech tagging, sentiment analysis, and text summarization. With its easy-to-use API and robust features, SnowNLP is a valuable resource for researchers, developers, and data scientists seeking to work with Chinese text data for various applications, from sentiment analysis in social media to automated text summarization in news articles [6]. In this study, sentiment labeling of trending topics' titles is carried out using SnowNLP, allowing for the creation of more multifaceted features for the trending topics. The study has imported the dataset into Python, performed sentiment analysis using SnowNLP, and then wrote the output results to R for further analysis.
In SnowNLP, the output results are numerical values ranging from 0 to 1, where values closer to 0 indicate more negative sentiment, values closer to 1 represent more positive sentiment, and 0.5 signifies neutral sentiment. To facilitate statistical analysis and comprehension, the project shift the entire range 0.5 units to the left, so that 0 represents neutral sentiment, and the absolute value indicates the extremeness of the sentiment, with larger values indicating more extreme sentiment. The results is shown below in Figure 6.
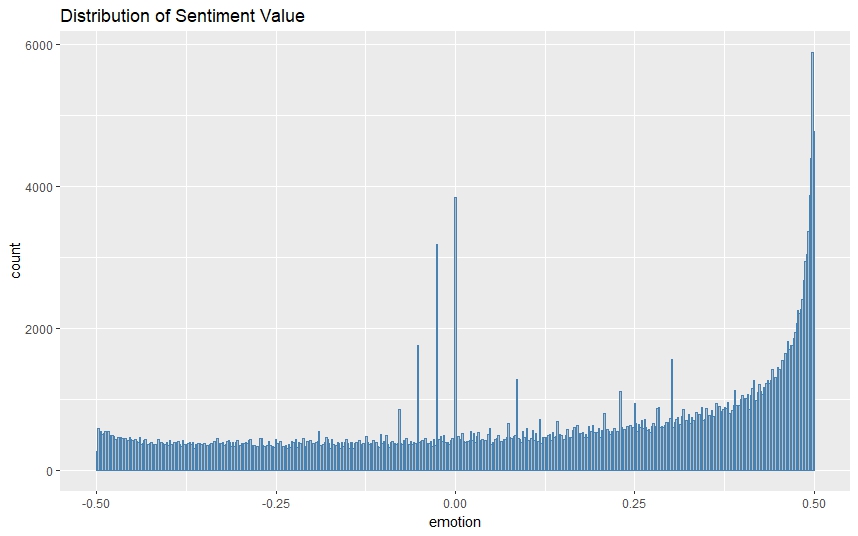
Figure 6. Distribution of sentiment level
Calculating the correlation coefficient between the sentiment value and hotness yielded a result of -0.03, indicating that there is no significant correlation between the two. Continuing with the sentiment value categorization (levelemotion), the project classifies them as follows:
Absolute values less than 0.15: "Weak";
Absolute values greater than 0.35: "Strong";
All other values: "Medium".
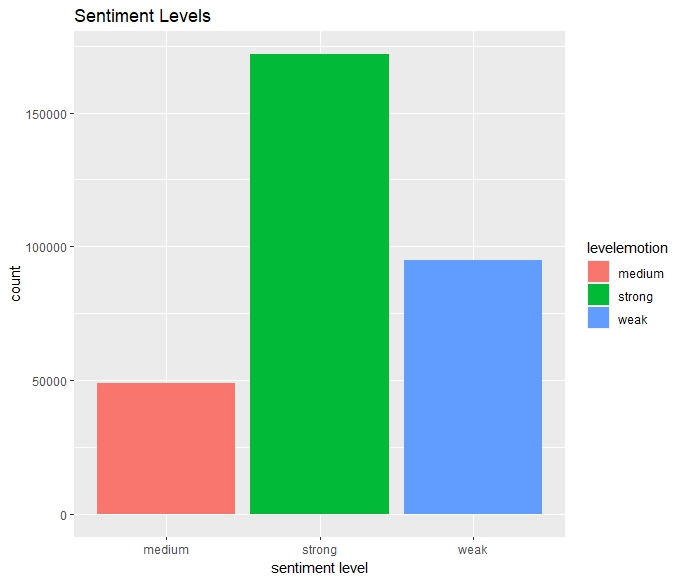
Figure 7. Sentiment levels
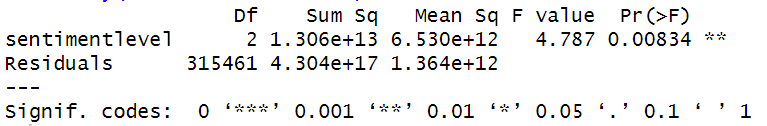
Figure 8. ANOVA results of sentimentlevel and hotness
Building upon this categorization, conducting an analysis of variance (ANOVA) reveals a result in Figure 8, where the p-value is less than 0.05, indicating a statistically significant correlation between the two variables. However, it's essential to note that sentiment analysis is not always entirely accurate, and the results can be influenced by factors such as text context and expression.
3.2.4. Time on the list and hotness
Calculating the correlation coefficient between "time" and "hotness" yields a value of 0.495, indicating a positive correlation between the two variables.
4. Modeling and Prediction
4.1. Feedforward Neural Network
A feedforward neural network, often simply referred to as a feedforward neural network or a multilayer perceptron (MLP) [7], is a fundamental type of artificial neural network used in various machine learning and deep learning tasks. It is characterized by the absence of feedback connections, meaning the data flows only in one direction, from input to output layers, without loops or recurrent connections.
In machine learning, it's common to divide a dataset into training and validation sets to assess the model's performance on new data. [8] When the error on the validation set surpasses that on the training set, it might suggest that the model is experiencing overfitting. Overfitting occurs when the model becomes too tailored to the training data and doesn't generalize well to new data, leading to poorer performance on unseen data.
In the previous correlation analysis, it has been demonstrated that the time on the list, category, word count level and sentiment level are significantly correlated with hotness. In the subsequent neural network model, these indicators, along with the original word count and sentiment, will be used as features for training.
4.2. Modeling
In this study, the "hotness" labels have been divided into three levels: low, medium, and high for modeling and prediction purposes. This is because in practical scenarios, accurately predicting the exact "hotness" value is meaningless; rather, it suffices to know whether a term will achieve high (medium, low) "hotness". Given certain characteristics of the "hotness" column, such as a significantly right-skewed distribution, the lowest 20% of the data is categorized as “low”, data exceeding the mean value is categorized as “high”, and the rest falls into the “medium” category.
In the model, one-hot encoding is applied to the "hotness" categories and used for prediction. The input variables are normalized during preprocessing. While constructing the neural network, batch normalization is incorporated after the input layer and hidden layers to enhance model performance. Since the prediction results are categorical variables, categorical cross-entropy is employed as the loss function, and accuracy serves as the evaluation metric. It can be observed that the accuracy during model training reaches 0.61.
After applying the model to make predictions on the data, a confusion matrix is constructed to observe the results as the following Figure 9.
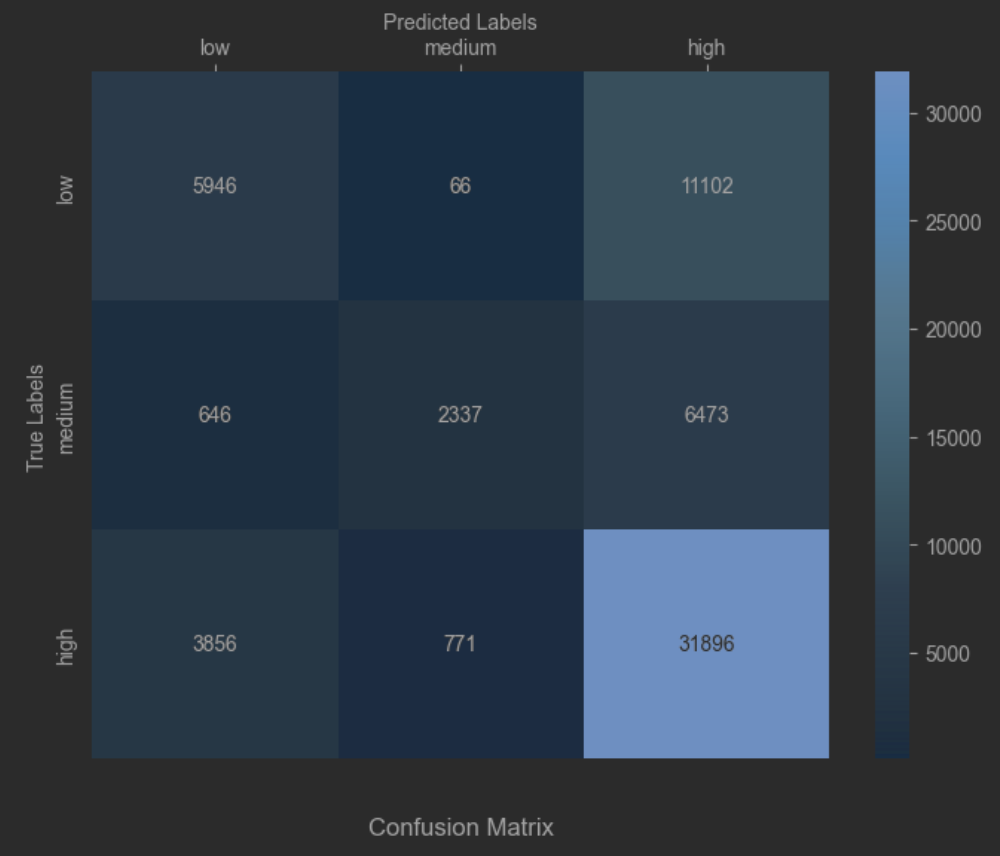
Figure 9. Confusion matrix of the prediction
In the prediction results, we can observe that the overall accuracy is around 65%. Specifically, predictions for high hotness are more accurate, achieving an accuracy of 87%, while predictions for medium and low hotness are relatively weaker. However, in practical applications, it has been noted that terms with high hotness are more valuable to the social platform.
4.3. Model Evaluation
In this model, the model's performance does not appear to be exceptionally strong, and there could be several potential reasons for this. The choice of model hyperparameters may not be optimal. The input data, including categories, time on the list, word count, word count level, sentiment scores, and sentiment levels, may not be well-suited for the task. Meanwhile, considering about the way in which the hotness labels are divided or categorized in the data may not be appropriate enough. Moreover, the right-skewed distribution of the hotness labels in the data may be affecting the model's learning performance.
However, despite these challenges, the model still achieves an accuracy of over 60% in many real-world problems, and an around 80% accuracy for high hotness topics, suggesting that the model is considered usable.
5. Conclusion and future work
In summary, this study constructs features of Weibo trending keywords from multiple dimensions and predicts the popularity of these trending keywords by creating new indicators (such as word count level and sentiment level) through a neural network model, achieving good results.
In future research, further optimization of this model can be conducted to ensure its strong performance even for keywords with lower hotness value. With a solid model, it becomes possible to predict the popularity of keywords with certain characteristics, facilitating more accurate promotion for social platforms and businesses, thereby maximizing their potential for communication and commercial value.
References
[1]. Xialing Lin, Kenneth A. Lachlan, Patric R. Spence, Exploring extreme events on social media: A comparison of user reposting/retweeting behaviors on Twitter and Weibo, Computers in Human Behavior, Volume 65, 2016, Pages 576-581, ISSN 0747-5632, https://doi.org/10.1016/j.chb.2016.04.032.
[2]. Q. Wang, "Predicting Chinese Stock Market with Internet Key Word Hotness by Statistical Time Series Regression Analysis," 2021 International Conference on Computer, Blockchain and Financial Development (CBFD), Nanjing, China, 2021, pp. 286-291, doi: 10.1109/CBFD52659.2021.00064.
[3]. K.R. Godfrey, Correlation methods, Automatica, Volume 16, Issue 5, 1980, Pages 527-534, ISSN 0005-1098, https://doi.org/10.1016/0005-1098(80)90076-X.
[4]. Lars St»hle, Svante Wold, Analysis of variance (ANOVA), Chemometrics and Intelligent Laboratory Systems, Volume 6, Issue 4, 1989, Pages 259-272, ISSN 0169-7439, https://doi.org/10.1016/0169-7439(89)80095-4.
[5]. Wang Rui, Lu Wei, Zeng Liangju, Santiago Castro, SnowNLP: Simplified Chinese Text Processing(2013), https://github.com/isnowfy/snownlp
[6]. Wan, Jiangping; Liu, Xu; Zuo, Yihang; and Luo, Jianfeng, "Analysis on Public Opinion Sentiment Evolution of COVID-19 Based on Weibo Data" (2021). WHICEB 2021 Proceedings. 67. https://aisel.aisnet.org/whiceb2021/67
[7]. Scikit-learn: Machine Learning in Python, Pedregosa et al., JMLR 12, pp. 2825-2830, 2011.
[8]. Badillo, S., Banfai, B., Birzele, F., Davydov, I.I., Hutchinson, L., Kam-Thong, T., Siebourg-Polster, J., Steiert, B. and Zhang, J.D. (2020), An Introduction to Machine Learning. Clin. Pharmacol. Ther., 107: 871-885. https://doi.org/10.1002/cpt.1796
Cite this article
Chen,Y. (2024). Analysis and prediction of factors influencing the hotness of Weibo trending keywords. Applied and Computational Engineering,55,110-119.
Data availability
The datasets used and/or analyzed during the current study will be available from the authors upon reasonable request.
Disclaimer/Publisher's Note
The statements, opinions and data contained in all publications are solely those of the individual author(s) and contributor(s) and not of EWA Publishing and/or the editor(s). EWA Publishing and/or the editor(s) disclaim responsibility for any injury to people or property resulting from any ideas, methods, instructions or products referred to in the content.
About volume
Volume title: Proceedings of the 4th International Conference on Signal Processing and Machine Learning
© 2024 by the author(s). Licensee EWA Publishing, Oxford, UK. This article is an open access article distributed under the terms and
conditions of the Creative Commons Attribution (CC BY) license. Authors who
publish this series agree to the following terms:
1. Authors retain copyright and grant the series right of first publication with the work simultaneously licensed under a Creative Commons
Attribution License that allows others to share the work with an acknowledgment of the work's authorship and initial publication in this
series.
2. Authors are able to enter into separate, additional contractual arrangements for the non-exclusive distribution of the series's published
version of the work (e.g., post it to an institutional repository or publish it in a book), with an acknowledgment of its initial
publication in this series.
3. Authors are permitted and encouraged to post their work online (e.g., in institutional repositories or on their website) prior to and
during the submission process, as it can lead to productive exchanges, as well as earlier and greater citation of published work (See
Open access policy for details).
References
[1]. Xialing Lin, Kenneth A. Lachlan, Patric R. Spence, Exploring extreme events on social media: A comparison of user reposting/retweeting behaviors on Twitter and Weibo, Computers in Human Behavior, Volume 65, 2016, Pages 576-581, ISSN 0747-5632, https://doi.org/10.1016/j.chb.2016.04.032.
[2]. Q. Wang, "Predicting Chinese Stock Market with Internet Key Word Hotness by Statistical Time Series Regression Analysis," 2021 International Conference on Computer, Blockchain and Financial Development (CBFD), Nanjing, China, 2021, pp. 286-291, doi: 10.1109/CBFD52659.2021.00064.
[3]. K.R. Godfrey, Correlation methods, Automatica, Volume 16, Issue 5, 1980, Pages 527-534, ISSN 0005-1098, https://doi.org/10.1016/0005-1098(80)90076-X.
[4]. Lars St»hle, Svante Wold, Analysis of variance (ANOVA), Chemometrics and Intelligent Laboratory Systems, Volume 6, Issue 4, 1989, Pages 259-272, ISSN 0169-7439, https://doi.org/10.1016/0169-7439(89)80095-4.
[5]. Wang Rui, Lu Wei, Zeng Liangju, Santiago Castro, SnowNLP: Simplified Chinese Text Processing(2013), https://github.com/isnowfy/snownlp
[6]. Wan, Jiangping; Liu, Xu; Zuo, Yihang; and Luo, Jianfeng, "Analysis on Public Opinion Sentiment Evolution of COVID-19 Based on Weibo Data" (2021). WHICEB 2021 Proceedings. 67. https://aisel.aisnet.org/whiceb2021/67
[7]. Scikit-learn: Machine Learning in Python, Pedregosa et al., JMLR 12, pp. 2825-2830, 2011.
[8]. Badillo, S., Banfai, B., Birzele, F., Davydov, I.I., Hutchinson, L., Kam-Thong, T., Siebourg-Polster, J., Steiert, B. and Zhang, J.D. (2020), An Introduction to Machine Learning. Clin. Pharmacol. Ther., 107: 871-885. https://doi.org/10.1002/cpt.1796