


1. Introduction
The predictability of security prices and earnings has long been the focus of financial analysis and investors. According to efficient market theory, asset price movements and returns are rational, and there are no arbitrage opportunities in a sufficiently efficient market. In 1970, Fama proposed in its efficient market hypothesis: “In an efficient market, asset prices fully reflect all market information. By assessing the efficiency of the market’s use of information, Fama divides the effectiveness of the securities market into three levels: weak efficient market, semi-strong efficient market, and strong efficient market [1]. In a weakly efficient market, stock prices only reflect all historical price information, investors cannot obtain excess returns by analyzing historical and current trading data, and stock price movements conform to the “random walk” model. In a semi-strong efficient market, stock prices reflect all publicly available information, such as company announcements and annual and quarterly reports over the years, and investors are likewise unable to derive excess returns from historical and publicly available information. In the case of a strong efficient market, it means that the stock price has been incorporated into all public and non-public information [2].
High-frequency trading is an innovative trading method, which was widely used in the United States at the earliest due to the relatively complete market system in the United States. In the U.S. stock market, the same stock can be listed and traded on multiple exchanges, and due to the existence of the market maker system, high-frequency trading was initially achieved by discovering market spreads and trading using instantaneous spreads to obtain excess returns. High-frequency trading is the product of the combination of modern programmatic trading and market maker mechanisms [3]. Compared with low-frequency trading, high-frequency trading uses cutting-edge computer technology to collect trading data of different frequencies in the market and analyze market price change patterns, so as to achieve high-speed turnover trading. Due to the extremely short duration of the spread in high-frequency data, the study of high-frequency trading has paid special attention to the execution performance of computer hardware equipment and the efficiency of program processing from the very beginning, and efficient information collection and processing are the core advantages of this trading method [4].
By sorting out the development path of high-frequency trading, we find that high-frequency trading has been around for a long time, and its development is closely related to the continuous progress and evolution of the market’s pursuit of profits. High-frequency trading is the product of further refined development on the basis of quantitative traditional trading methods [5]. In the context of existing market trading, there is no consensus on the specific concept of high-frequency trading in the academic community. Some scholars believe that high-frequency trading is algorithmic trading, while others believe that high-frequency trading is technical trading and should be classified as quantitative investment.
Since technical analysis relies on human calculations and comparisons with historical information to speculate on the most likely outcome, the computational and reasoning methods employed are critical. Traditional empirical research mainly uses models based on linear time series and econometric models derived from financial theory, which are usually tested based on linear assumptions, and it is difficult to capture the nonlinear characteristics of stock price changes [6]. In fact, the securities market is affected by a variety of factors such as economic, political and even psychological, and exhibits significant nonlinear characteristics, which makes the conclusions based on the linear test have certain limitations. Recent studies have shown that the stock market is a nonlinear dynamic system with a large amount of information, and its power spectrum shows broadband and continuous characteristics. Because the traditional linear forecasting method cannot effectively distinguish the power spectrum of the stock market signal from the noise, its prediction effect is often unsatisfactory. With the development of financial theories, econometric and statistical tools, and the continuous innovation of information technology and optimization algorithms, securities analysis methods are also constantly improving [7]. Modern technologies such as neural networks and genetic algorithms have been widely introduced into the field of securities analysis, which has greatly enriched and deepened the research and application of securities analysis.
Scholars have conducted extensive research on the use of technical analysis in the stock market, ranging from the selection of technical analysis indicators to quantitative methods that combine technical analysis with machine learning. These methods include commonly used moving average analysis, indicators such as MACD, and machine learning techniques such as support vector machines, decision trees, and neural networks. Given the short-term timeliness and high frequency of technical analysis, especially in trend analysis strategies, combined with the high shareholding ratio of individual investors, these factors often lead to overreaction of the market to short-term trends [8]. To this end, this paper uses the minute-level high-frequency data of China’s Shanghai and Shenzhen A-shares, and uses the ensemble algorithm Adaboost to optimize the neural network. By combining minute-level technical indicators and fundamental analysis, this study provides quantitative analysis and practical testing of trading strategies, aiming to provide practical advice and recommendations for equity investors, especially institutional investors.
After setting up a stock investment strategy, we need to consider the timeliness of fundamental and technical indicators. Fundamental analysis is based on the company’s announcements over the years, including annual and quarterly reports, to assess the company’s long-term trends and potential growth potential. In contrast, technical analysis focuses on the immediate effects of stock trading. It starts from daily trading data or even minute-level trading data, although traditional research mostly relies on daily trading data, which may be different from the judgment and logic of investors’ daily trading. Therefore, on the basis of referring to daily trading data, this paper also combines the performance of technical analysis in minute trading data, and optimizes trading strategies by applying deep learning methods, in order to improve the adaptability and effectiveness of strategies.
2. Related Work
Elżbieta Kubińska [9] believes that the technical analysis investment method is particularly effective for novice investors and traders in the futures market. For novice investors, they tend to rely more on personal experience and intuition when making investment decisions; For futures traders, they are susceptible to emotions when developing an investment strategy. From the perspective of the effectiveness of technical analysis, Sibanjan Mishra [10] proved that technical analysis can effectively predict the excess return in the securities market by studying volatility indicators, trend indicators, momentum indicators and sentiment indicators. He argues that effective technical analysis indicators can explain market risk compensation, and that a reasonable technical analysis portfolio is generally more profitable than fundamental analysis.
From the perspective of market efficiency, David M. Smith [11] discussed the possibility of technical analysis (TA) to obtain excess returns by comparing the investment performance of hedge fund managers during the period of high market sentiment and the period of low market sentiment, and found that the mispricing phenomenon is more serious during the period of high market sentiment than during the period of low market, and technical analysis is more effective at this time. Vismaya G. [12] further analyzed the technical analysis indicators, pointing out that although technical analysis can obtain certain excess returns in existing trading strategies, a single technical analysis indicator (ITAI) is not enough to comprehensively guide the investment strategy, and the effective combination of different technical analysis indicators should be considered.
Based on trading data in Asian markets (including Indonesia, Malaysia, Taiwan and Thailand) between 1995 and 2015, Bader S. Alhashel [13] uses four technical analysis (FTA) trend analysis methods to obtain alpha and compares them to buy-and-hold strategies to evaluate the effectiveness of technical analysis. Although the empirical results show some instability, they still provide insights for the application of technical analysis. At the same time, Hamidouche M’hamed [14] uses technical analysis trend analysis to identify short-term trend reversals in the stock market based on technical indicators and formulate investment strategies accordingly. These studies demonstrate the potential value of technical analysis in predicting market movements and developing investment strategies.
3. Methodologies
In this section, we employ a dual deep Q network to optimize a high-frequency trading strategy. Dual deep Q network is an improved model based on the standard Deep Q Network, which aims to solve the problem of overestimation, thereby improving the stability and performance of the policy.
3.1. Deep Q Network
In the Deep Q Network (DQN) framework, we define an action-value function \( Q(s,a) \) that estimates the future cumulative reward that can be obtained after performing action \( a \) in a given state \( s \) . The core goal is to discover a strategy \( π \) that maximizes the \( Q(∙) \) function, the detail calculation is expressed as following Equation 1.
\( π(s)=arg\underset{a}{max}{Q(s,a)}\ \ \ (1) \)
Note that, Equation 1 indicates that for each state \( s \) , strategy \( π \) chooses action a that maximizes the \( Q \) value.
Deep Q Network uses a neural network to approximate the \( Q \) function, and the parameters of the network are denoted \( θ \) . During training, we update the network parameters by minimizing the following mean square error loss function, which is expressed as Equation 2.
\( L(θ)=Ε{[(y-Q(s,a;θ))^{2}}]\ \ \ (2) \)
From above Equation 2, we observe that \( y \) is the target \( Q \) value, which is calculated as following Equation 3.
\( y=r+γ\underset{a \prime }{max}{Q(s \prime ,a \prime ;θ)}\ \ \ (3) \)
Where \( r \) is the instant reward received. \( s \prime \) is the next state observed after action \( a \) is performed. \( γ \) is a discount factor, usually in the range of 0 and 1, to indicate the importance of future rewards relative to immediate rewards.
At each training step, the DQN is updated by sampling one or more empirical tuples \( (s,a,r,s \prime ) \) from the empirical replay buffer (a data structure that stores prior experience). Using these experiences, the network uses gradient descent to gradually approximate the optimal \( Q \) function. Specifically, the parameter update formula can be expressed as Equation 4.
\( θ←θ-α{∇_{θ}}L(θ)\ \ \ (4) \)
Where \( α \) is the learning rate, which controls the step size at which the parameter is updated. \( {∇_{θ}}L(θ) \) is the loss function \( L \) gradient with respect to the parameter \( θ \) .
Optimization Mechanism
The dual deep Q network solves some problems in the standard deep Q network by introducing two network evaluation networks and a target network, especially the problem of overestimation of value. Evaluate the network \( Q(s,a;θ) \) : This network is responsible for generating an estimate of the value of the action under the current strategy. Destination network \( Q(s,a;{θ^{-}}) \) : This network provides target values for stabilizing the learning process. The parameter \( {θ^{-}} \) of the target network is a lagged replication of the parameter θ of the evaluation network, which helps to reduce fluctuations during training. The way the target \( Q \) value is calculated has been improved to reduce over-optimism bias in any single estimate. The formula for updating the target value is expressed as Equation 5.
\( y=r+γQ({s^{ \prime }},arg\underset{{a^{ \prime }}}{max}{Q({s^{ \prime }},{a^{ \prime }};θ)};{θ^{-}})\ \ \ (5) \)
The key improvement here is that when calculating the maximum action value, the action selection is based on the evaluation network \( θ \) , while the calculation of the action value uses the target network \( {θ^{-}} \) . This approach effectively decouples the action selection (controlled by the evaluation network) from the calculation of the target value (controlled by the target network), thereby reducing the risk of overestimation.
With this improved approach, our proposed model is able to provide more stable and reliable learning performance in a variety of environments, especially when dealing with complex tasks that require highly accurate value estimation, such as high-frequency trading strategy optimization.
4. Experiments
4.1. Experimental Setups
This study uses the high-frequency trading data of Shenzhen 300480 Guangli Technology to explore the application of deep learning in high-frequency trading strategies. The experiment covers minute-level data from 2019 to 2021, including information such as price and volume. Through data cleaning, feature engineering, and normalization preprocessing, the dataset is divided into training, validation, and testing sets to train the model and optimize parameters. The performance of the model is evaluated by precision, recall, F1 score, and economic performance indicators such as the Sharpe ratio to verify the effectiveness of the model in predicting market movements and generating trading signals. The analysis of the results aims to evaluate the actual trading application potential and robustness of the model, and provide scientific decision support for high-frequency trading strategies.
4.2. Experimental Analysis
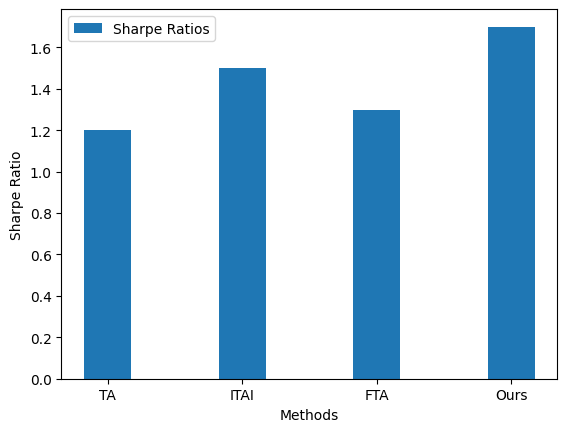
The Sharpe ratio is a measure of the risk-adjusted performance of a portfolio. It assesses the return per unit of risk by calculating the ratio of a portfolio’s excess return (i.e., portfolio return minus risk-free return) to its risk (standard deviation). A higher Sharpe ratio means that the portfolio is able to achieve a higher alpha per unit of risk, so it is widely used in investment management and asset allocation. However, one of its limitations is the assumption that the distribution of return on investment is normal, which may not always be true in the actual market, so it needs to be used in combination with other indicators for comprehensive analysis. Following Figure 1 shows the comparison of sharpe ratio by using optimization strategies.
|
Figure 1. Comparison of Sharpe Ratios by Method. |
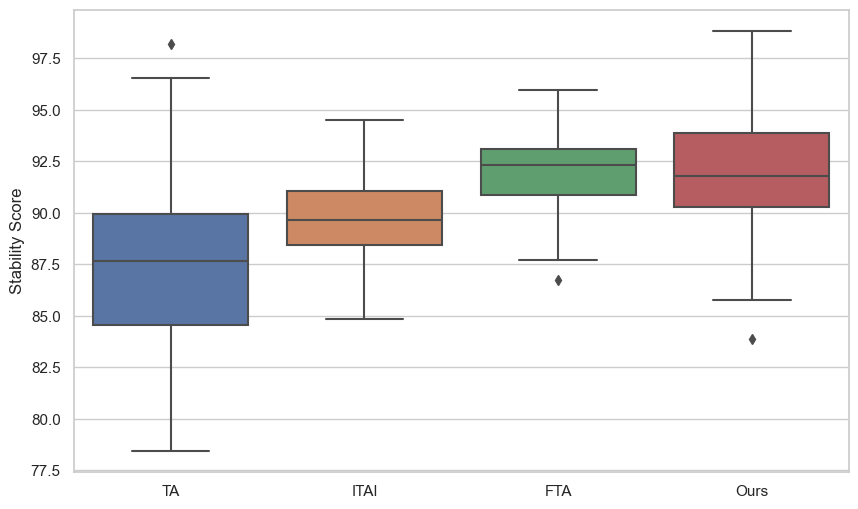
System stability refers to the ability of a trading system to operate continuously and trouble-free and effectively handle extreme market conditions in a high-frequency trading environment. This includes the system’s ability to handle high-speed data streams and large volumes of trading orders, as well as the ability to withstand stress when market volatility is extremely high. System stability is especially critical for high-frequency trading, as even a small delay or failure can lead to significant financial losses. Therefore, ensuring that the trading system has a high degree of reliability and quick response ability, and is able to operate stably in a variety of market conditions, is an important part of the success of high-frequency trading. Figure 2 shows the stability comparison results.
|
Figure 2. System Stability Comparison. |
5. Conclusion
In conclusion, our proposed model shows that the speed and accuracy of trading decisions can be significantly improved by in-depth analysis and processing of large amounts of high-frequency trading data. Our experimental results demonstrate that deep learning technology can effectively reveal non-linear patterns hidden in complex market data, thereby optimizing trading strategies, increasing profitability, and reducing risk. In addition, by applying a combination of different evaluation metrics, such as the Sharpe ratio and the maximum drawdown, we are able to comprehensively evaluate the performance and stability of the strategy. This shows that deep learning has great application potential and value in high-frequency trading, indicating the future trend of financial transaction automation and intelligence.
References
[1]. Zhang, Weipeng, et al. “TradeBot: Bandit learning for hyper-parameters optimization of high frequency trading strategy.” Pattern Recognition 124 (2022): 108490.
[2]. Qin, Molei, et al. “Earnhft: Efficient hierarchical reinforcement learning for high frequency trading.” Proceedings of the AAAI Conference on Artificial Intelligence. Vol. 38. No. 13. 2024.
[3]. Goldstein, Michael, Amy Kwan, and Richard Philip. “High-frequency trading strategies.” Management Science 69.8 (2023): 4413-4434.
[4]. Tao, Xuan, et al. “On detecting spoofing strategies in high-frequency trading.” Quantitative Finance 22.8 (2022): 1405-1425.
[5]. Cao, Xinwei, et al. “Neural networks for portfolio analysis in high-frequency trading.” IEEE Transactions on Neural Networks and Learning Systems (2023).
[6]. Yin, Tao, et al. “Graph-based stock correlation and prediction for high-frequency trading systems.” Pattern Recognition 122 (2022): 108209.
[7]. Kohda, Shigeki, and Kenichi Yoshida. “Characteristics and forecast of high-frequency trading.” Transactions of the Japanese Society for Artificial Intelligence 37.5 (2022): B-M44_1.
[8]. Deng, Shangkun, et al. “High-frequency direction forecasting and simulation trading of the crude oil futures using Ichimoku KinkoHyo and Fuzzy Rough Set.” Expert Systems with Applications 215 (2023): 119326.
[9]. Kubińska, Elżbieta, et al. “Technical analysis as a rational tool of decision making for professional traders.” Emerging Markets Finance and Trade 52.12 (2016): 2756-2771.
[10]. Mishra, Sibanjan. “Technical Analysis and Risk Premium in Indian Equity Market: A Multiple Regression Analysis.” IUP Journal of Applied Economics 15.1 (2016).
[11]. Smith, David M., et al. “Sentiment and the effectiveness of technical analysis: Evidence from the hedge fund industry.” Journal of Financial and Quantitative Analysis 51.6 (2016): 1991-2013.
[12]. Vismaya, G., and Jains P. Chacko. “Technical Analysis and Analysts Forecast: A Comparison.” Journal of IMS Group (2016): 24-35.
[13]. Alhashel, Bader S., Fahad W. Almudhaf, and J. Andrew Hansz. “Can technical analysis generate superior returns in securitized property markets? Evidence from East Asia markets.” Pacific-Basin Finance Journal 47 (2018): 92-108.
[14]. M’hamed, Hamidouche. “Determination the price of a share listed on the stock exchange.” The Business & Management Review 9.3 (2018): 73-82.
Cite this article
Tian,H. (2024). Research on high-frequency trading strategies optimization based on deep learning. Applied and Computational Engineering,86,23-29.
Data availability
The datasets used and/or analyzed during the current study will be available from the authors upon reasonable request.
Disclaimer/Publisher's Note
The statements, opinions and data contained in all publications are solely those of the individual author(s) and contributor(s) and not of EWA Publishing and/or the editor(s). EWA Publishing and/or the editor(s) disclaim responsibility for any injury to people or property resulting from any ideas, methods, instructions or products referred to in the content.
About volume
Volume title: Proceedings of the 6th International Conference on Computing and Data Science
© 2024 by the author(s). Licensee EWA Publishing, Oxford, UK. This article is an open access article distributed under the terms and
conditions of the Creative Commons Attribution (CC BY) license. Authors who
publish this series agree to the following terms:
1. Authors retain copyright and grant the series right of first publication with the work simultaneously licensed under a Creative Commons
Attribution License that allows others to share the work with an acknowledgment of the work's authorship and initial publication in this
series.
2. Authors are able to enter into separate, additional contractual arrangements for the non-exclusive distribution of the series's published
version of the work (e.g., post it to an institutional repository or publish it in a book), with an acknowledgment of its initial
publication in this series.
3. Authors are permitted and encouraged to post their work online (e.g., in institutional repositories or on their website) prior to and
during the submission process, as it can lead to productive exchanges, as well as earlier and greater citation of published work (See
Open access policy for details).
References
[1]. Zhang, Weipeng, et al. “TradeBot: Bandit learning for hyper-parameters optimization of high frequency trading strategy.” Pattern Recognition 124 (2022): 108490.
[2]. Qin, Molei, et al. “Earnhft: Efficient hierarchical reinforcement learning for high frequency trading.” Proceedings of the AAAI Conference on Artificial Intelligence. Vol. 38. No. 13. 2024.
[3]. Goldstein, Michael, Amy Kwan, and Richard Philip. “High-frequency trading strategies.” Management Science 69.8 (2023): 4413-4434.
[4]. Tao, Xuan, et al. “On detecting spoofing strategies in high-frequency trading.” Quantitative Finance 22.8 (2022): 1405-1425.
[5]. Cao, Xinwei, et al. “Neural networks for portfolio analysis in high-frequency trading.” IEEE Transactions on Neural Networks and Learning Systems (2023).
[6]. Yin, Tao, et al. “Graph-based stock correlation and prediction for high-frequency trading systems.” Pattern Recognition 122 (2022): 108209.
[7]. Kohda, Shigeki, and Kenichi Yoshida. “Characteristics and forecast of high-frequency trading.” Transactions of the Japanese Society for Artificial Intelligence 37.5 (2022): B-M44_1.
[8]. Deng, Shangkun, et al. “High-frequency direction forecasting and simulation trading of the crude oil futures using Ichimoku KinkoHyo and Fuzzy Rough Set.” Expert Systems with Applications 215 (2023): 119326.
[9]. Kubińska, Elżbieta, et al. “Technical analysis as a rational tool of decision making for professional traders.” Emerging Markets Finance and Trade 52.12 (2016): 2756-2771.
[10]. Mishra, Sibanjan. “Technical Analysis and Risk Premium in Indian Equity Market: A Multiple Regression Analysis.” IUP Journal of Applied Economics 15.1 (2016).
[11]. Smith, David M., et al. “Sentiment and the effectiveness of technical analysis: Evidence from the hedge fund industry.” Journal of Financial and Quantitative Analysis 51.6 (2016): 1991-2013.
[12]. Vismaya, G., and Jains P. Chacko. “Technical Analysis and Analysts Forecast: A Comparison.” Journal of IMS Group (2016): 24-35.
[13]. Alhashel, Bader S., Fahad W. Almudhaf, and J. Andrew Hansz. “Can technical analysis generate superior returns in securitized property markets? Evidence from East Asia markets.” Pacific-Basin Finance Journal 47 (2018): 92-108.
[14]. M’hamed, Hamidouche. “Determination the price of a share listed on the stock exchange.” The Business & Management Review 9.3 (2018): 73-82.