


1. Introduction
Aspect ratio determines the wing geometry, and the wing is the major part of the plane and it is responsible for generating enough lift that allow the plane to fly. Aspect ratio is important because it affects the performance of the airplane, showed by the experiment. Aspect ratio affects the maneuverability, lift-drag ratio and efficiency.[1] The increase in aspect ratio can increase the lift coefficient.[2] However, this is not always the case. There should be an optimal value that enables the plane to glide as far as it can. This research group conducted an experiment to find out the optimal value of the aspect ratio based on paper airplane. The result shows that higher aspect ratio does not always the best, rather, the optimal aspect ratio would be within a range of value.
We used an experiment to demonstrate the hypothesis that there is an optimal aspect ratio for rectangular wing aircraft. The experiment tests five different rectangular wing in various aspect ratio. The result yields a quadratic equation, and it shows that there is an optimal value of aspect ratio that enables the plane to glide smoothly. As the aspect ratio increases, the gliding distance increases; then after a specific aspect ratio, the gliding distance decreases.
1.1. The importance of aspect ratio
Aspect ratio is a worthy parameter for aeronautic engineers to explore. This concept is mostly used in the wings, and our topic is about the relationship between aspect ratio and descent rate of paper aircraft. Aspect ratio has the following functions in this research topic. First, the magnitude of aspect ratio have obvious influence on the flight performance of aircraft. As the aspect ratio increases, the induced drag of the wing decreases, thus increasing the manoeuvrability and speed of the aircraft, but the wave resistance increases. Secondly, the aspect ratio also affects the lift generated by the wing. If the wing area is the same, as long as the aircraft is not close to stall, the lift generated by the wing with a large aspect ratio is also large under the same conditions, thus reducing the take-off and landing slip distance of the aircraft and improving manoeuvrability. Therefore, designers need to find the most suitable aspect ratio.
Aspect ratio (AR) is defined as the slenderness or fineness ratio of the wing. It is calculated, for the planes used in the experiment, by the distance of the tip-to-tip wingspan l divided by the length of the chord w because the wings are rectangle in shape.[3]
\( AR=\frac{l}{w}\ \ \ (1) \)
The definition of wing area is the area of the wing projected on a horizontal datum. Including the part of the fuselage is called the wool wing area, otherwise called the exposed wing area. Wing area have several kinds of shape. According to different shape, there are different equations. But in this research, only rectangle geometry is considered. The area of the rectangle is
\( A=h*b\ \ \ (2) \)
where
A is the area of the wing
h is the chord length
b is the wingspan
Another critical parameter is descent rate. The definition of descent rate is the altitude at which aircraft descend per unit of time. Usually in meter per second or meter per minute.
1.2. The importance of descent rate
Geometrically, descent rate is defined by the decrease in altitude divided by the increase in range, and the angle between the change in horizontal and the vertical direction is the descent angle.[4]
\( tan{(θ)}=\frac{ΔR}{Δh}\ \ \ (3) \)
where
\( θ \) is the descent angle
\( Δh \) is the change in altitude
\( ΔR \) is the change in range (distance that the plane travelled forward)
The descent rate of a glider determines the range that the glider can reach. The smaller descent angle indicates that the glider can travel further. This result is easy to derive geometrically. If the descent angle is small, a little sacrifice in altitude allows the glider obtain longer range compared to those have big descent angle.
1.3. The benefit of small scale models (SSMs)
The experiment did not use real scale airplane. Rather, the experiment used small scale model by using paper-airplane. The benefits of small scale models (SSMs) is that SSMs makes the experiment become feasible because making a real scale airplane is difficult. The performance of the small scale model airplane in the experiment is geometrically identical to the performance of real scale airplane.[5] A paper model plane usually uses ten minutes to make, but the real model plane needs much more time.
Paper is a light material that minimizes the overall weight. The lighter air plane requires less lift to allow the plane fly, so that a small initial velocity is needed because the formula of lift states that
\( Y=\frac{1}{2}ρ{C_{L}}S{v^{2}}\ \ \ (4) \)
where
Y is the generated lift
\( ρ \) is the air density
\( {C_{L}} \) is the lift coefficient
\( S \) is the wing area
\( v \) is the speed of the aircraft
Moreover, the gravity of the plane is given by
\( {F_{g}}=mg\ \ \ (5) \)
where
\( {F_{g}} \) is the weight of the plane
\( m \) is the mass of plane
\( g \) is the gravitational constant, which is approximately 9.81m*s-2
Combine both Equation 4 and Equation 5, the speed of aircraft is
\( v=({\frac{2mg}{ρCS})^{\frac{1}{2}}}\ \ \ (6) \)
Therefore, if the mass of the model plane is smaller, the weight is smaller, thus requiring less launching speed (initial speed) because of the formula of lift.
2. Experiment
2.1. The setup of the experiment
In order to find out the relationship between aspect ratio and descent rate, an experiment is needed. In this experiment, the variable is aspect ratio, and the dependent variable is descent rate. The area of the wing are fixed so that the lift generated by the wing is constant. Therefore, the product of the length of chord and is the wingspan is constant. The table below shows 6 wing designs that this experiment used.
Table 1. Selection of different chord length and wingspan
# Design | Chord length (cm) | Wingspan (cm) | Wing area (cm2) | Aspect ratio (-) |
1 | 3.00 | 22.05 | 66.15 | 7.35 |
2 | 3.50 | 18.90 | 66.15 | 5.40 |
3 | 4.00 | 16.54 | 66.15 | 4.135 |
4 | 4.50 | 14.70 | 66.15 | 3.27 |
5 | 5.00 | 13.23 | 66.15 | 2.47 |
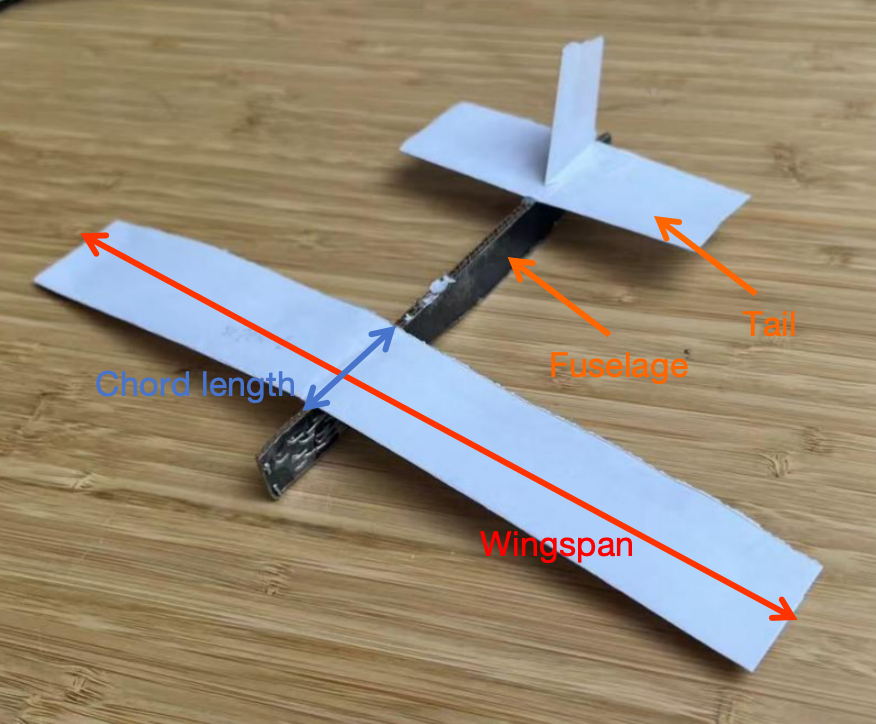
Figure 1. The testing airplane in wing respect ratio 7.35
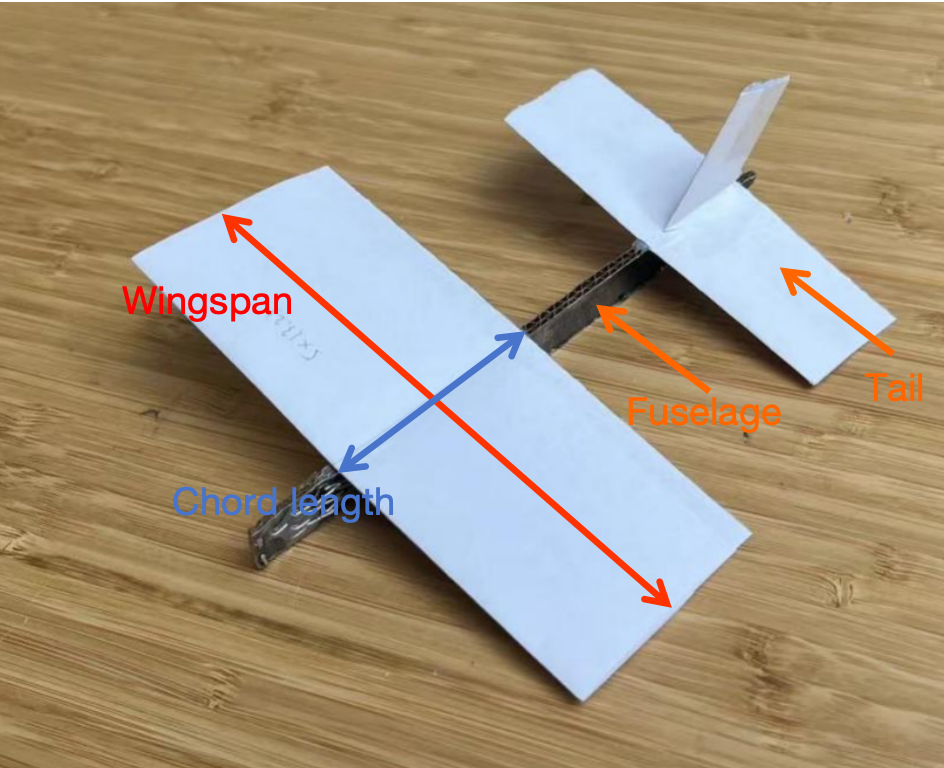
Figure 2. The testing airplane in wing respect ratio 2.47
The initial speed releasing the plane should be all the same for all trial of experiment. To satisfy this requirement, the model planes will be released by a rubber band with same extension in a fixed height above the ground. Assuming that the air resistance is negligible, the takeoff speed of the plane can be calculated using the Equation (7) law of conservation in mechanical energy
\( Potential Energy PE+Kinetic Energy KE=0\ \ \ (7) \)
\( -\frac{1}{2}k{(Δx)^{2}}+\frac{1}{2}m{v^{2}}=0\ \ \ (8) \)
that is
\( v=Δx{(\frac{k}{m})^{\frac{1}{2}}}\ \ \ (9) \)
where
\( k \) represents stiff constant
\( Δx \) represents stretch length
\( m \) represents the mass of plane
\( v \) represents initial launch speed
The airfoil, elevator, and empennage of the plane are not changed for all trial. The empennage is made of 70g/cm3 paper, and the fuselage is made of cardboard. The centre of mass of the test plane is located about 1/4 of the length of plane from the head because gliders perform well in this mass distribution.[6] The distribution of mass is achieved by stapling the cardboard at the desired location of the fuselage. It may vary in small scale when different wing is installed on the plane because the wings are installed in the same place when different wing is used. Moreover, the extension of the rubber band remain the same for all trial of experiment so that the initial speed of the plane is identical for every trial.
Table 2. Fixed parameters in the experiment
Releasing Height (cm) | Releasing Angle (deg) | Rubber Band Spring Constant (n/m) | Stretch Length (cm) | Density Of Paper (g/cm3) | Area Of Elevator (cm2) |
105 | 0 | 100 | 13.5 | 70 | 26.6 |
2.2. Difficulties of the experiment
While undertaking the experiment to explore the relationship between aspect ratio and descent rate, we decided to use a paper plane. During the process, the group suffered some noteworthy challenges. Firstly, the strength of the cardboard fuselage is limited, it may struggle to withstand the tension force exerted by the rubber band during the plane’s launch. This limitation could lead to inconsistencies in the experiment’s outcomes as structural integrity varies. Secondly, the paper’s susceptibility to deformation under stress poses a significant hurdle. Wing made from normal printing paper (paper density 70g/cm3) cannot bear the force exerted by the rubber band. As the stretch of the the rubber band increases, the fuselage deforms, and eventually ripping the fuselage.
The problems are solved during the experiment. The wings with high aspect ratio are redesigned by adjusting different folding process. By folding the length side twice, the bending is less significant. Moreover, the fuselage used new, harder cardboard, which can afford the force by the rubber band. Therefore, the deformation of fuselage is no longer a problem.
2.3. The experiment of testing five different wings
The experiment yielded the following result. Table 2 shows the performance of 5 different designs in the testing flights. These five distinct wing sets have aspect ratio of 7.35, 5.4, 4.135, 3.27, and 2.47. The flying distance for each set of wings were tested three times, and the average distance is computed. The average descent rate is calculated by average distance over releasing height.
Table 3. Experiment results. Each wing configuration are tested three times, and their average performance is calculated.
Aspect ratio (-) | Gliding distance (cm) | Average distance (cm) | Average descent rate (-) | Releasing height (cm) |
7.35 | 198 | 157.33 | 1.5 | 105 |
183 | ||||
91 | ||||
5.4 | 339 | 329.33 | 3.14 | 105 |
318 | ||||
331 | ||||
4.135 | 213 | 221.33 | 2.11 | 105 |
202 | ||||
231 | ||||
3.27 | 158 | 157 | 1.49 | 105 |
149 | ||||
164 | ||||
2.47 | 152 | 153 | 1.46 | 105 |
158 | ||||
149 |
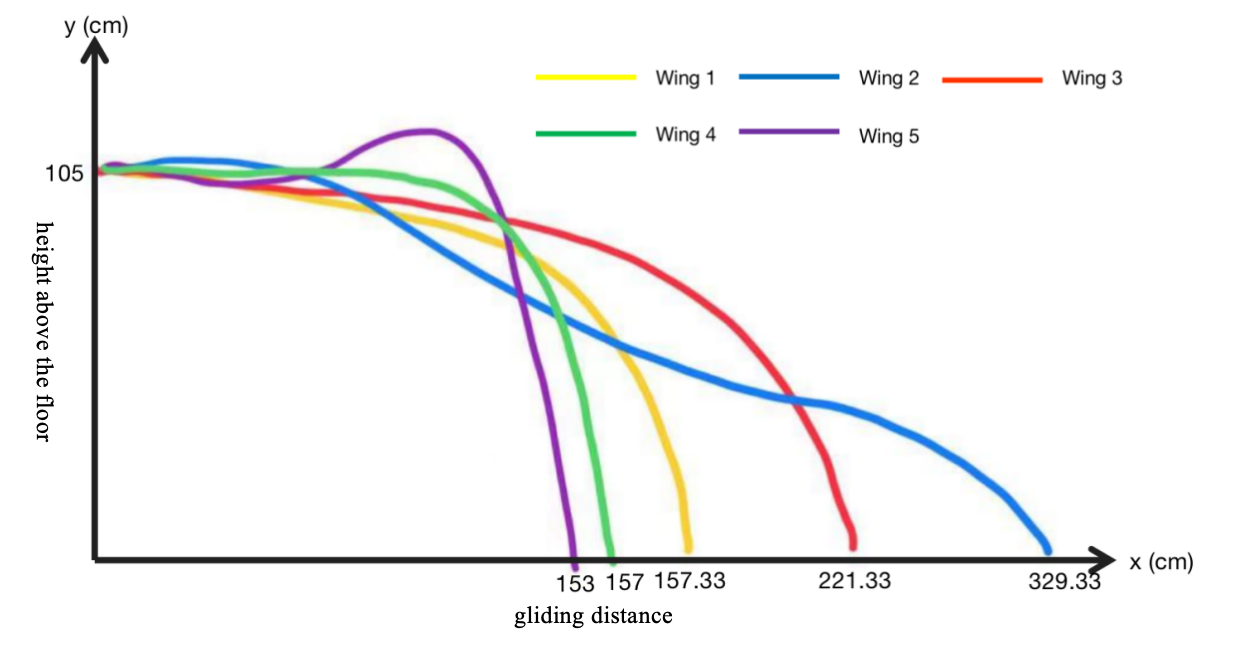
Figure 3. Rough flight path of paper-plane using different wing. The yellow curve reflects the path of plane using wing 1, blue for wing 2, red for wing 3, green for wing 4, and purple for wing 5.
The scatter plot graph is drawn below. The equation of this best fit curve is
\( y=-21.353{x^{2}}+220.75x-296.49\ \ \ (10) \)
The goodness of fit of this curve is
\( R2=0.605\ \ \ (11) \)
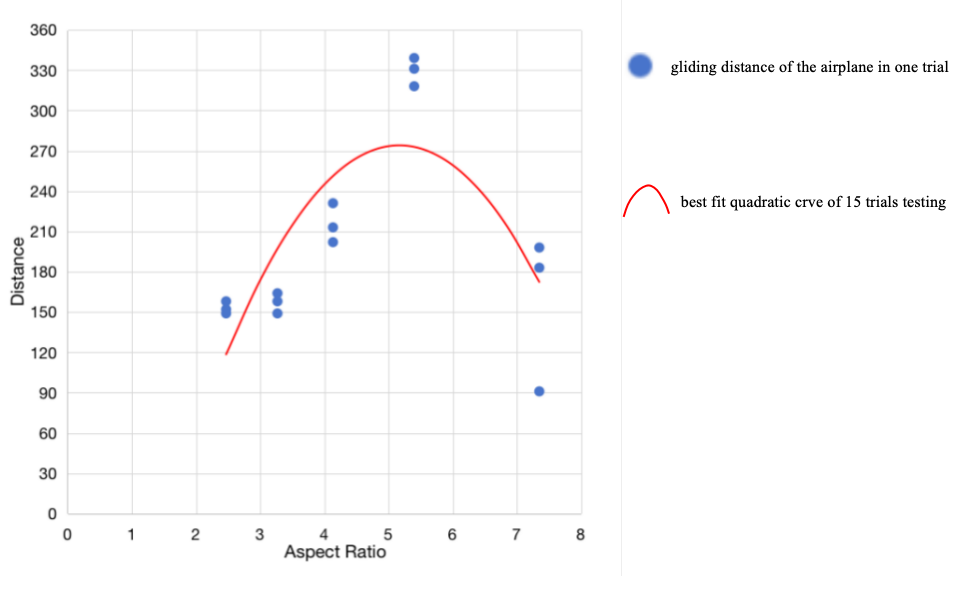
Figure 4. Data are plotted in x-y coordinate. The x-axis represents aspect ratio, and the y-axis represents flying distance in centimeters. The scatters are fitted by a 2th degree polynomial function (quadratic equation).
2.4. Data interpretation
The data shows that as the aspect ratio increases, the gliding distance increases. However, as the aspect ratio increased at a certain critical point, the gliding distance falls, and the performance become less accurate. In the wing 1 (AR 7.35), the average gliding distance is 157.33cm. The variation of this wing is considerable. While one trial of experiment obtained 198cm gliding distance, other trial obtained 91cm.
The airplane using wing 2 of aspect ratio glided averagely 329.33cm. As the aspect ratio continuing to decrease, the gliding distance decreases. In figure 4, the best fit quadratic equation shows that there is a optimal value of aspect ratio, which is roughly about 5.1 to 5.2 because the vertex of the best-fit curve indicates the optimal aspect ratio. The gliding distance will decrease for the airplanes whose aspect ratio is greater or less than this value.
Further interpretation of table 3, figure 3, and figure 4 based on observation and physics analysis has been made. Firstly, the wings with a high aspect ratio (7.35, for instance) did not perform as the conventional idea that a high aspect ratio wing design is suitable for gliding. It can be observed that the wing is shaking during the flight, thus causing the loss of lift. This phenomenon might be the reason for the unexpected performance of the plane.
Secondly, testing of wings 3 and 5 yielded another result. After releasing the plane, the plane raised its head and stalled after traveling one to one-half meter. The reason for this result could be the lift generated by the wing is somewhat larger than its gravity, so the net force always points up, pulling the plane upward, and eventually stalling. As the law of conservation of mechanical energy states, the sacrifice in height (potential energy) will exchange some amount of speed (kinetic energy). The plane did not dive downward, so extra kinetic energy cannot be exchanged. For example, the descent rate of paper plane carrying wing 5 is negative, that is, the plane is climbing up, so that it falls after short period of climbing. Wing 2 (aspect ratio 5.4) and 4 (aspect ratio 3.27) yielded the perfect gliding curve, and they perform best among other wing options.
Furthermore, the average descent rate is not equal to the real or instantaneous descent rate. As the data presented, while some glider’s wings with a high aspect ratio might vibrate, and then stall, others with a low aspect ratio might tip its nose due to the imbalance of forces. Therefore, it can be concluded that to perform well, the wing design should find a balance point between high and low aspect ratio, and the material selected to produce the wing is important.
3. Conclusion
In conclusion, according to the experiment result, higher aspect ratio does not means better gliding performance. The bad performance of high-aspect ratio airplane is contributed by weak structure strength of wing. Shorter wing (lower aspect ratio) performed better than that of high aspect ratio because less shacking occurs on shorter wing, but their wing will generate too much lift so that the plane always points its nose up, and causing stall. Based on this experiment and the outcome, the optimal aspect ratio for paper airplane would be around 5.10.
Such method can apply to small flying object testing, such as small-scale gliders. This method is easy to perform because it does not require heavy equipment, such as wing tunnel. During the experiment, researchers need to ensure that the air is stationary in the testing place, such as closing all windows and turning off the fans to prevent disturbance flows.
Authors’ contributions
Yuyuan Lin, Yueran Liu, and Ziheng Wang conceived and planned the experiments. Yuyuan Lin carried out the experiments, and contributed to the interpretation of the results. Ziai Tu, Ziheng Wang points out the reasons of this research. Yuyuan Lin took the lead in writing the manuscript. All authors provided critical feedback and helped shape the research, analysis and manuscript.
References
[1]. What Is Aspect Ratio in Aircraft Design and Why Does It Matter? Published in 2023.08.30 by Monroeaerospace https://monroeaerospace.com/blog/what-is-aspect-ratio-in-aircraft-design-and-why-does-it-matter/
[2]. Wing-tunnel investigation at low speeds to determine the effect of aspect ratio and end plates on a rectangular wing with jet flaps defected 85° by John G. Lowry and Raymond D. Vogler, Langley Aeronautical Laboratory, Langley Field, VA, 1956
[3]. Page 58, THE ENCYCLOPEDIA OF AERODYNAMICS by Frank E. Hitchens, 2015 digital version by Andrews UK Limited www.andrewsuk.com
[4]. Chapter 5 Altitude Change Climb and Guide Aerodynamics and Aircraft Performance, 3rd edition by James F. Marchman III https://pressbooks.lib.vt.edu/aerodynamics/chapter/ chapter-5-altitude-change-climb-and-guide/
[5]. Page 9, Principles of Dynamic Scaling by Chambers, Joseph R. Modeling flight : the role of dynamically scaled free-flight models in support of NASA’s aerospace programs
[6]. Centre of mass location, flight modes, stability and dynamic modelling of gliders by Huilin Li, Tristan Goodwill, Z. Jane Wang, and Leif Ristroph, published in J. Fluid Mech. (2022), vol. 937, A6, doi:10.1017/jfm.2022.89
Cite this article
Lin,Y.;Liu,Y.;Wang,Z.;Tu,Z. (2024). Research of correlation between aspect ratio and descent rate-Based on paper-plane using experiment. Applied and Computational Engineering,78,187-194.
Data availability
The datasets used and/or analyzed during the current study will be available from the authors upon reasonable request.
Disclaimer/Publisher's Note
The statements, opinions and data contained in all publications are solely those of the individual author(s) and contributor(s) and not of EWA Publishing and/or the editor(s). EWA Publishing and/or the editor(s) disclaim responsibility for any injury to people or property resulting from any ideas, methods, instructions or products referred to in the content.
About volume
Volume title: Proceedings of the 2nd International Conference on Mechatronics and Smart Systems
© 2024 by the author(s). Licensee EWA Publishing, Oxford, UK. This article is an open access article distributed under the terms and
conditions of the Creative Commons Attribution (CC BY) license. Authors who
publish this series agree to the following terms:
1. Authors retain copyright and grant the series right of first publication with the work simultaneously licensed under a Creative Commons
Attribution License that allows others to share the work with an acknowledgment of the work's authorship and initial publication in this
series.
2. Authors are able to enter into separate, additional contractual arrangements for the non-exclusive distribution of the series's published
version of the work (e.g., post it to an institutional repository or publish it in a book), with an acknowledgment of its initial
publication in this series.
3. Authors are permitted and encouraged to post their work online (e.g., in institutional repositories or on their website) prior to and
during the submission process, as it can lead to productive exchanges, as well as earlier and greater citation of published work (See
Open access policy for details).
References
[1]. What Is Aspect Ratio in Aircraft Design and Why Does It Matter? Published in 2023.08.30 by Monroeaerospace https://monroeaerospace.com/blog/what-is-aspect-ratio-in-aircraft-design-and-why-does-it-matter/
[2]. Wing-tunnel investigation at low speeds to determine the effect of aspect ratio and end plates on a rectangular wing with jet flaps defected 85° by John G. Lowry and Raymond D. Vogler, Langley Aeronautical Laboratory, Langley Field, VA, 1956
[3]. Page 58, THE ENCYCLOPEDIA OF AERODYNAMICS by Frank E. Hitchens, 2015 digital version by Andrews UK Limited www.andrewsuk.com
[4]. Chapter 5 Altitude Change Climb and Guide Aerodynamics and Aircraft Performance, 3rd edition by James F. Marchman III https://pressbooks.lib.vt.edu/aerodynamics/chapter/ chapter-5-altitude-change-climb-and-guide/
[5]. Page 9, Principles of Dynamic Scaling by Chambers, Joseph R. Modeling flight : the role of dynamically scaled free-flight models in support of NASA’s aerospace programs
[6]. Centre of mass location, flight modes, stability and dynamic modelling of gliders by Huilin Li, Tristan Goodwill, Z. Jane Wang, and Leif Ristroph, published in J. Fluid Mech. (2022), vol. 937, A6, doi:10.1017/jfm.2022.89