


1. Introduction
With the development of science and technology, machine learning technology has become a widely used tool in stock market prediction. Many scholars have already explored this field, among them Wang Jiazeng, who conducted research on stock price prediction and portfolio management with an improved LSTM neural network. This research helps investors to study the trends of individual stocks and manage their investment timing for more efficient and safer decision-making. It also provides new insights into how deep learning methods can address the challenges of quantitative investing [1]. Taking the consumer industry as an example, Gao Ziyi predicted the stock price trends of domestic listed companies based on the random forest algorithm [2]. However, there are still certain limitations with prediction algorithms today, as different machine learning algorithms vary in their effectiveness for stock market prediction. This paper explores three machine learning algorithms for stock prediction and examines the challenges that have emerged with these methods. The goal is to help investors achieve more accurate, interpretable, and efficient stock predictions by providing them with more valuable reference information. The machine learning research methods in this paper include neural networks, random forests, and support vector machines. Each of these three algorithms has its own advantages that can be used to make better predictions on stock prices.
2. Introduction to machine learning algorithms
The following section introduces the machine learning algorithms studied in this paper, explaining their principles and providing illustrations to help clarify the concepts.
2.1. Neural Networks
In machine learning, a neural network is a computational model that simulates the structure and function of a biological neural network and is used to approximate a function. The modeling principle involves a series of layers of neurons, represented by circles in the figure below. Each neuron (or node) is directly connected to others. The input data is processed through a weighted sum, followed by a nonlinear function to produce the output. This output becomes the input of the next layer, as shown in Figure 1 (b)(c) [3]. This process continues until the final output is produced.
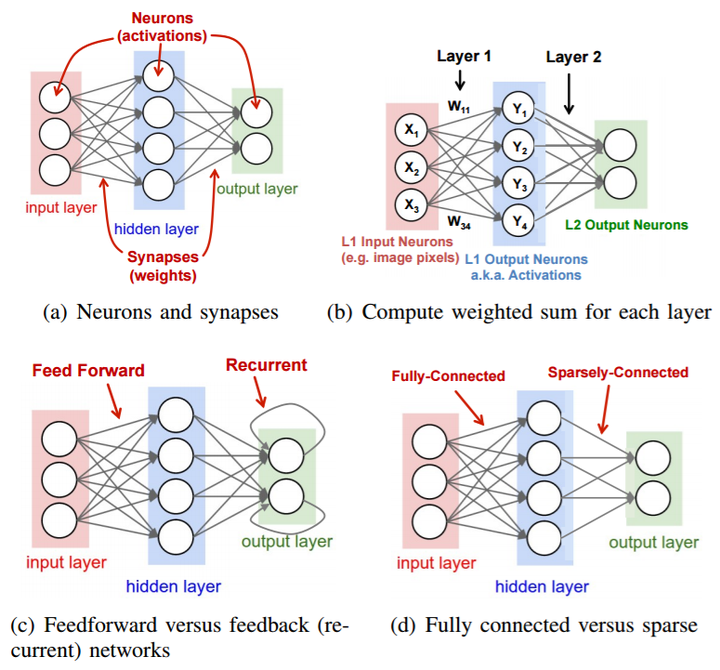
Figure 1. The Neural Networks outputs process [3]
2.2. Support vector machines
In machine learning, a support vector machine is a supervised learning linear classifier that optimally separates different categories of data by finding a hyperplane and maximizing the spacing between indistinguishable categories of data. Its model arithmetic principle is divided into five main mechanisms: maximizing interval classification, functional and geometric intervals, optimization problems, kernel functions, soft intervals and regularization.
Maximizing interval classification involves finding a hyperplane that maximizes the interval between two categories (e.g., Fig. 2a) [4]. Functional intervals indicate the correctness of the classification prediction as well as the degree of certainty, and are related to the choice of hyperplane not to be used as a measure of the interval. In contrast, the geometric interval represents the true distance from the point to the hyperplane and is not affected by the parameters of the hyperplane (e.g., Fig. 2b) [4]. The optimization problem, which involves finding a hyperplane that maximizes the geometric interval for all samples, can be further solved by transforming it into a dual problem using the Lagrange multiplier method. The kernel function maps the input data from the original feature space to a space of higher dimensions, so that the data that is linearly indistinguishable in the low-dimensional space becomes linearly distinguishable in the high-dimensional space (e.g., Fig. 2c) [4]. Soft spacing and regularization address the issue that full linear separation is not feasible in practical applications due to the presence of noise or anomalies in the data, which is achieved through the introduction of slack variables and regularization parameters.
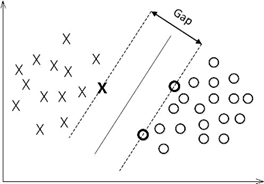
Figure 2a. Maximum interval classifier [4]
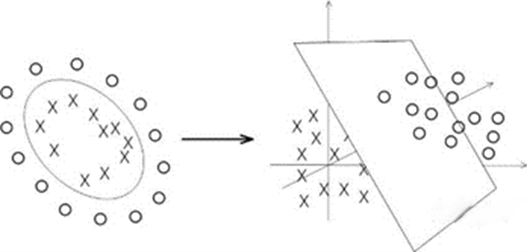
Figure 2b. Geometric intervals [4]
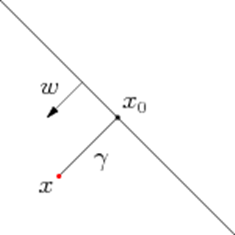
Figure 2c. Kernel function [4]
2.3. Random forests
Among machine learning algorithms, Random Forest is an ensemble learning method mainly used for classification and regression tasks. It combines the predictions of multiple decision trees to improve the accuracy of predictions and control overfitting. Its principle is based on two key mechanisms: random selection of datasets and random selection of features. Random selection of the dataset means that the training set used to construct decision trees may or may not contain repeated data points, which is very helpful to increase the diversity of the model and improve overall performance. Random selection of features means that when each node of the decision tree is split, a subset of features is randomly selected from all features, and then the optimal ones are chosen for splitting (e.g., Fig 3) [5]. This model helps to improve the generalization ability and reduces the correlation between the models.
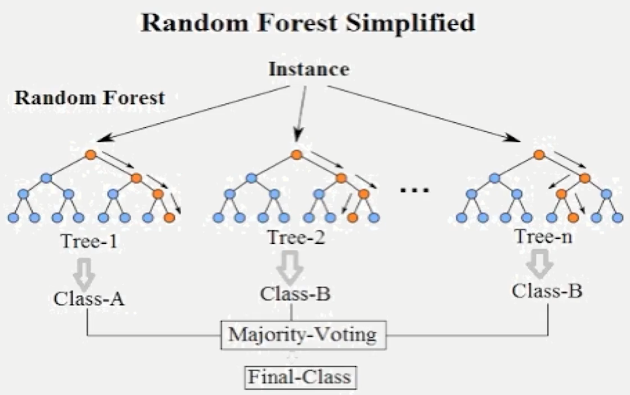
Figure 3. Random Forest Simplified [5]
3. The role of machine learning in stock price prediction
First, machine learning can improve the accuracy of stock price predictions by using historical stock price data to identify patterns and build models. These models can then be refined for more accurate trend forecasting. Machine learning algorithms are also capable of integrating data from different sources for a more comprehensive analysis, which further improves accuracy. For example, since stock price fluctuations are part of a highly complex, nonlinear system, adjustments do not follow a uniform timeline. By combining the characteristics of the LSTM (long short-term memory) recurrent neural network with the characteristics of the stock market, researchers have carried out preprocessing operations such as interpolation, wavelet noise reduction and, normalization. The data was then fed into an LSTM network model with different numbers of LSTM layers and different numbers of hidden neurons under the same number of layers to carry out training and testing. It further compared the evaluation indexes and prediction results to find the appropriate number of LSTM layers and hidden neurons, leading to an improvement in the prediction accuracy of about 30%. The paper found that this model not only had low computational complexity, but also improved prediction results. While helping investors to construct appropriate stock investment strategies based on a better understanding of actual stock prices, it can also provide a useful reference for predicting stock trends before stock investment [6]. For the support vector machine model, one researcher constructed a weighted MC model by introducing a weighting method that can make better use of the available data, a support vector regression (SVR) model with strong nonlinear regression capability, and a long-short-term memory neural network (LSTM) model that can learn patterns and trends in time series data. An MC___SVR rolling model and an MC___SVR___ LSTM combination model are proposed to fit the stock price prediction. The experimental results show that compared with the MC model, the accuracy of the weighted MC model in predicting the state of the short-term data is doubled, and the average absolute error δ is reduced by 4.98% [7]. Finally, in Deng Yun's study, three key parameters, namely max_features, n_estimators, and min_samples_leaf, are considered in the construction of the random forest model. A lattice search was used to find the combination of parameters that maximizes the oob_score (i.e., minimizes the OOB error), and the model is built accordingly to predict the ups and downs of the next trading day. The rest of the parameters use the default values provided in Python Sklearn. Data from 100 trading days prior to the prediction date was used to train the Random Forest model and make predictions about the ups and downs on the next trading day. The training set was adjusted in a rolling fashion, and at the end of each modeling prediction, the true characteristics and the ups and downs of the current day were included in the training set, while the samples that were the oldest from the current date were eliminated from the training set. Each time, the model was trained with data from the latest 100 trading days and then used to predict the next day’s movement. Eventually, the authors predicted the ups and downs for a total of 300 trading days from May 4, 2017, to July 23, 2018, and compared two scenarios: using filtered movements as market characteristics or not. The experimental results demonstrate the change in the out-of-bag (OOB) sample scores of the random forest model. From the OOB score, regardless of whether the denoising trend was included, the OOB score during these 300 trading days is significantly higher than 0.5, and the difference between the two is not obvious, which indicates that the overall performance of the model on the out-of-bag sample is still good [8].
4. Discussion
The first is the complexity of the stock market, which is susceptible to a variety of factors resulting in high volatility, nonlinear relationships, and uncertainty. This makes stock price prediction difficult, which makes it difficult to accurately produce forecasts, capture market dynamics effectively using linear models, and fully predict the future movements of the stock market. Secondly, prediction algorithms have limitations because different machine algorithms vary in their adaptability to stock market prediction. For example, although the neural network algorithm is highly adaptable to complex, non-linear data environments, its results are not easily interpretable for investors who want to know how to predict is not very suitable for investors. Secondly in Support Vector Machines it is more suitable for small to medium sized datasets and it improves the accuracy of the predictions, but the computational cost of this model is high especially when dealing with large scale data. Lastly, for Random Forest, this model can handle large volumes of noisy data and capture multiple factors in the stock market. However, it is prone to overfitting for small amounts of data and takes longer to train due to the need for multiple decision trees to be built simultaneously. These are problems with models that are used individually, but if they are applied in combination, the risk of problems with each can be reduced[9][10][11]. Of course, in the process of machine learning stock price prediction, the most obvious challenge is related to the data, because instability in stock market data directly affect the performance of machine learning algorithms in predicting stock prices.
5. Conclusion
These three algorithms can predict the stock price market from multiple perspectives and complement each other on the original problems of their respective methods. Firstly, when using neural networks, this algorithm is prone to overfitting. However, the random forest algorithm has the characteristic of anti-overfitting. Therefore, researchers can combine neural networks and random forests to further predict and improve the accuracy of predictions. Secondly, the random forest algorithm has strong data processing capabilities and can effectively solve the problem of low computational efficiency in support vector machine algorithms. The problem of stock market data has yet to be solved, so this paper suggests that future research should focus on integrating more types of data and combining the advantages of a variety of machine learning algorithms to build a hybrid prediction model.
References
[1]. Wang Jiazeng. 2023. Research on stock price prediction and stock portfolio based on improved LSTM neural network[D]. Xi'an University of Architecture and Technology, 2023. DOI: 10.27393/d.cnki.gxazu.2023.000894
[2]. Gao Ziyi. 2024. Random Forest-based Stock Price Trend Prediction Research.
[3]. F.-F. Li, A. Karpathy, and J. Johnson, “Stanford CS class CS231n: Convolutional Neural Networks for Visual Recogni tion,” http://cs231n.stanford.edu/.
[4]. Steinwart, I., & Christmann, A. (2008). Support vector machines. Springer Science & Business Media.
[5]. Getting Started with the Python Random Forest Algorithm and Performance Evaluation https://zhuanlan.zhihu.com/p/70233215
[6]. Peng Yan, Liu Yuhong, Zhang Rongfen. 2019. Modeling and analysis of stock price prediction based on LSTM. Computer Engineering and Applications, 55(11):209-212
[7]. Z.H. Chen. 2024. Research on stock price prediction based on machine learning algorithm[D]. Dongguan Institute of Technology. DOI: 10.44357/d.cnki.gdgut.2024.000171.
[8]. Deng Yun. Time selection strategy for the Shanghai and Shenzhen 300 Index based on wavelet denoising and random forest algorithm (Doctoral dissertation, Huazhong University of Science and Technology)
[9]. Jabed, Mahfuz Islam Khan. (2024). Stock Market Price Prediction using Machine Learning Techniques. American International Journal of Sciences and Engineering Research. 7. 1-6. 10.46545/aijser. v7i1.308.
[10]. Zhang Lei. 2022. Stock price prediction based on investor sentiment [D]. Qufu Normal University. doi: 10.27267/d.cnki.gqfsu.2022.000576.
[11]. Hou, Yani. (2021). Stock Price Prediction Based on Bi-LSTM Deep Learning. Statistics and Application.10.538-546.10.12677/SA.2021.103055.
Cite this article
Meng,X. (2024). An analysis of machine learning's role in stock price prediction. Applied and Computational Engineering,92,115-120.
Data availability
The datasets used and/or analyzed during the current study will be available from the authors upon reasonable request.
Disclaimer/Publisher's Note
The statements, opinions and data contained in all publications are solely those of the individual author(s) and contributor(s) and not of EWA Publishing and/or the editor(s). EWA Publishing and/or the editor(s) disclaim responsibility for any injury to people or property resulting from any ideas, methods, instructions or products referred to in the content.
About volume
Volume title: Proceedings of the 6th International Conference on Computing and Data Science
© 2024 by the author(s). Licensee EWA Publishing, Oxford, UK. This article is an open access article distributed under the terms and
conditions of the Creative Commons Attribution (CC BY) license. Authors who
publish this series agree to the following terms:
1. Authors retain copyright and grant the series right of first publication with the work simultaneously licensed under a Creative Commons
Attribution License that allows others to share the work with an acknowledgment of the work's authorship and initial publication in this
series.
2. Authors are able to enter into separate, additional contractual arrangements for the non-exclusive distribution of the series's published
version of the work (e.g., post it to an institutional repository or publish it in a book), with an acknowledgment of its initial
publication in this series.
3. Authors are permitted and encouraged to post their work online (e.g., in institutional repositories or on their website) prior to and
during the submission process, as it can lead to productive exchanges, as well as earlier and greater citation of published work (See
Open access policy for details).
References
[1]. Wang Jiazeng. 2023. Research on stock price prediction and stock portfolio based on improved LSTM neural network[D]. Xi'an University of Architecture and Technology, 2023. DOI: 10.27393/d.cnki.gxazu.2023.000894
[2]. Gao Ziyi. 2024. Random Forest-based Stock Price Trend Prediction Research.
[3]. F.-F. Li, A. Karpathy, and J. Johnson, “Stanford CS class CS231n: Convolutional Neural Networks for Visual Recogni tion,” http://cs231n.stanford.edu/.
[4]. Steinwart, I., & Christmann, A. (2008). Support vector machines. Springer Science & Business Media.
[5]. Getting Started with the Python Random Forest Algorithm and Performance Evaluation https://zhuanlan.zhihu.com/p/70233215
[6]. Peng Yan, Liu Yuhong, Zhang Rongfen. 2019. Modeling and analysis of stock price prediction based on LSTM. Computer Engineering and Applications, 55(11):209-212
[7]. Z.H. Chen. 2024. Research on stock price prediction based on machine learning algorithm[D]. Dongguan Institute of Technology. DOI: 10.44357/d.cnki.gdgut.2024.000171.
[8]. Deng Yun. Time selection strategy for the Shanghai and Shenzhen 300 Index based on wavelet denoising and random forest algorithm (Doctoral dissertation, Huazhong University of Science and Technology)
[9]. Jabed, Mahfuz Islam Khan. (2024). Stock Market Price Prediction using Machine Learning Techniques. American International Journal of Sciences and Engineering Research. 7. 1-6. 10.46545/aijser. v7i1.308.
[10]. Zhang Lei. 2022. Stock price prediction based on investor sentiment [D]. Qufu Normal University. doi: 10.27267/d.cnki.gqfsu.2022.000576.
[11]. Hou, Yani. (2021). Stock Price Prediction Based on Bi-LSTM Deep Learning. Statistics and Application.10.538-546.10.12677/SA.2021.103055.