


1. Introduction
The English Premier League (EPL) is a highly competitive and internationally recognised football league that attracts a wide range of attention from analysts, coaches and fans. Predicting the outcome of EPL matches is challenging due to a number of factors, including team dynamics, player form, injuries and coach tactics.
Traditional methods, while useful, often fail to capture the complexity and variability inherent in football matches. This has driven interest in machine learning techniques in improving the accuracy of predictions. The application of machine learning to predict the outcome of football matches demonstrates its practical effects, which are expected to improve the decision-making process of football professionals and provide data-driven understanding of game dynamics.
Past research has focused on statistical analysis and machine learning techniques. Traditional methods rely on historical team performance, player statistics and match characteristics to predict outcomes [1]. In recent years, machine learning techniques such as logistic regression, decision trees, and neural networks have been widely used to analyze large data sets and extract predictive insights [2] [3]. In addition, ensemble learning methods such as random forest and gradient lift have also been shown to improve predictive performance. However, noise data and complicating factors, such as team tactics and game backgrounds, remain major challenges.
This research aims to explore the practical application of machine learning algorithms such as random forests, K-nearest neighbors, support vector machines, and integrated methods in football match outcome prediction using real data from EPL. Traditional statistical methods are inadequate in capturing subtle patterns and complex interactions in large-scale sports data. By systematically analyzing various influencing factors and applying machine learning models, this study provides references for practical applications to help researchers, analysts and industry practitioners understand the capabilities and limitations of these models and lay the foundation for the progress of future football match prediction [3] [4].
2. Methodology
2.1. Principal Component Analysis
This study visualizes the contribution rates of each principal component in a PCA analysis [2]. If the plot_scree_plot flag is set to True, a scree plot is generated using the scree_plot function, showing the percentage of variation explained by each principal component. If save_scree_plot is also True, the figure is saved as 'PCA Scree Plot ml10.png'. Additionally, a scatter plot is created to visualize the first two principal components (PC1 and PC2), with PC1 representing the largest variance and PC2 the least after PC1. If the xplot_pc1_pc2 flag is True, the plot is generated with PC1 on the x-axis and PC2 on the y-axis, with data points colored based on the 'Team Result Indicator' from df_ml_10. The plot is titled 'PCA X-Plot', with axis labels and a legend included, and can be saved as 'PC1 PC2 xplot ml10.png' if save_pc1_pc2 is True. The PCA scree plot is a key tool in dimensionality reduction, helping determine the optimal number of components to retain by identifying the ‘elbow’ point where the cumulative explained variance plateaus, indicating the optimal component count.
Specifically, the scree plot often reveals that the initial principal components, particularly the first two, account for a substantial portion of the overall variance. PC1 captures 37.9% of the variance, while PC2 captures 30.8%. Subsequent components contribute progressively less to the variance, indicating that the data can be effectively represented in a reduced dimensionality space primarily informed by these first few components.
2.2. KNN
The code generates and potentially saves prediction probability plots for two datasets using nearest-neighbor models. It first checks if pred_prob_plot_df10 is set to True; if so, it creates a plot for the first dataset using the pred_proba_plot function, which takes the ml_10_knn model, its features (x_10), labels (y_10), and various plot-specific parameters like iterations, bins, and minimum x-axis value. A similar process occurs for the second dataset if pred_prob_plot_df5 is True, generating a plot using the ml_5_KNN model with corresponding features and labels, but with more iterations. The histograms generated for both datasets distinguish between correct (green bars) and incorrect (pink bars) predictions, segmented by prediction probabilities ranging from 0.3 to 1.0. In both ml_5 and ml_10 histograms, a high concentration of green bars at higher probability values indicates the model's confidence aligns well with actual outcomes, whereas a spread of pink bars, especially at higher probabilities, suggests less precision. Iterating the model 50 times ensures the results are robust and not due to chance.
2.3. Random Forest
We began by processing the preprocessed datasets df_ml_5 and df_ml_10, containing data from the past 5 and 10 matches, respectively. To ensure model accuracy, we standardized the data so each feature had a mean of zero and a standard deviation of one. For both datasets, we separated the features (x_5, x_10) and target variables (y_5, y_10).
In training the Random Forest model, we defined a rand_forest_train function. The process included: creating feature matrices and target variables, splitting the dataset into 80% training and 20% test sets, and instantiating the Random Forest classifier with a maximum depth of 4, 4 features, and 120 trees to balance complexity and overfitting. The model was trained on the training set using the fit method, and its performance was evaluated by comparing accuracy on both the training and test sets to check for overfitting or underfitting.
After training, we used the models trained on df_ml_10 and df_ml_5 to make predictions and combined their probabilities for a final prediction result. The model’s performance was further evaluated using cross-validation, confusion matrices, and learning curves. The learning curves, generated by the plot_learning_curve function, showed an increasing trend in accuracy as the training set size grew, indicating the model's ability to capture more accurate patterns with larger data. However, the curves also revealed a saturation point where further accuracy improvements diminished, suggesting the model might be nearing its performance ceiling or facing overfitting risks.
The prediction probability histograms for both df_5 and df_10 datasets provided a detailed breakdown of the model’s prediction confidence. In both cases, the majority of predictions fell within the 0.4 to 0.6 probability range, with correct predictions significantly outnumbering incorrect ones, particularly around the 0.45 mark. This suggests that the model’s confidence generally aligned with actual outcomes. The learning curves indicated that both training and cross-validation precision improved with larger training sets, reflecting the model’s ability to learn more accurate patterns. However, the curves also showed a saturation point, suggesting either the model was nearing its performance ceiling or facing overfitting risks. Cross-validation accuracy stabilized at around 0.5 for df_5 and 0.55 for df_10, indicating a limit to the model’s generalization capability. Overall, the model achieved a high rate of correct predictions, with df_5 showing about 65% accuracy and df_10 slightly higher at 70%, demonstrating the model’s strong generalization ability and predictive accuracy.
2.4. Support Vector Machine
In this study, we employed a Support Vector Machine (SVM) model to predict football match outcomes. We instantiated the SVM classifier svm.SVC, using the Radial Basis Function (RBF) as the kernel, with the C parameter set to 3 and gamma appropriately configured to prevent overfitting while maintaining sufficient complexity to capture data patterns. The model was trained by fitting the training data (x_train and y_train), adjusting the decision boundary to maximize the margin between classes and minimize classification errors. After training, we evaluated the model's performance on both the training and test sets by calculating accuracy, helping us assess its learning effectiveness and generalization ability. To further assess performance, we conducted cross-validation, generated confusion matrices, and plotted learning curves, which provided a comprehensive view of the model's capabilities and potential overfitting issues.
The SVM model showed significant differences in predictive performance across outcome categories. It performed relatively well in predicting "team wins" and "team losses," with a precision of 55%, indicating that it usually correctly identified the winning or losing team. However, its accuracy in predicting "draws" was much weaker at only 15%, suggesting difficulty in handling closely contested matches. This low accuracy in predicting draws could limit the model’s utility, especially in contexts where draws are common. Improving draw prediction accuracy will be crucial for future enhancements. A confusion matrix on the ML5 dataset was generated to visually present the model’s classification performance across the three outcome categories.
These two confusion matrix charts provide detailed information about the performance of SVM models under different parameter settings. In the ML5 configuration, the model correctly predicted "team loses" 73 times out of 132 instances (55.3%), "team wins" 76 times out of 134 instances (56.7%), but only correctly identified 11 "draws" out of 77 instances (14.3%). In contrast, the ML10 configuration shows 67 correct "team loses" predictions out of 120 instances (55.8%), 61 correct "team wins" predictions out of 110 instances (55.5%), and only 8 correct "draw" predictions out of 63 instances (12.7%). This discrepancy suggests that while the SVM models perform reasonably well in predicting binary outcomes ("team wins" or "team loses") with over 55% accuracy, they struggle significantly with the "draw" category, achieving less than 15% accuracy. More analysis and model adjustments are required to improve the accuracy of the draw prediction.
For the SVM model under the df_5 setting, learning curves indicate potential overfitting, with training accuracy starting around 1.0 and decreasing to 0.8, while cross-validation accuracy remains low at approximately 0.5. A similar pattern is observed under the df_10 setting, where training accuracy drops from 0.95 to 0.75, with cross-validation accuracy around 0.55. In both settings, prediction probabilities cluster between 0.4 and 0.6, with correct predictions significantly outnumbering incorrect ones. Despite achieving over 55% accuracy in predicting "team wins" and "team losses" across both df_5 and df_10, the model's accuracy sharply declines when predicting "draws," with only 14.3% accuracy in df_5 and 12.7% in df_10. These results highlight the model's struggle with the "draw" category, emphasizing the need for improved regularization, feature enhancement, and advanced algorithms to address overfitting and boost overall performance.
The SVM model performs well under both the df_5 and df_10 parameter settings. For df_5, the learning curves show that training accuracy remains consistently high as the training set size increases, indicating good adaptation to the training data. Although cross-validation accuracy is lower, it gradually stabilizes as the training set grows. The prediction probability distribution reveals that most predictions fall between 0.4 and 0.6, with correct predictions significantly outnumbering incorrect ones, demonstrating accurate classification in most cases. Similarly, under df_10, the model maintains high training accuracy, while cross-validation accuracy stabilizes with increasing data. The prediction probability distribution again shows most values between 0.4 and 0.6, with a higher number of correct predictions, further confirming the model’s ability to make accurate classification decisions.
3. Evaluation & Results
Along with accuracy metrics, confusion matrices derived from 5-fold cross-validation were utilized to assess the performance of machine learning models, specifically Random Forest, Support Vector Machine (SVM), and K-Nearest Neighbors (KNN). These matrices, depicted below, provide a comprehensive view of the models’ ability to classify match outcomes across three categories: team loses, draw, and team wins.
|
|
| |
Figure 1. ML_5 Confusion Matrices | |

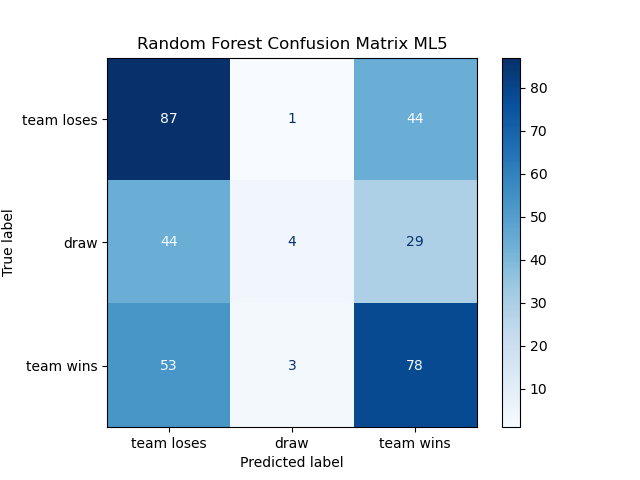
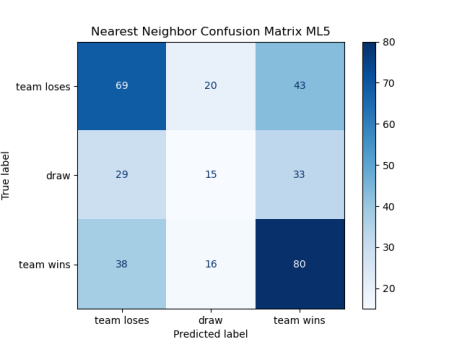
Examination of confusion matrices shows the Random Forest model leads with 49.93% accuracy, surpassing the SVM (47.62%) and KNN (45.66%) [5] [6]. All models struggle with predicting draws, with Random Forest accurately predicting only 4 out of nearly 550 draws, while SVM and KNN predict 11 and 15, respectively. This consistent difficulty in predicting draws highlights a challenge in capturing nuances such as evenly matched teams or defensive strategies, suggesting overfitting to more common outcomes and a lack of feature differentiation for draws. The results underscore the inherent unpredictability of football matches, where draws occur in about 20% of games.
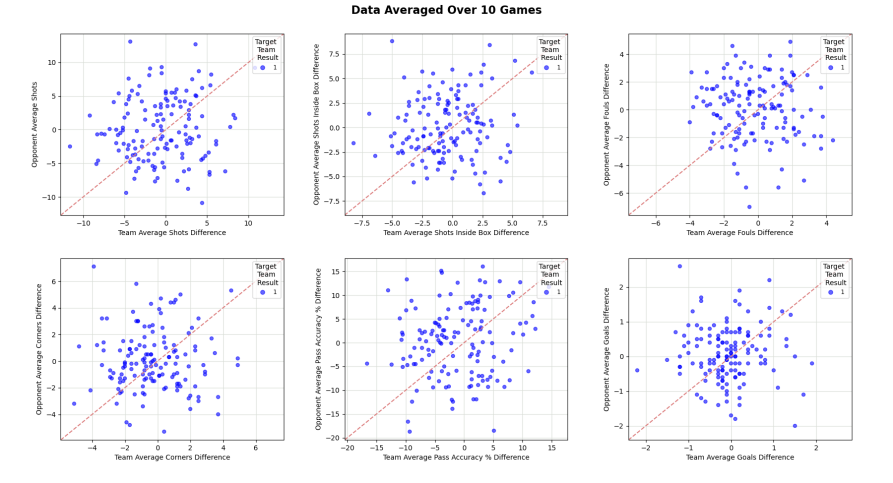
Figure 2. Cross-Plotted Features Only Draw
Fig. 10 provides an in-depth analysis of the average of key statistics for both teams and their opponents in 10 matches, including shots, fouls, corners, passing accuracy and goals. While these metrics would be expected to be close to similar values in a draw, the data show a scattered distribution, suggesting that a draw may occur under highly variable conditions rather than just under equilibrium conditions. For example, the wide distribution of goal differences suggests that draws can occur even in games with significant differences. Passing accuracy and goals also failed to match expected patterns, highlighting the complexity of predicting draws. These findings point to the need for more sophisticated feature engineering and model optimization, which in the future should include more variables such as weather conditions, tactical changes, and psychological factors to provide more reliable predictions of football matches.
4. Discussion
This study has some limitations. Using the data of API-FOOTBALL platform, the model performed well in predicting wins and losses, but was poor in predicting draws, mainly because the existing feature set failed to fully capture the complexity of draws, such as tactical decisions, game dynamics and psychological factors [6]. The study highlights the importance of expanding the feature set to include more contextual and psychological variables. Nevertheless, the study demonstrates the feasibility of machine learning in football match prediction and points out the challenges of predicting draws. Future research should integrate complex variables such as weather, team morale, and tactical adjustments, and explore deep learning models and diverse data sources to improve predictive power and model robustness.
5. Future Work
Improving football match prediction through machine learning requires a multifaceted approach, starting with the enhancement of feature engineering. Integrating more sophisticated and context-specific variables, such as weather conditions, real-time tactical adjustments, and psychological factors like team morale and player stress levels, would enable models to capture the complex dynamics that influence match outcomes, particularly the often challenging prediction of draws. Additionally, broadening the dataset to incorporate diverse information sources, such as live match commentary, player social media activity, and fan sentiment, would provide a more comprehensive understanding of the factors at play, thereby increasing the robustness and reliability of the models.
Exploring advanced machine learning techniques, including deep learning and ensemble methods, could further improve the models' ability to detect nonlinear relationships and intricate interactions between variables, leading to more accurate and nuanced predictions. Collaboration between data scientists and football analysts will be critical in refining these models, ensuring they are not only accurate but also practical and actionable for real-world applications. This collaborative effort could result in models that better support decision-making processes for clubs, coaches, and analysts, ultimately elevating the strategic use of sports analytics in football and contributing to more informed and effective tactical planning.
References
[1]. E. G. Dunning, J. A. Maguire, and R. E. Pearton, The Sports Process: A Comparative and Developmental Approach. Champaign, IL: Human Kinetics Publishers, 1993.
[2]. E. Ong and A. Flitman, “Using neural networks to predict binary outcomes,” in Proc. 1997 IEEE Int. Conf. on Intelligent Processing Systems (Cat. No. 97TH8335), vol. 1, IEEE, 1997, pp. 427–431.
[3]. J. Hucaljuk and A. Rakipović, “Predicting football scores using machine learning techniques,” in Proc. 2011 34th Int. Convention MIPRO, IEEE, 2011, pp. 1623–1627.
[4]. A. Joseph, N. E. Fenton, and M. Neil, “Predicting football results using Bayesian nets and other machine learning techniques,” Knowledge-Based Systems, vol. 19, no. 7, pp. 544–553, 2006.
[5]. J. Gomes, F. Portela, and M. F. Santos, “Decision support system for predicting football game result,” in Computers-19th Int. Conf. on Circuits, Systems, Communications and Computers-Intelligent Systems and Applications Special Sessions, vol. 32, 2015, pp. 348–353.
[6]. F. Rodrigues and Â. Pinto, “Prediction of football match results with machine learning,” Procedia Computer Science, vol. 204, pp. 463–470, 2022.
Cite this article
Wang,T.;Zhang,Z. (2024). Machine learning-based football match prediction system. Applied and Computational Engineering,92,181-186.
Data availability
The datasets used and/or analyzed during the current study will be available from the authors upon reasonable request.
Disclaimer/Publisher's Note
The statements, opinions and data contained in all publications are solely those of the individual author(s) and contributor(s) and not of EWA Publishing and/or the editor(s). EWA Publishing and/or the editor(s) disclaim responsibility for any injury to people or property resulting from any ideas, methods, instructions or products referred to in the content.
About volume
Volume title: Proceedings of the 6th International Conference on Computing and Data Science
© 2024 by the author(s). Licensee EWA Publishing, Oxford, UK. This article is an open access article distributed under the terms and
conditions of the Creative Commons Attribution (CC BY) license. Authors who
publish this series agree to the following terms:
1. Authors retain copyright and grant the series right of first publication with the work simultaneously licensed under a Creative Commons
Attribution License that allows others to share the work with an acknowledgment of the work's authorship and initial publication in this
series.
2. Authors are able to enter into separate, additional contractual arrangements for the non-exclusive distribution of the series's published
version of the work (e.g., post it to an institutional repository or publish it in a book), with an acknowledgment of its initial
publication in this series.
3. Authors are permitted and encouraged to post their work online (e.g., in institutional repositories or on their website) prior to and
during the submission process, as it can lead to productive exchanges, as well as earlier and greater citation of published work (See
Open access policy for details).
References
[1]. E. G. Dunning, J. A. Maguire, and R. E. Pearton, The Sports Process: A Comparative and Developmental Approach. Champaign, IL: Human Kinetics Publishers, 1993.
[2]. E. Ong and A. Flitman, “Using neural networks to predict binary outcomes,” in Proc. 1997 IEEE Int. Conf. on Intelligent Processing Systems (Cat. No. 97TH8335), vol. 1, IEEE, 1997, pp. 427–431.
[3]. J. Hucaljuk and A. Rakipović, “Predicting football scores using machine learning techniques,” in Proc. 2011 34th Int. Convention MIPRO, IEEE, 2011, pp. 1623–1627.
[4]. A. Joseph, N. E. Fenton, and M. Neil, “Predicting football results using Bayesian nets and other machine learning techniques,” Knowledge-Based Systems, vol. 19, no. 7, pp. 544–553, 2006.
[5]. J. Gomes, F. Portela, and M. F. Santos, “Decision support system for predicting football game result,” in Computers-19th Int. Conf. on Circuits, Systems, Communications and Computers-Intelligent Systems and Applications Special Sessions, vol. 32, 2015, pp. 348–353.
[6]. F. Rodrigues and Â. Pinto, “Prediction of football match results with machine learning,” Procedia Computer Science, vol. 204, pp. 463–470, 2022.