


1. Introduction
As one of the significant tasks of computer vision technology, object detection has shown great application potential in many fields. Car detection is a vital branch of object detection, which is of incredible importance for improving road safety, optimizing traffic management and advancing autonomous driving [1].
Compared with the traditional way of object detection, deep learning detection algorithms with stronger robustness as well as generalization ability can autonomously complete the feature recognition of the object to be identified, without the need for human feature design [1]. Deep learning detection algorithms are primarily classified as two-stage algorithms and one-stage algorithms. Two-stage algorithms use heuristics or CNN networks to generate region proposals that may contain target objects and then classify and regressively predict the region proposals [2]. Yin, G. et al. adopted a faster R-CNN algorithm and refined the RPN network to significantly enhance the detection effect of small-scale car targets [3]. Han, X. introduced an optimized Cascade RCNN algorithm for car detection and modified the feature pyramid to improve the detection performance of shielded cars [4]. Although two-stage algorithms achieve high detection accuracy, they have poor real-time performance and cannot satisfy the speed demands for car detection in the field of autonomous driving. One-stage algorithms make use of a single CNN network to forecast the classes and positions of various objects in the image for feature extraction, classification and regression. One-stage detection algorithms are represented by YOLO. Sang, J. et al. employed a normalization method to refine the loss calculation on the basis of YOLOv2 model and the mean Average Precision reached more than 90% [5]. Tajar, A. T. et al. investigated a lightweight car detection model based on YOLOv3 to identify, locate, and classify cars in images [6]. Wang, R. et al. proposed a detection algorithm of self-driving cars based on the improved YOLOv4, which reduced the overall width of the network to 3/4 of the original one and improved the inference speed [7]. Jiang, X. et al. used a convolutional transform block-based detection head in YOLOv4 to achieve precision improvement of car logo detection in complicated backgrounds [8].
Considering the detection accuracy, efficiency and algorithm difficulty, YOLOv5 is used as the basis for the research of car detection in urban areas.
2. Principles of YOLOv5
There are four parts in the network structure of YOLOv5: Input, Backbone, Neck and Head. The YOLOv5 structure is shown in Figure 1.
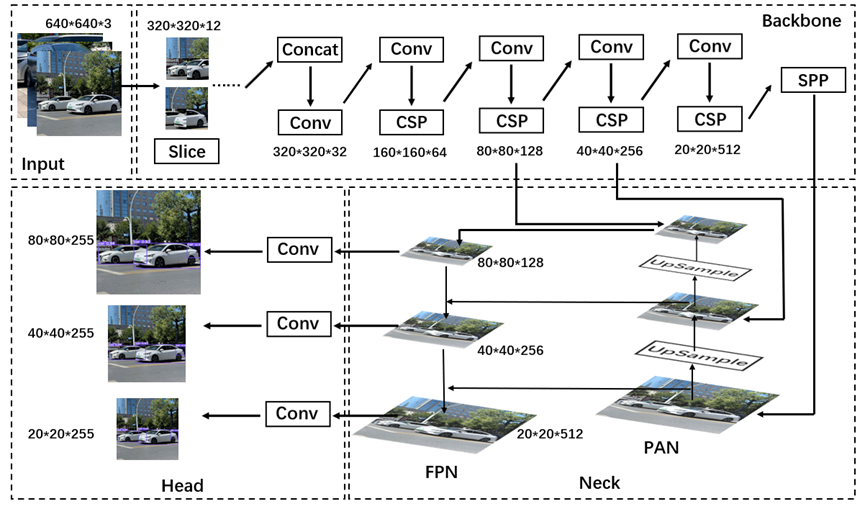
Figure 1. YOLOv5 structure.
Input is the first step in processing the raw image and is responsible for the preprocessing and augmentation of the data. It enables the subsequent network to achieve feature extraction and object detection more effectively. Input mainly contains three data processing approaches: Mosaic data augmentation, adaptive image resizing and adaptive anchor box computation. The Mosaic data augmentation algorithm randomly scales, crops, distributes and splices four different original input images. They are fused into a synthetic image that contains the features of the four original images. The Mosaic data augmentation algorithm enriches the dataset and greatly improves the training speed at the same time [9]. Mosaic data enhancement is shown in Figure 2.
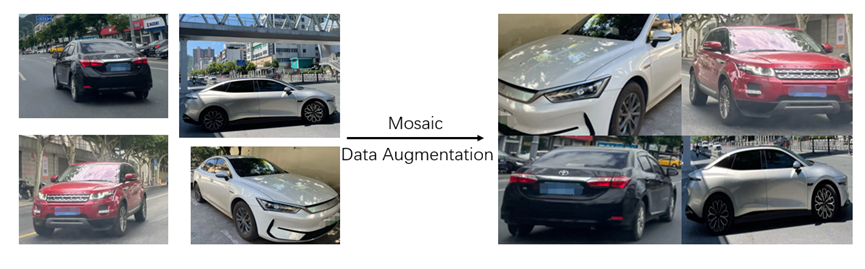
Figure 2. Mosaic Data Augmentation.
Backbone is mainly composed of Focus, CSP and SPP. They are used for target feature extraction in the image. Focus is the slicing operation of the image before it enters into Backbone. The original 640*640*3 images are inputted into Focus, and 320*320*12 feature map is formed by slicing operations, and then 32 convolutions are performed to finally construct 320*320*32 feature map. Focus increases the number of channels in the feature map. It helps to minimize the loss of information and enhance the detection capability of the model on small objects. CSP can achieve smaller computation and faster inference speed by splitting the gradient flow and allowing it to propagate through different network paths. SPP transforms arbitrary-sized feature maps into fixed-size feature vectors through pooling operations at different scales. It contributes to the enhancement of the capability of the network for multi-scale object detection.
Neck is situated between Backbone and Head. It receives the feature maps derived from Backbone, fuses these feature maps at various scales, and finally produces feature maps that are rich in contextual information. Neck adopts the structure of FPN+PAN. FPN is top-down structure that transfers the semantic information from the high-level feature map to the lower layer to enhance the semantic understanding capability of the low-level feature map. PAN is bottom-up structure that transfers the detailed information from the low-level to the high-level to enhance the localization capability of the high-level feature map. Neck fully utilizes different levels of feature information to improve the detection precision and robustness of the model.
Head first receives the feature map of multi-scales from Neck and further completes the extraction of features by utilizing convolutional layers. The three detection heads in Head sample the original image with different multiples to generate three feature vectors with different scales. They are used to generate the bounding box and predict the target category and confidence level. After obtaining multiple prediction frames, the overlapping prediction frames are removed using the Non-Maximum Suppression algorithm, and the optimal prediction results are retained.
The loss function is employed to assess the discrepancy between the model prediction and the true value. The loss function mainly includes Classification Loss, Location Loss and Objectness Loss [10]. The function for calculating the total loss is as follows:
\( L={λ_{1}}{L_{cls}}+{λ_{2}}{L_{loc}}+{λ_{3}}{L_{obj}} \) (1)
where \( {λ_{1}},{λ_{2}},{λ_{3}} \) are the respective weight coefficients. The Location Loss is used to evaluate the positional discrepancy between the prediction box and the real box. The location loss usually adopts CIOU Loss. It is improved Loss function based on IOU Loss. The area of overlap between the prediction and real boxes, the distance between their centers and the difference in aspect ratio are taken into account by CIOU Loss. It assesses the accuracy of the prediction box in a more comprehensive way. The function for calculating the CIOU Loss is as follows:
\( CIOU LOSS=1-IOU+\frac{{ρ^{2}}(b,{b^{gt}})}{{c^{2}}}+αν \) (2)
\( ν=\frac{4}{{π^{2}}}{(arctan\frac{{w^{gt}}}{{h^{gt}}}-acrtan\frac{w}{h})^{2}} \) (3)
\( α=\frac{ν}{1-IOU+ν} \) (4)
where \( b \) is the center coordinate of the prediction box, \( {b^{gt}} \) is the center coordinate of the real box, \( ρ \) is the Euclidean distance, c is the Euclidean distance between the two diagonal vertices of the smallest rectangular box, \( {w^{gt}} \) is the real box width, \( {h^{gt}} \) is the real box height, \( w \) is the prediction box width, \( h \) is the prediction box height. Objectness Loss is a measurement of the accuracy of the model prediction of the presence or absence of the target object in the prediction box. Objectness Loss is usually calculated using a Binary Cross-Entropy Loss function:
\( {L_{obj}}=-[{y_{obj}}∙log{({p_{obj}})}+(1-{y_{obj}})∙log{(1-{p_{obj}})}] \) (5)
where \( {y_{obj}} \) is the true label, \( {p_{obj}} \) is the object existence probability.
3. Experimental results and analysis
The experiment is carried out under 64-bit Windows 11 OS. The hardware environment mainly includes: 13th Gen Intel Core i7-13650HX CPU @ 2.60GHz, NVIDIA GeForce RTX 4060 Laptop GPU, PyTorch 2.3.0. The software environment includes Python 3.8 and CUDA 12.1.
Labeling tool was used to label the acquired pictures. Only one category was labeled as ‘car’, and the annotation format was converted to YOLO data format. Finally, 2600 labeled data sets were obtained. They were split into a training set with 2000 images and a validation set with 600 images. YOLOv5s is used as the weight file. The number of training rounds is 100 and the training batch is 8.
The evaluation indicators used are Precision, Recall and mAP. Precision is a measurement of the proportion of boxes in which the model predicts a positive class that are actually positive [11]. The function is as follows:
\( Precision =\frac{TP}{TP+FP} \) (6)
where TP denotes true positives, FP denotes false positives. The value of Precision tends to 1, indicating that among all the samples predicted by the model to be positive, the number of samples that are actually positive accounts for a high proportion. Recall is a measurement of the proportion of positive classes that the model predicts as positive for all actually existing positive classes. The function is as follows:
\( Recall=\frac{TP}{TP+FN} \) (7)
where FN denotes false negative. mAP is a commonly used metric to gauge the overall performance of the object detection model, which comprehensively considers the Recall and Precision of the model. Higher values of mAP indicate that the model performs better.
The representative images taken in the field are selected for testing, and the scenes include day, night, sunny day, cloudy day and rainy day. Traffic conditions include traffic light intersections, T-intersections, narrow roads, expressways, parking lots, etc. The traffic light intersection on a rainy day taken from the co-driver's perspective is shown in Figure 3. The lens is stained with water droplets, which makes the sharpness of the shot poor. In the photo, the road surface is slippery and reflective, cars are blurred, and the headlights appear halo. However, cars waiting in the opposite direction and cars passing in the same direction can all be detected. The two-way, six-lane expressway on a cloudy day taken from the co-driver's perspective is shown in Figure 4. Cars moving in front, cars parked on the roadside and cars in the opposite lane blocked by guard bars can all be detected. The narrow road on a sunny day taken from the pedestrian perspective is shown in Figure 5. Cars on both sides of the narrow road are densely parked, and even though the cars are sheltered by each other, they can be detected. The intersection at night taken from the pedestrian perspective is shown in Figure 6. The street lamp light interference is strong, the traffic condition is complicated and the cars in the distance are blurred, but almost all the cars can be detected with high confidence level
.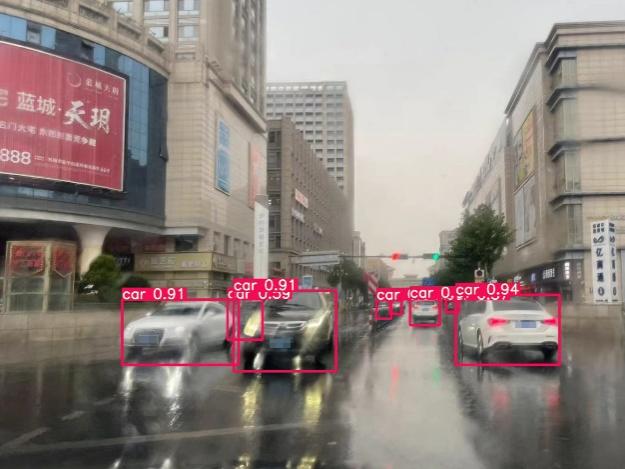
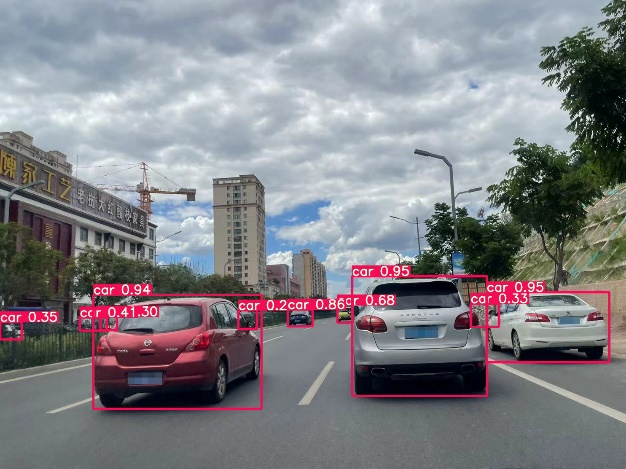
Figure 3. Traffic light intersection on a rainy day. Figure 4. Expressway on a cloudy day.
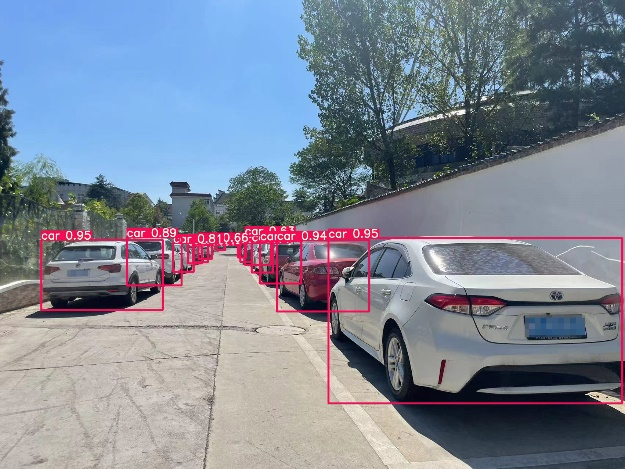
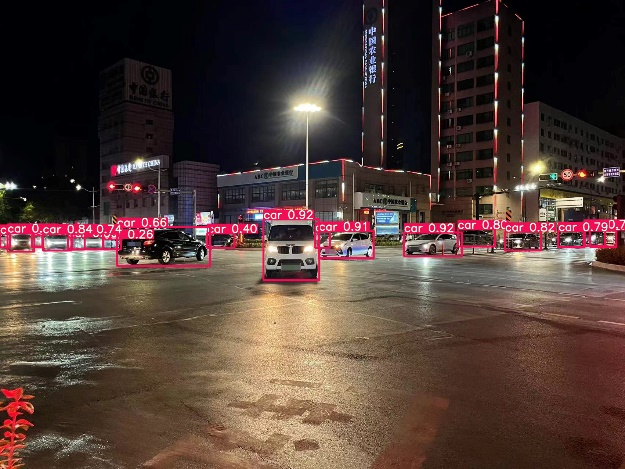
Figure 5. Narrow Road on a sunny day. Figure 6. Crossroads at Night.
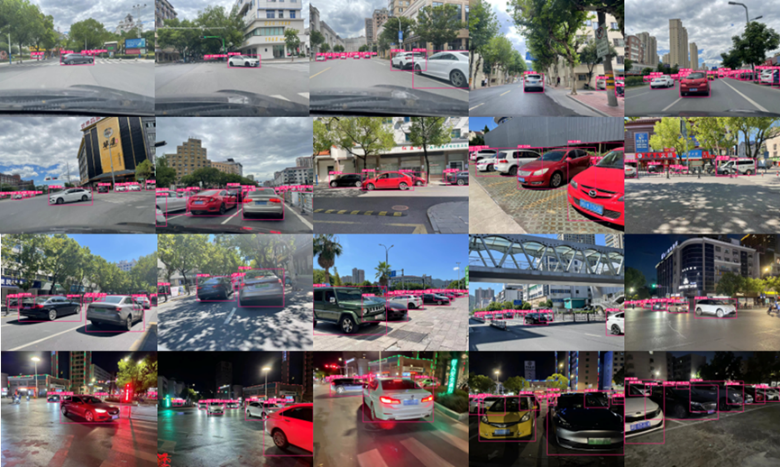
Figure 7. Car detection effects.
The car detection effects are shown in Figure 7. Twenty randomly selected photos taken in person in the field were tested. The figure covers complex traffic scenarios on urban roads during daytime and nighttime as well as under different weather conditions. The superiority of the experimental results is reflected in the following aspects: (1) Cars of different models, brands and colors can be detected. The front, side and back of the car can be detected, and the detection effect is not affected by the car's view angle. (2) When multiple cars block each other or cars are blocked by other obstacles, all cars can be detected, and the detection box can restore the basic outline of the complete car. (3) Small target cars with a long distance can be detected. Blurred car targets due to motion can be detected[12]. A total of 185 cars detected in the 20 images, of which three were not detected and four were incorrectly identified. Missed detections occur due to extremely small car targets and occlusion rates of 90 percent or more, and misdetections occur due to combinations of multiple other objects that are highly similar to car features. The analysis of detection results is shown in Table 1 and the visualization of results is shown in Figure 8.
Table 1. Analysis of results.
Proportion of cars not detected | 1.62% |
Proportion of cars incorrectly detected | 2.16% |
Confidence of cars in close proximity | >90% |
Overall detection accuracy | >95% |
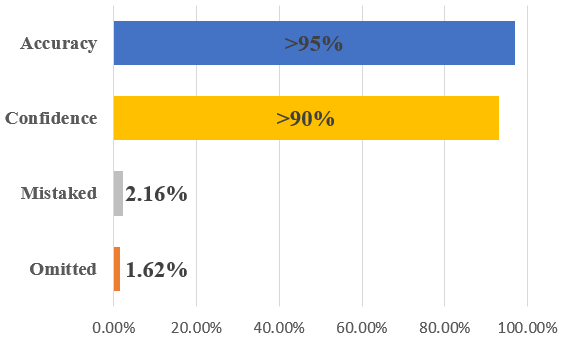
Figure 8. Visualization of results.
4. Conclusion
YOLOv5 algorithm is adopted for car detection in urban. YOLOv5 extracts features through a convolutional neural network, combines them with a feature pyramid network for multi-scale detection, and utilizes prediction heads for classification and localization. The loss function is employed to optimize the position and size of the bounding box by incorporating the prediction results of all the grids delineated in the image. For the scene of urban road car detection, the generalization ability of the model is enhanced through data augmentation technology, so that it can maintain stable recognition performance in the face of complex traffic environment. The car specific feature extraction module is introduced to further enhance the detection capability of the model for car features. After training with the car dataset, photos taken in the field were used for testing. The results of the experiment show that YOLOv5 has a high accuracy in urban road car detection, which is almost not affected by the interference of the surrounding complex environment. The confidence of nearby car detection is higher than 90%, and the missed detection rate and false detection rate can be kept below 2%. At the same time, the detection speed is faster, which can meet the real-time demands of car detection, and has good application value in many fields such as urban automatic driving and video surveillance. In the future, the main focus will be on how to reduce the training cost, reduce the number of parameters and computation of the model to make the model more lightweight, and introduce other new technologies such as self-attention mechanisms to further improve the comprehensive performance of car detection.
References
[1]. Liu, T., Zhang, J. An adaptive traffic flow prediction model based on spatiotemporal graph neural network[J]. The Journal of Supercomputing, 2023, 79(14):15245-15269.
[2]. Ren, S., He, K., Girshick, R. et al. Faster R-CNN: Towards real-time object detection with region proposal networks[J]. IEEE Transactions on Pattern Analysis and Machine Intelligence, 2017, 39(6): 1137-1149.
[3]. Yin, G., Yu, M., Wang, M. et al. Research on highway vehicle detection based on faster R-CNN and domain adaptation[J]. Applied Intelligence: The International Journal of Artificial Intelligence, Neural Networks, and Complex Problem-Solving Technologies, 2022, 52(4): 3483-3498.
[4]. Han, X., Modified Cascade RCNN Based on Contextual Information for Vehicle Detection[J]. Sensing and Imaging, 2021, 22(1): 19.
[5]. Sang, J., Wu, Z., Guo, P. et al. An Improved YOLOv2 for Vehicle Detection[J]. Sensors, 2018, 18(12): 4272.
[6]. Tajar, A. T., Ramazani, A., Mansoorizadeh, M. et al. A lightweight Tiny-YOLOv3 Vehicle detection approach[J]. Journal of Real-Time Image Processing, 2021, 18(6): 2389-2401.
[7]. Wang, R., Wang, Z., Xu, Z. et al. A Real-time Object Detector for Autonomous Vehicles Based on YOLOv4[J]. Computational Intelligence and Neuroscience, 2021, 2021(13): 9218137.
[8]. Jiang, X., Sun, K., Ma, L. et al. Vehicle Logo Detection Method Based on Improved YOLOv4[J]. Electronics, 2022, 11(20): 3400.
[9]. Tong, Y., Luo, X., Ma, L. et al. Saliency information and mosaic based data augmentation method for densely occluded object recognition[J]. Pattern Analysis and Applications, 2024, 27(2): 1-13.
[10]. Zhang, J., Zhong, H. Curve-based lane estimation model with lightweight attention mechanism[J]. Signal, Image and Video Processing, 2023, 17(5): 2637-2643.
[11]. Zhang, J., Dou, J. An adversarial pedestrian detection model based on virtual fisheye image training[J]. Signal, Image and Video Processing, 2024, 18(4): 3527-3535.
[12]. Jin, J., Zhang, J., Zhang, K. et al. 3D multi-object tracking with boosting data association and improved trajectory management mechanism[J]. Signal Processing, 2024, 218(2024):109367.
Cite this article
Zhang,C. (2024). Car detection algorithm in urban based on YOLOv5. Applied and Computational Engineering,88,239-245.
Data availability
The datasets used and/or analyzed during the current study will be available from the authors upon reasonable request.
Disclaimer/Publisher's Note
The statements, opinions and data contained in all publications are solely those of the individual author(s) and contributor(s) and not of EWA Publishing and/or the editor(s). EWA Publishing and/or the editor(s) disclaim responsibility for any injury to people or property resulting from any ideas, methods, instructions or products referred to in the content.
About volume
Volume title: Proceedings of the 6th International Conference on Computing and Data Science
© 2024 by the author(s). Licensee EWA Publishing, Oxford, UK. This article is an open access article distributed under the terms and
conditions of the Creative Commons Attribution (CC BY) license. Authors who
publish this series agree to the following terms:
1. Authors retain copyright and grant the series right of first publication with the work simultaneously licensed under a Creative Commons
Attribution License that allows others to share the work with an acknowledgment of the work's authorship and initial publication in this
series.
2. Authors are able to enter into separate, additional contractual arrangements for the non-exclusive distribution of the series's published
version of the work (e.g., post it to an institutional repository or publish it in a book), with an acknowledgment of its initial
publication in this series.
3. Authors are permitted and encouraged to post their work online (e.g., in institutional repositories or on their website) prior to and
during the submission process, as it can lead to productive exchanges, as well as earlier and greater citation of published work (See
Open access policy for details).
References
[1]. Liu, T., Zhang, J. An adaptive traffic flow prediction model based on spatiotemporal graph neural network[J]. The Journal of Supercomputing, 2023, 79(14):15245-15269.
[2]. Ren, S., He, K., Girshick, R. et al. Faster R-CNN: Towards real-time object detection with region proposal networks[J]. IEEE Transactions on Pattern Analysis and Machine Intelligence, 2017, 39(6): 1137-1149.
[3]. Yin, G., Yu, M., Wang, M. et al. Research on highway vehicle detection based on faster R-CNN and domain adaptation[J]. Applied Intelligence: The International Journal of Artificial Intelligence, Neural Networks, and Complex Problem-Solving Technologies, 2022, 52(4): 3483-3498.
[4]. Han, X., Modified Cascade RCNN Based on Contextual Information for Vehicle Detection[J]. Sensing and Imaging, 2021, 22(1): 19.
[5]. Sang, J., Wu, Z., Guo, P. et al. An Improved YOLOv2 for Vehicle Detection[J]. Sensors, 2018, 18(12): 4272.
[6]. Tajar, A. T., Ramazani, A., Mansoorizadeh, M. et al. A lightweight Tiny-YOLOv3 Vehicle detection approach[J]. Journal of Real-Time Image Processing, 2021, 18(6): 2389-2401.
[7]. Wang, R., Wang, Z., Xu, Z. et al. A Real-time Object Detector for Autonomous Vehicles Based on YOLOv4[J]. Computational Intelligence and Neuroscience, 2021, 2021(13): 9218137.
[8]. Jiang, X., Sun, K., Ma, L. et al. Vehicle Logo Detection Method Based on Improved YOLOv4[J]. Electronics, 2022, 11(20): 3400.
[9]. Tong, Y., Luo, X., Ma, L. et al. Saliency information and mosaic based data augmentation method for densely occluded object recognition[J]. Pattern Analysis and Applications, 2024, 27(2): 1-13.
[10]. Zhang, J., Zhong, H. Curve-based lane estimation model with lightweight attention mechanism[J]. Signal, Image and Video Processing, 2023, 17(5): 2637-2643.
[11]. Zhang, J., Dou, J. An adversarial pedestrian detection model based on virtual fisheye image training[J]. Signal, Image and Video Processing, 2024, 18(4): 3527-3535.
[12]. Jin, J., Zhang, J., Zhang, K. et al. 3D multi-object tracking with boosting data association and improved trajectory management mechanism[J]. Signal Processing, 2024, 218(2024):109367.