


Data Augmentation,etc,.
1 Introduction
Plants provide a significant portion of the global food supply. Plant diseases are a major cause of output loss, but they may be avoided by keeping a close eye on them. Plant disease monitoring by hand is time-consuming and prone to mistakes. Agriculture's expansion thousands of years ago led to the domestication of today's most important food crops and animals. One of the most pressing global issues that mankind confronts today is food poverty, which is exacerbated by plant diseases.
Plant diseases are responsible for around 16% of worldwide crop production loss, according to one estimate. Pest losses in wheat are predicted to be above 50% and in soybeans to be 26–29% worldwide. The major groups of plant diseases include nematodes, protozoa, algae, fungi, fungus-like creatures, bacteria, viruses, viroid, virus-like organisms, and parasitic plants. Deep-learning architectures, including deep neural networks, deep belief networks, graph neural networks, recurrent neural networks, and convolutional neural networks, have been used in board game programmes, computer vision, speech recognition, natural language processing, machine translation, bioinformatics, drug design, medical image analysis, and bioinformatics with results that are on par with or even superior to those of human experts.The evolution of biological systems' information processing and dispersed communication nodes served as an inspiration for (ANNs).
Numerous characteristics set ANNs apart from biological brains. The organic brains of the majority of living things are dynamic (plastic) and analogue, in contrast to neural networks' static and symbolic nature. In deep learning, the word "deep" refers to the network's utilisation of several layers. A network with one unbounded width hidden layer and a nonpolynomial activation function may be used as a universal classifier instead of a linear perceptron, according to preliminary study. Modern machine learning techniques like deep learning employ an unlimited number of bounded-size layers to enable practical application and optimization while maintaining theoretical universality in reasonable conditions.
2 Existing Countermeasures
To identify and diagnose cotton leaf disease, the researchers employed image processing and machine learning techniques. A survey of background reduction and segmentation techniques was also covered. Following this survey, we got to the conclusion that colour space conversion from RGB to HSV is beneficial for backdrop removal. We noticed that the thresholding process gives good results when compared to other background removal procedures. This is important for determining the specific features of a disease. We noticed that SVM delivers good results in terms of illness classification. Picture capture, image pre-processing, and image segmentation are three of the five key components of our proposed work, three of which have already been executed [1].
An image-processing-based approach for identifying leaf and stem disease is provided and applied in this work [2]. Five plant diseases were used to evaluate our programme: early scorch, cottony mould, ashen mould, late scorch, and tiny whiteness. Image processing is used in the suggested technique. In the first stage of the suggested method, the photographs are segmented using the KMeans technique, and the segmented images are then passed through a pre-traineural network in the second stage. As a testbed, we utilise a set of leaf pictures from Jordan's Al-Ghor region [3] Plant diseases must be identified in order to avoid losses in agricultural product output and quantity. It takes a lot of time and work, as well as understanding of plant diseases. As a result, image processing is used in plant disease detection. The disease detection method includes steps such as image capture, pre-processing, image segmentation, feature extraction, and classification. This study looked into methods for diagnosing plant diseases using photos of their leaves.
Collecting high-quality images with the most detail of leaf colour was the most difficult component of the endeavour [4]. It's a typical difficulty to get an image with all of the characteristics into a usable memory. As a result of the excellent resolution, these photographs are 6-10MB in size. The Nikon D5200 camera, which worked wonderfully, was used to do this. The second issue was removing lighting conditions, which vary substantially from the start to the conclusion of the rice crop season, even when the image capture time is stable [5] They undertake a study on how image processing techniques may be used to identify plant leaf disease. Crop disease reduces the quantity and quality of agricultural products by a significant margin. With the naked eye, a farmer's ability to detect sickness signs is restricted. Crop protection, particularly in large farms, is accomplished by the application of computerised image processing technologies that can detect damaged leaves based on leaf colour data. Depending on the applications, a variety of image processing algorithms have been developed to address challenges with pattern recognition and some automated categorization tools.
This study explores a novel method for deep neural networks-based categorization of leaf images as a basis for a plant disease identification model [6]. A rapid and simple system installation in reality is made possible by the approach and novel training methods employed. The proposed model can discriminate between plant leaves and their surroundings and can identify 13 distinct forms of plant illnesses from healthy leaves [7]. Our classification system, which uses convolutional neural networks, achieved an average accuracy of 82.3 percent using the 4-fold cross validation method, despite the fact that half of the photos utilised in this experiment were captured in poor lighting circumstances [8] This article presents an effective method for identifying and locating sick tomato leaves using image processing. Pre-processing, feature extraction, and classification stages make up the three key components of the suggested technique. The suggested classification technique, when utilising a linear kernel function, produced experimental results that demonstrated classification accuracy of 99.83 percent.
The model excels in categorization in this situation. We trained CNN using our novel methods on a total of 800 photos of cucumber leaves [9]. The suggested CNN-based system obtains an average accuracy of 94.9 percent when categorising cucumbers into two usual illness classes and a non-diseased class using the 4-fold cross-validation technique (which additionally expands the training dataset by creating more pictures). In this study, we examine the effectiveness of various machine learning methods for recognising and categorising patterns of plant disease from leaf photos [10]. Our suggested strategy is demonstrably superior to current methods utilised for plant disease identification and support, according to experimental data. When it comes to illness categorization, Vector Machines do better than other methods [11]. Extreme drops in citrus fruit output are mostly caused by illnesses of the citrus fruit. Designing an automated method for citrus plant disease detection is crucial as a result. We decided to apply deep learning techniques to the problem of identifying citrus fruit and leaf illnesses since current research on these techniques has shown promise in a number of artificial intelligence problems. Convolutional neural networks (CNNs) are proposed as a model in this study using an integrated method.
In this study, we design a simplified densely connected convolutional network and an image dataset of six different citrus diseases with the assistance of specialists in order to create an intelligent diagnosis system for citrus diseases (DenseNet) [12]. Users may post photographs and receive diagnostic information and comments by using the WeChat applet on their mobile device, which is how the system is implemented. According to the experimental findings, by reducing the complexity of the DenseNet's structure, the recognition accuracy of citrus illnesses has increased to over 88 percent and the forecast time consumption has decreased [13][14].
3 Deep Learning
Deep-learning architectures like deep neural networks, deep belief networks, graph neural networks, recurrent neural networks, and convolutional neural networks have been used in fields like computer vision, speech recognition, natural language processing, machine translation, bioinformatics, drug design, medical image analysis, material inspection, and board game programmes, with results that are comparable to, if not better than, human expert results. (ANNs) were inspired by the information processing and distributed communication nodes seen in biological systems [15][16]. ANNs differ from biological brains in a variety of ways. Neural networks, in particular, are static and symbolic, whereas the biological brains of most living creatures are dynamic (plastic) and analogue [17].
The word "deep" in deep learning refers to the network's use of several layers. According to early research, a network with a nonpolynomial activation function and one unbounded width hidden layer may be utilised as a universal classifier, but a linear perceptron cannot. Deep learning is a more modern variant with an unbounded number of bounded-size layers that allows for practical application and optimization while preserving theoretical universality under moderate circumstances. Deep learning layers are permitted to be diverse and deviate significantly from physiologically informed connectionist models for the purpose of efficiency, trainability, and understandability, hence the "structured" part [18].
4 Convolution Neural Network
CNN is an artificial neural network that has been proved to be useful in picture identification and processing, as well as extracting and categorising various characteristics. It was also created with pixel data in mind. The main structure of CNNs is made up of convolution layers, non-linear layers, and pooling layers; these are the deeper layers that train a large number of filters in parallel. The convolution layer is the first. It extracts features from a picture as input. As input data, it calculates the pixels in photos. It's a mathematical operation that takes two inputs: an image matrix and a filter or kernel [19].
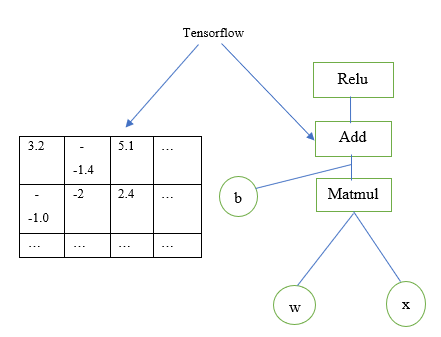
Fig.1 Convolutional Model
The Convolution Layer is the initial layer that extracts characteristics from an image. An image matrix and a filter or kernel are both required as inputs. Various filters are used to boost the pixel values of the input image. A collection of feature maps is created by applying the filters to the whole picture (Fig.1). Each convolutional layer produces a total of 256 feature maps [20].
ReLu, Pooling, and MaxPooling layers, which are all useful for shrinking feature maps. Rectified Linear Unit (ReLu) is utilised following each convolution step. Following each convolution process, a Rectified Linear Unit (ReLu) is used.After the convolutional layers were completed, the dimensionality of the featured map was reduced using the pooling layer, notably with the aid of Max Pooling. The dense layer, which incorporates the outputs from a both the convolutional and pooling layers, represents the high-level aspects of the input picture. At the dense layer's output, Softmax is used as the activation function. Finally, CNN is used to identify the person, which has a 90.15 percent accuracy rate. Convolutional neural networks are made up of many layers of artificial neurons [21].
Artificial neurons are mathematical functions that, like their biological counterparts, calculate the weighted sum of several inputs and output an activation value.One of the most difficult components of creating CNNs is adjusting the weights of individual neurons in order to extract useful information from pictures. The act of modifying these weights is called "training" the neural network. At the beginning, the CNN uses random weights. During training, the engineers send a large number of photographs to the neural network, each labelled with the appropriate classifications (cat, dog, horse, etc.) [22]. Each image is treated using random values, and the results are compared to the right label for the image. If the network's output does not match the label, which is most probable in the beginning of the training phase, the network changes the weights of its neurons to get its output closer to the proper response the next time it views the same picture. Corrections are made via a process called backpropagation (or backprop). Backpropagation improves tuning by allowing the network to determine which units to change rather than forcing it [23].
5 ALEXNET
AlexNet has five convolutional layers, three max-pooling layers, two normalisation layers, two fully connected layers, and one softmax layer in its design. Convolutional filters and a nonlinear activation function ReLU make up each convolutional layer. To accomplish max pooling, the pooling layers are used. As a result of the completely linked with layers, the input sizesare fixed. In most places, the input size is stated as 224x224x3, however owing to padding, it is really 227x227x3. AlexNet contains 60 million parameters in total (Fig 2).
12 | 20 | 30 | 0 |
8 | 12 | 2 | 0 |
34 | 70 | 37 | 4 |
112 | 100 | 25 | 12 |
20 | 30 |
112 | 37 |
Fig.2 Max Pooling
To downsample a picture or a representation, Max Pool is employed. By accepting assumptions about the characteristics included in the binned sub-regions, its dimensionality is minimised. Overlapping of Max Pool layers are exactly to Max Pool layers, except that a neighbouring windows used to determine the maximum overlap. Pooling windows with a size of 33 and a stride of 2 between neighbouring windows were used by AlexNet's creators. Because to Max Pool's overlapping nature, the top-1 error rate was decreased by 0.4 percent, while the top-5 error rate was reduced by 0.3 percent. The output dimensions are the same when using non-overlapping pooling windows of size 2*2 with a stride of 2
6 Dataset Collections
AlexNet must be trained, a data set is required. At all stages of object recognition research, from training to evaluating the effectiveness of recognition algorithms, appropriate datasets are necessary. All of the images for the dataset were obtained over the internet, there were nearly different images which was taken from Mendeley data, Kaggle, Idtools.org and various resources as shown in the Figure 3.

Fig. 3 Dataset Collections
7 Results and Discussion
The categorization of tomato leaf diseases was done in this effort. Two separate experiments for tomato leaf diseases were carried out in this work, one using the CNN normal model and the other with the preset model Alexnet. For identifying tomato illnesses, 12000 datasets were employed. Kaggle datasets were used.
The training was completed after preprocessing, producing a 97.9% accuracy with an 89.55 percent validation. The training was done using the Relu and Softmax activation functions. The accuracy and loss of each itration are computed during the training process; the loss decreases as the number of itrations increases, while the accuracy increases. The model was then saved in the format.h5 and model file type formats.
8 Loss and Accuracy
Each iteration of the training procedure calculates the loss and accuracy. Each time, the accuracy improves while the loss reduces. The loss was 19.18 percent and the accuracy was 87.78 percent in iteration 0, but the loss was decreased to 4.95 percent and the accuracy increased to 96.86 percent in the last iteration of the training as shown in the Figure 4.
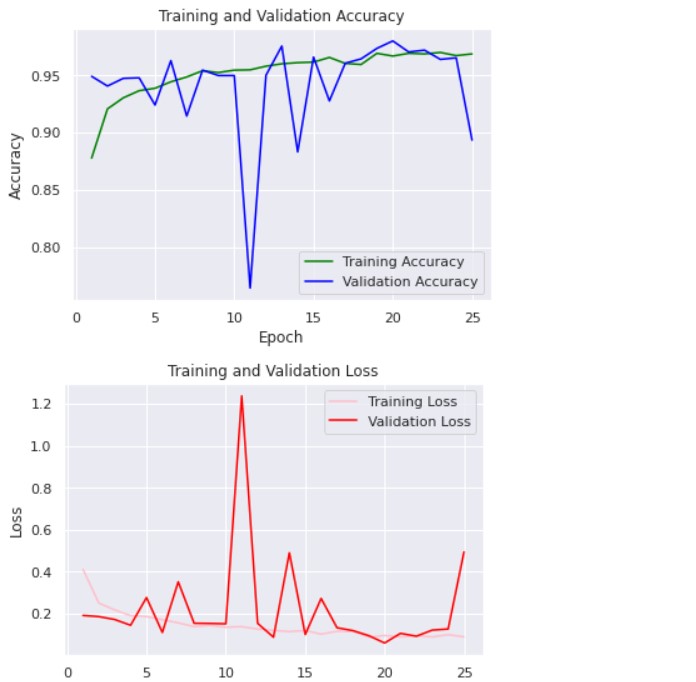
Fig. 4. Accuracy and Loss Graph
9 Conclusion and Future work
Building an effective Convolutional neural network requires a large number of annotated pictures. To solve this significant difficulty, deep learning and picture enhancement are used to a pre-trained Alexnet. It has a 97 percent accuracy rating throughout training. Vanishing gradient issue is caused by Nora\mal deep neural networks. Alexnet employs a skip connection to get around this problem. RELU and softmax activation were used to complete the training. After the model has been trained, new test images are compared to the learned model in order to forecast illness. In the future work the suitable solution will be given for the particular diseases.
References
[1]. Fumio Okura Yosuke Toda, “How convolutional neural networks diagnose plant disease.Plant Phenomics”, 2019.
[2]. Abdelouahab Moussaoui Mohammed Brahimi, Kamel Boukhalfa, “Deep learning for tomato diseases: Classification and symptoms visualization”, Applied Artificial Intelligence, 2019.
[3]. Marcel Salath Sharada P. Mohanty, David P. Hughes, “Using deep learning for imagebased plant disease detection”, Frontiers Plant Science, 2016.
[4]. Siyuan Chen Ethan L. Stewart Jason Yosinski Michael A. Gore Rebecca J. Nelson Hod Lipson Chad DeChant, TyrWiesner-Hanks, “Automated identification of northern leaf blightinfected maize plants from field imagery using deep learning”, Phytopathology, 2017.
[5]. Loreto Susperregi Carlos Tub-o Ivan RankiT Libor LenDa Aitor Gutierrez, Ander Ansuategi, ”A benchmarking of learning strategies for pest detection and identification on tomato plants for autonomous scouting robots using internal databases”, Journal of Sensors, 2018.
[6]. Andras Anderla Dubravko Culibrk-Darko Stefanovic Srdjan Sladojevic, Marko Arsenovic, ”Deep neural networks based recognition of plant diseases by leaf image classification”, Computational Intelligence and Neuroscience, 2016.
[7]. Hiroyuki Uga Satoshi Kagiwada-Hitoshi Iyatomi Erika Fujita, Yusuke Kawasaki, ”Basic investigation on a robust and practical plant diagnostic system”, IEEE, 2016.
[8]. Aboul Ella Hassenian-E. Emary Mahmoud A. Mahmoud Hesham Hefny Mohamed F. Tolba Usama Mokhtar, NashwaEl-Bendary, ”Svm-based detectionof tomato leaves diseases”, Advances in Intelligent Systems and Computing, 2014.
[9]. Satoshi Kagiwada Hitoshi Iyatomi Yusuke Kawasaki, Hiroyuki Uga, ”Basic study of automated diagnosis of viral plant diseases using convolutional neural networks”, ISVC, 2015.
[10]. Shoab A. Khan Arslan Shaukat Asma Akhtar, Aasia Khanum, ”Automated plant disease analysis (apda): Performance comparison of machine learning techniques.
[11]. Khattak et al., "Automatic Detection of Citrus Fruit and Leaves Diseases Using Deep Neural Network Model," in IEEE Access, vol. 9, pp. 112942-112954, 2021.
[12]. W. Pan, J. Qin, X. Xiang, Y. Wu, Y. Tan and L. Xiang, "A smart mobile diagnosis system for citrus diseases based on densely connected convolutional networks", IEEE Access, vol. 7, pp. 87534-87542, 2019.
[13]. Sathishkumar V E, Changsun Shin, Youngyun Cho, “Efficient energy consumption prediction model for a data analytic-enabled industry building in a smart city”, Building Research & Information, Vol. 49. no. 1, pp. 127-143, 2021.
[14]. Sathishkumar V E, Youngyun Cho, “A rule-based model for Seoul Bike sharing demand prediction using Weather data”, European Journal of Remote Sensing, Vol. 52, no. 1, pp. 166-183, 2020.
[15]. Sathishkumar V E, Jangwoo Park, Youngyun Cho, “Seoul Bike Trip duration prediction using data mining techniques”, IET Intelligent Transport Systems, Vol. 14, no. 11, pp. 1465-1474, 2020.
[16]. Sathishkumar V E, Jangwoo Park, Youngyun Cho, “Using data mining techniques for bike sharing demand prediction in Metropolitan city”, Computer Communications, Vol. 153, pp. 353-366, 2020.
[17]. Sathishkumar V E, Yongyun Cho, “Season wise bike sharing demand analysis using random forest algorithm”, Computational Intelligence, pp. 1-26, 2020.
[18]. Sathishkumar, V. E., Wesam Atef Hatamleh, Abeer Ali Alnuaim, Mohamed Abdelhady, B. Venkatesh, and S. Santhoshkumar. "Secure Dynamic Group Data Sharing in Semi-trusted Third Party Cloud Environment." Arabian Journal for Science and Engineering (2021): 1-9.
[19]. Chen, J., Shi, W., Wang, X., Pandian, S., & Sathishkumar, V. E. (2021). Workforce optimisation for improving customer experience in urban transportation using heuristic mathematical model. International Journal of Shipping and Transport Logistics, 13(5), 538-553.
[20]. Pavithra, E., Janakiramaiah, B., Narasimha Prasad, L. V., Deepa, D., Jayapandian, N., & Sathishkumar, V. E., Visiting Indian Hospitals Before, During and After Covid. International Journal of Uncertainty, Fuzziness and Knowledge-Based Systems, 30 (1), 111-123, 2022.
[21]. Easwaramoorthy, S., Moorthy, U., Kumar, C. A., Bhushan, S. B., & Sadagopan, V. (2017, January). Content based image retrieval with enhanced privacy in cloud using apache spark. In International Conference on Data Science Analytics and Applications (pp. 114-128). Springer, Singapore.
[22]. Sathishkumar, V. E., Agrawal, P., Park, J., & Cho, Y. (2020, April). Bike Sharing Demand Prediction Using Multiheaded Convolution Neural Networks. In Basic & Clinical Pharmacology & Toxicology (Vol. 126, pp. 264-265). 111 RIVER ST, HOBOKEN 07030-5774, NJ USA: WILEY.
[23]. Subramanian, M., Shanmuga Vadivel, K., Hatamleh, W. A., Alnuaim, A. A., Abdelhady, M., & VE, S. (2021). The role of contemporary digital tools and technologies in Covid‐19 crisis: An exploratory analysis. Expert systems.
Cite this article
Deepa,D.;Yaswanth,R.;Kumar,K.V. (2023). Tomato leaf diseases classification using alexnet. Applied and Computational Engineering,2,384-391.
Data availability
The datasets used and/or analyzed during the current study will be available from the authors upon reasonable request.
Disclaimer/Publisher's Note
The statements, opinions and data contained in all publications are solely those of the individual author(s) and contributor(s) and not of EWA Publishing and/or the editor(s). EWA Publishing and/or the editor(s) disclaim responsibility for any injury to people or property resulting from any ideas, methods, instructions or products referred to in the content.
About volume
Volume title: Proceedings of the 4th International Conference on Computing and Data Science (CONF-CDS 2022)
© 2024 by the author(s). Licensee EWA Publishing, Oxford, UK. This article is an open access article distributed under the terms and
conditions of the Creative Commons Attribution (CC BY) license. Authors who
publish this series agree to the following terms:
1. Authors retain copyright and grant the series right of first publication with the work simultaneously licensed under a Creative Commons
Attribution License that allows others to share the work with an acknowledgment of the work's authorship and initial publication in this
series.
2. Authors are able to enter into separate, additional contractual arrangements for the non-exclusive distribution of the series's published
version of the work (e.g., post it to an institutional repository or publish it in a book), with an acknowledgment of its initial
publication in this series.
3. Authors are permitted and encouraged to post their work online (e.g., in institutional repositories or on their website) prior to and
during the submission process, as it can lead to productive exchanges, as well as earlier and greater citation of published work (See
Open access policy for details).
References
[1]. Fumio Okura Yosuke Toda, “How convolutional neural networks diagnose plant disease.Plant Phenomics”, 2019.
[2]. Abdelouahab Moussaoui Mohammed Brahimi, Kamel Boukhalfa, “Deep learning for tomato diseases: Classification and symptoms visualization”, Applied Artificial Intelligence, 2019.
[3]. Marcel Salath Sharada P. Mohanty, David P. Hughes, “Using deep learning for imagebased plant disease detection”, Frontiers Plant Science, 2016.
[4]. Siyuan Chen Ethan L. Stewart Jason Yosinski Michael A. Gore Rebecca J. Nelson Hod Lipson Chad DeChant, TyrWiesner-Hanks, “Automated identification of northern leaf blightinfected maize plants from field imagery using deep learning”, Phytopathology, 2017.
[5]. Loreto Susperregi Carlos Tub-o Ivan RankiT Libor LenDa Aitor Gutierrez, Ander Ansuategi, ”A benchmarking of learning strategies for pest detection and identification on tomato plants for autonomous scouting robots using internal databases”, Journal of Sensors, 2018.
[6]. Andras Anderla Dubravko Culibrk-Darko Stefanovic Srdjan Sladojevic, Marko Arsenovic, ”Deep neural networks based recognition of plant diseases by leaf image classification”, Computational Intelligence and Neuroscience, 2016.
[7]. Hiroyuki Uga Satoshi Kagiwada-Hitoshi Iyatomi Erika Fujita, Yusuke Kawasaki, ”Basic investigation on a robust and practical plant diagnostic system”, IEEE, 2016.
[8]. Aboul Ella Hassenian-E. Emary Mahmoud A. Mahmoud Hesham Hefny Mohamed F. Tolba Usama Mokhtar, NashwaEl-Bendary, ”Svm-based detectionof tomato leaves diseases”, Advances in Intelligent Systems and Computing, 2014.
[9]. Satoshi Kagiwada Hitoshi Iyatomi Yusuke Kawasaki, Hiroyuki Uga, ”Basic study of automated diagnosis of viral plant diseases using convolutional neural networks”, ISVC, 2015.
[10]. Shoab A. Khan Arslan Shaukat Asma Akhtar, Aasia Khanum, ”Automated plant disease analysis (apda): Performance comparison of machine learning techniques.
[11]. Khattak et al., "Automatic Detection of Citrus Fruit and Leaves Diseases Using Deep Neural Network Model," in IEEE Access, vol. 9, pp. 112942-112954, 2021.
[12]. W. Pan, J. Qin, X. Xiang, Y. Wu, Y. Tan and L. Xiang, "A smart mobile diagnosis system for citrus diseases based on densely connected convolutional networks", IEEE Access, vol. 7, pp. 87534-87542, 2019.
[13]. Sathishkumar V E, Changsun Shin, Youngyun Cho, “Efficient energy consumption prediction model for a data analytic-enabled industry building in a smart city”, Building Research & Information, Vol. 49. no. 1, pp. 127-143, 2021.
[14]. Sathishkumar V E, Youngyun Cho, “A rule-based model for Seoul Bike sharing demand prediction using Weather data”, European Journal of Remote Sensing, Vol. 52, no. 1, pp. 166-183, 2020.
[15]. Sathishkumar V E, Jangwoo Park, Youngyun Cho, “Seoul Bike Trip duration prediction using data mining techniques”, IET Intelligent Transport Systems, Vol. 14, no. 11, pp. 1465-1474, 2020.
[16]. Sathishkumar V E, Jangwoo Park, Youngyun Cho, “Using data mining techniques for bike sharing demand prediction in Metropolitan city”, Computer Communications, Vol. 153, pp. 353-366, 2020.
[17]. Sathishkumar V E, Yongyun Cho, “Season wise bike sharing demand analysis using random forest algorithm”, Computational Intelligence, pp. 1-26, 2020.
[18]. Sathishkumar, V. E., Wesam Atef Hatamleh, Abeer Ali Alnuaim, Mohamed Abdelhady, B. Venkatesh, and S. Santhoshkumar. "Secure Dynamic Group Data Sharing in Semi-trusted Third Party Cloud Environment." Arabian Journal for Science and Engineering (2021): 1-9.
[19]. Chen, J., Shi, W., Wang, X., Pandian, S., & Sathishkumar, V. E. (2021). Workforce optimisation for improving customer experience in urban transportation using heuristic mathematical model. International Journal of Shipping and Transport Logistics, 13(5), 538-553.
[20]. Pavithra, E., Janakiramaiah, B., Narasimha Prasad, L. V., Deepa, D., Jayapandian, N., & Sathishkumar, V. E., Visiting Indian Hospitals Before, During and After Covid. International Journal of Uncertainty, Fuzziness and Knowledge-Based Systems, 30 (1), 111-123, 2022.
[21]. Easwaramoorthy, S., Moorthy, U., Kumar, C. A., Bhushan, S. B., & Sadagopan, V. (2017, January). Content based image retrieval with enhanced privacy in cloud using apache spark. In International Conference on Data Science Analytics and Applications (pp. 114-128). Springer, Singapore.
[22]. Sathishkumar, V. E., Agrawal, P., Park, J., & Cho, Y. (2020, April). Bike Sharing Demand Prediction Using Multiheaded Convolution Neural Networks. In Basic & Clinical Pharmacology & Toxicology (Vol. 126, pp. 264-265). 111 RIVER ST, HOBOKEN 07030-5774, NJ USA: WILEY.
[23]. Subramanian, M., Shanmuga Vadivel, K., Hatamleh, W. A., Alnuaim, A. A., Abdelhady, M., & VE, S. (2021). The role of contemporary digital tools and technologies in Covid‐19 crisis: An exploratory analysis. Expert systems.