


1. Introduction and Background
1.1. Convolutional Neural Network (CNN)
Convolutional Neural Networks (CNNs) are a widely used neural network architecture in deep learning, particularly suitable for image processing and computer vision tasks. CNN extracts local features from images through convolutional layers and gradually abstracts them into global features through multi-layer structures, which can effectively handle high-dimensional image data, especially performing well in the famous ImageNet image classification challenge [1]. The key components of CNN include convolutional layers, pooling layers, and fully connected layers. The convolutional layer extracts features from the input data through convolution operations, while the pooling layer reduces the size of the feature map through downsampling operations, ultimately achieving classification tasks through fully connected layers [2]. Research has shown that CNN's multi-level structure can effectively capture complex patterns in images, making it significantly advantageous in various image recognition, object detection, and image segmentation tasks [3].
1.2. Learning Rate
Learning rate is a key hyperparameter in the training process of deep learning models, determining the step size at which the model updates weights in each iteration. The choice of learning rate has a significant impact on the convergence speed and final performance of the model. An excessively high learning rate may cause the model to oscillate or even fail to converge during the training process, while an excessively low learning rate may result in the training process being too slow. In practical applications, the optimal learning rate is usually selected through experiments, and some studies have also proposed adaptive learning rate methods to dynamically adjust the learning rate during the training process, thereby improving the convergence speed and stability of the model [4].
1.3. Dropout rate
Dropout is a technique that prevents overfitting of neural networks by randomly discarding a portion of neurons during training to enhance the model's generalization ability. The use of Dropout can effectively reduce the model's dependence on specific features, thereby improving the model's performance on unknown data [5]. The dropout rate determines the proportion of randomly discarded neurons in each layer. An appropriate Dropout rate can significantly improve the performance of the model, but an excessively high Dropout rate may lead to underfitting of the model [6]. Therefore, choosing an appropriate Dropout rate is crucial for training stable and efficient models.
1.4. Experiment and Results
In this study, we conducted experiments to assess the effects of different learning rates (0.01, 0.001, 0.0001) and dropout rates (0.3, 0.5, 0.7) on the performance of a CNN model using the CIFAR-10 dataset. We tested a total of nine combinations of these hyperparameters.
The results showed that a learning rate of 0.001 combined with a dropout rate of 0.5 achieved the best performance, balancing accuracy and generalization. A higher learning rate (0.01) led to convergence issues and overfitting, while a lower learning rate (0.0001) resulted in slow learning. In terms of dropout, 0.3 caused overfitting, and 0.7 led to underfitting. The dropout rate of 0.5 provided the best results by preventing overfitting while maintaining the model's learning ability.
This optimal combination of hyperparameters (learning rate of 0.001 and dropout rate of 0.5) was found to be the most effective for this CNN model on the CIFAR-10
2. Model Design and Experimental Methods
2.1. CIFAR-10 dataset
The CIFAR-10 dataset is one of the widely used standard datasets in computer vision research, containing 60000 32x32 pixel color images divided into 10 categories. Each category has 6000 images, of which 50000 images are used for training and 10000 images are used for testing [7]. The CIFAR-10 dataset plays an important role in the field of deep learning, and many studies have evaluated and compared model performance based on this dataset. Due to the complexity and low resolution of image content, the CIFAR-10 dataset is considered an ideal benchmark for evaluating the effectiveness of image classification algorithms [8].
2.2. CNN Model Design
In this study, a classic Convolutional Neural Network (CNN) model was designed for image classification tasks on the CIFAR-10 dataset. This model consists of multiple convolutional layers, pooling layers, fully connected layers, and Dropout layers.
Multi-layer convolutional layer: In order to effectively extract local features from images, the model adopts a three-layer convolutional structure. The first convolutional layer uses 32 3x3 convolution kernels, while the second and third layers use 64 and 128 3x3 convolution kernels, respectively. The purpose of this multi-layer structure is to gradually extract low-level features such as edges and textures and then abstract higher-level features like shapes and patterns.
Pooling layer: After each convolutional layer, a max pooling layer is introduced to reduce the size of the feature map while preserving important features. This operation helps reduce computational complexity and improves the model's resistance to noise.
Fully connected layer: After the convolution and pooling operations, the model employs a fully connected layer with 128 neurons, responsible for mapping the extracted features to the classification space. The final output is produced using the softmax activation function, which assigns the features to one of the 10 categories.
Dropout layer: To prevent overfitting, a Dropout layer is added after the fully connected layer. By randomly discarding a portion of neurons during training, the Dropout layer enhances the model's generalization, making it more stable on the test set.
2.3. Hyperparameter Selection
In this study, two key hyperparameters were selected for experimentation: Learning Rate and Dropout Rate.
Learning rate: The learning rate determines the step size at which the model updates its weights during each iteration. To find the optimal learning rate, this study tested three learning rates: 0.01, 0.001, and 0.0001. A high learning rate can accelerate the convergence speed of the model, but it may cause the model to skip the global optimal solution and result in an unstable training process. A low learning rate can gradually converge the model, but the training time is longer. Through experimental comparison, selecting the optimal learning rate can ensure that the model achieves high accuracy within a reasonable time.
Dropout rate: The dropout rate determines the proportion of neurons in each layer that are randomly discarded during the training process. This study tested three different dropout rates: 0.3, 0.5, and 0.7. An appropriate dropout rate can effectively reduce overfitting and enhance the generalization ability of the model, but an excessively high dropout rate may lead to underfitting. Through experimental analysis, selecting an appropriate dropout rate helps balance the model's complexity and generalization ability [11].
2.4. Model Evaluation Method
In order to evaluate the impact of different learning rates and dropout rates on the performance of CNN models, the following evaluation metrics and methods were used in this study.
Accuracy. Accuracy is a measure of the proportion of correctly classified samples on a test set compared to the total number of samples. During the training process, the accuracy of the training and validation sets for each epoch is recorded to observe the performance of the model at different learning and dropout rates [10].
Loss Function. The Cross Entropy Loss function is used to measure the difference between model predictions and actual labels. The variation of the loss function reflects the convergence process of the model, where a lower loss value usually corresponds to a higher classification accuracy [11].
Training curve analysis. By plotting the accuracy and loss curves of the training and validation sets, the model's performance during the training process can be visually observed. By analyzing these curves, it is possible to determine whether the model exhibits overfitting or underfitting, and optimize the model by adjusting hyperparameters [12].
Comparison of final results. After the experiment, the model performance under different combinations of hyperparameters was summarized, and the final accuracy and loss values were compared through visualization methods such as bar charts to determine the optimal hyperparameter settings [13].
3. Analysis of experimental results
In this experiment, combination tests were conducted on three different learning rates (0.01, 0.001, 0.0001) and three different dropout rates (0.3, 0.5, 0.7), totaling 9 experiments. The following is a summary and analysis of all experimental results.
3.1. Experimental results with a learning rate of 0.01
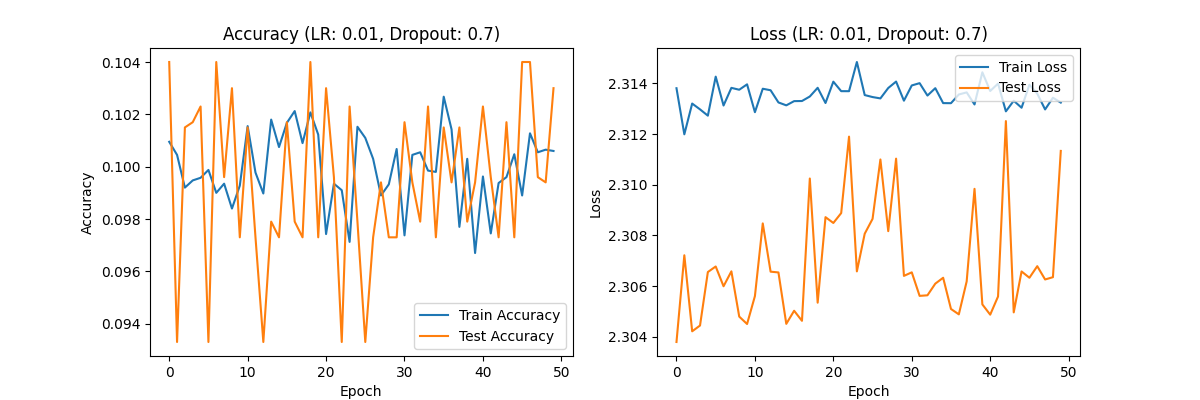
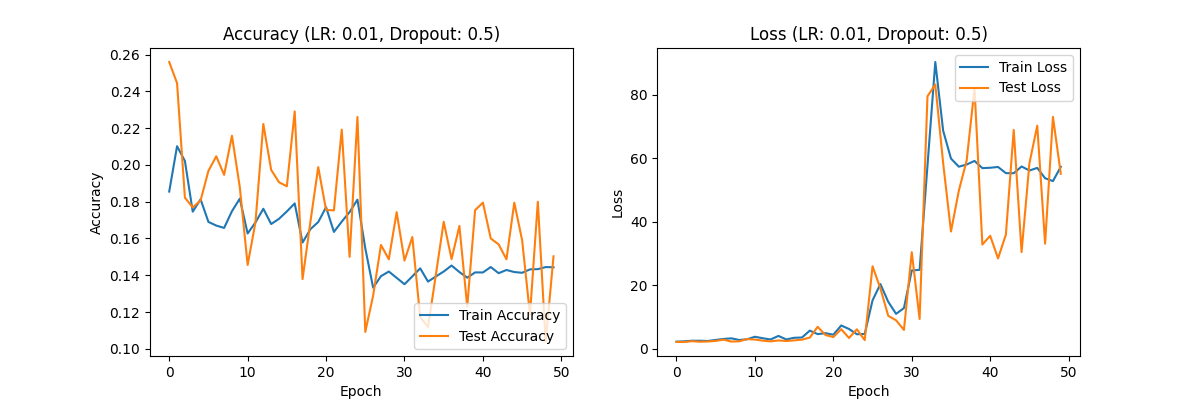
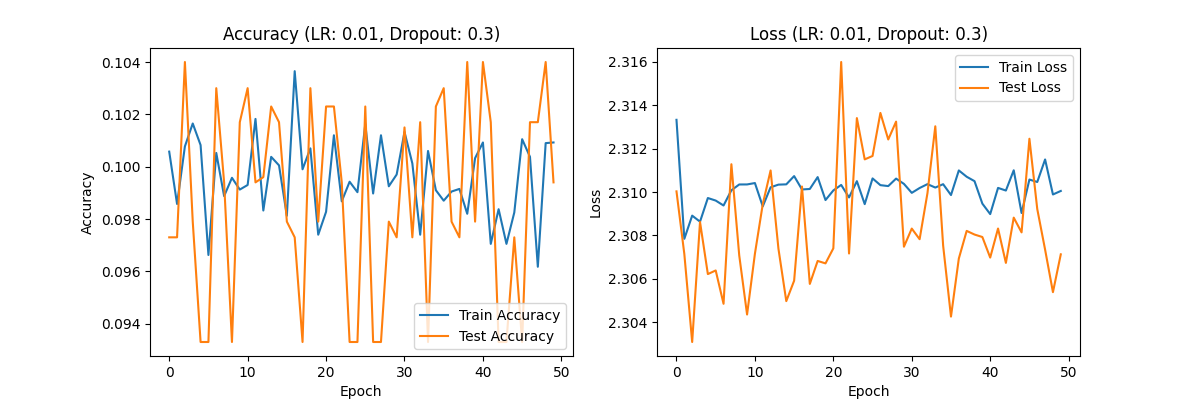
Figure 1. Accuracy (LR:0.01,Dropout:0.7) Loss(LR:0.01,Dropout:0.7) Accuracy (LR:0.01,Dropout:0.5) Loss(LR:0.01,Dropout:0.5) Accuracy (LR:0.01,Dropout:0.3) Loss(LR:0.01,Dropout:0.3)
Dropout rate of 0.3: The accuracy of the model fluctuates around 0.10, and the loss value curve shows severe fluctuations. The model cannot learn effectively and there is a serious underfitting phenomenon.
Dropout rate 0.5: The accuracy has slightly improved to 0.15-0.20, but the loss value shows a sharp increase in the later stages of training, indicating a contradiction between overfitting and underfitting in the model.
Dropout rate of 0.7: The accuracy has decreased again, but the loss value still fluctuates greatly, indicating that the excessively high Dropout rate weakens the learning ability of the model and fails to effectively improve its performance.
Analysis: A learning rate of 0.01 is too high for the CIFAR-10 dataset, causing the model to have a large stride in each iteration, unable to stably learn data features, and may even skip the global optimal solution. The overall performance of this experimental group was poor.
3.2. Experimental results with a learning rate of 0.001
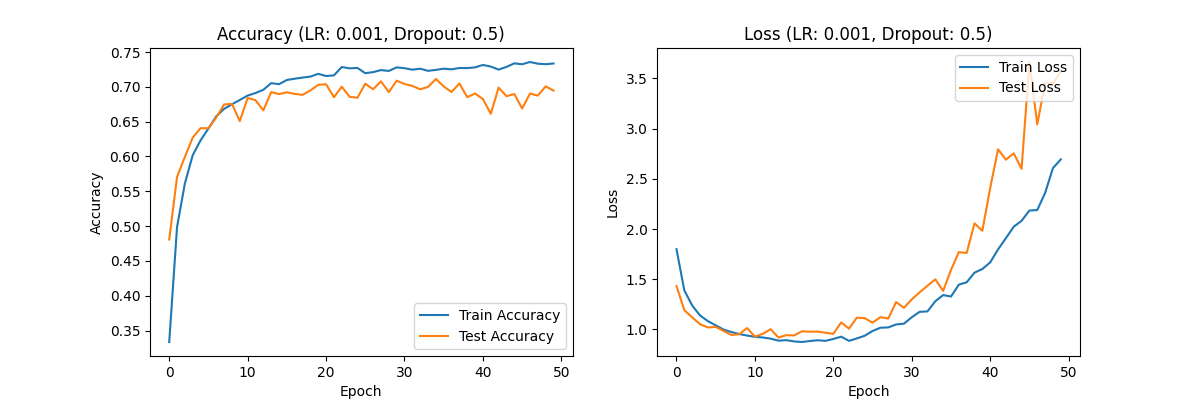
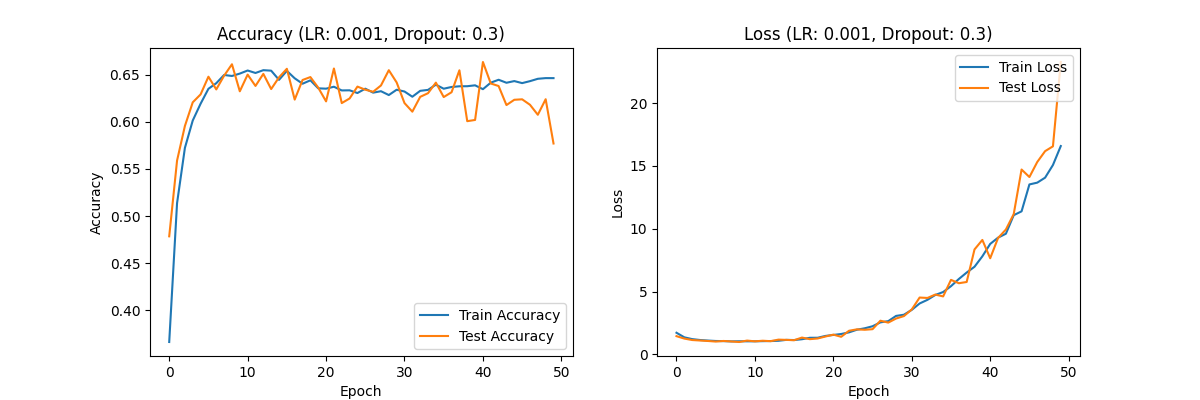
Figure 2. Accuracy (LR:0.001,Dropout:0.7) Loss(LR:0.001,Dropout:0.7) Accuracy (LR:0.001,Dropout:0.5) Loss(LR:0.001,Dropout:0.5) Accuracy (LR:0.001,Dropout:0.3) Loss(LR:0.001,Dropout:0.3)
Dropout rate of 0.3: The accuracy has significantly improved to about 0.65, and the loss value curve shows an increase in the later stages of training, indicating that the model has overfitting in the later stages.
Dropout rate of 0.5: The accuracy continues to improve to about 0.70, and the loss value curve shows better convergence. The overfitting phenomenon has been alleviated, and the model performance is relatively ideal.
Dropout rate of 0.7: The accuracy and loss values are relatively stable, but slightly underfitting. Despite this, the overall performance of the model is still better than the result with a learning rate of 0.01.
Analysis: A learning rate of 0.001 significantly improved the performance of the model, especially when the Dropout rate was 0.5, the model achieved good accuracy and loss values, indicating that under this configuration, the model can effectively learn and generalize, and the overfitting phenomenon is well controlled.
3.3. Experimental results with a learning rate of 0.0001
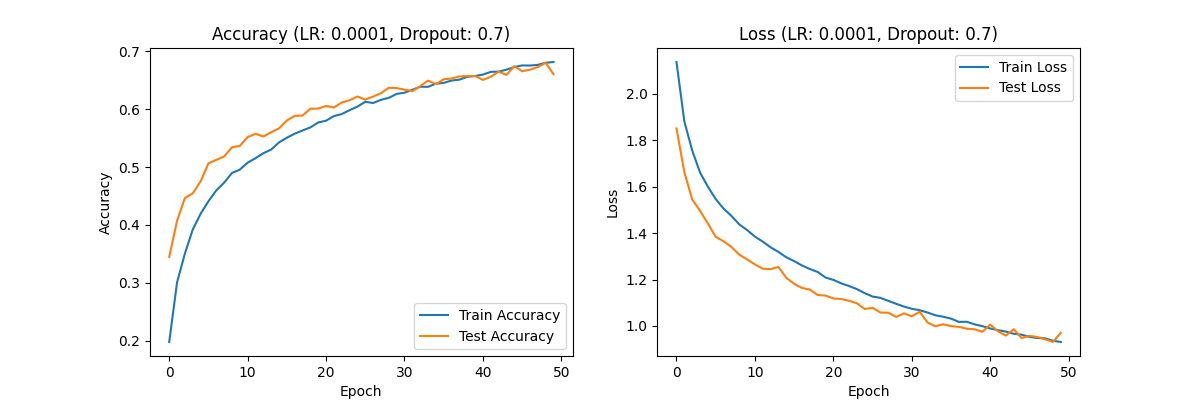
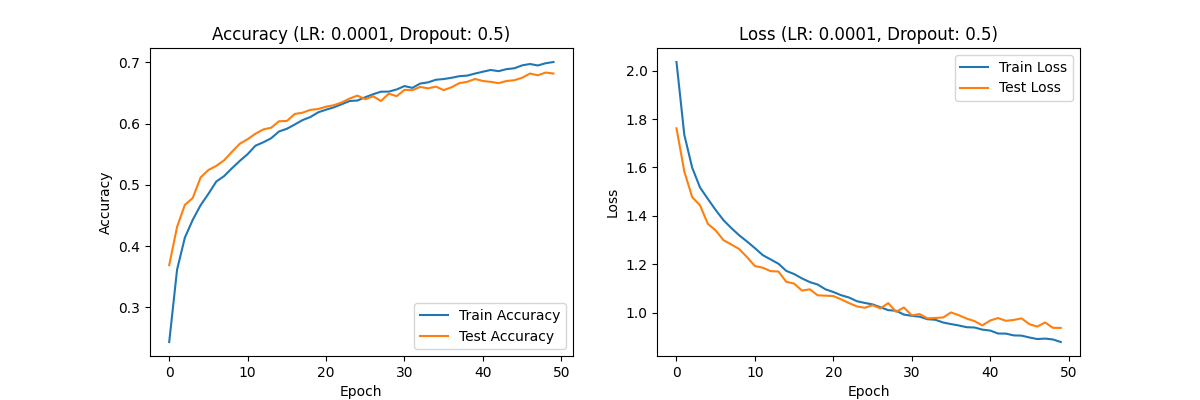
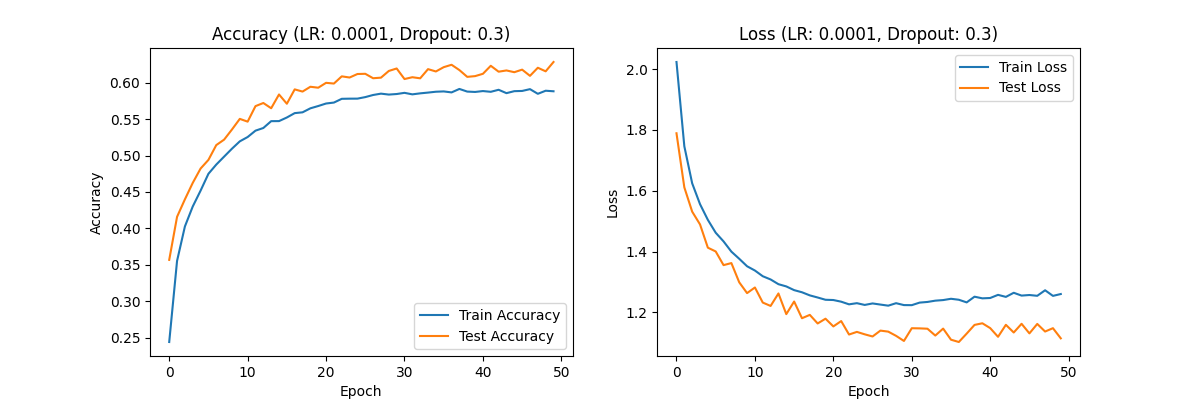
Figure 3. Accuracy (LR:0.00001,Dropout:0.7) Loss(LR:0.0001,Dropout:0.7) Accuracy (LR:0.0001,Dropout:0.5) Loss(LR:0.0001,Dropout:0.5) Accuracy (LR:0.0001,Dropout:0.3) Loss(LR:0.0001,Dropout:0.3)
Dropout rate 0.3: The accuracy reaches 0.60, and the loss value steadily decreases, indicating that the model can gradually learn data features, but the overall accuracy is low.
Dropout rate of 0.5: The accuracy is further improved to around 0.70, and the loss value shows a good convergence trend, indicating that the learning effect of the model is the best under this configuration.
Dropout rate 0.7: The accuracy and loss performance are similar to those of Dropout rate 0.5, but the overall performance is slightly weaker, and the model did not show significant overfitting during training.
Analysis: Combining a learning rate of 0.0001 with different dropout rates, especially a configuration of 0.5, enables the model to finely adjust weights and achieve good accuracy and loss values, indicating that the model performs best at this learning rate.
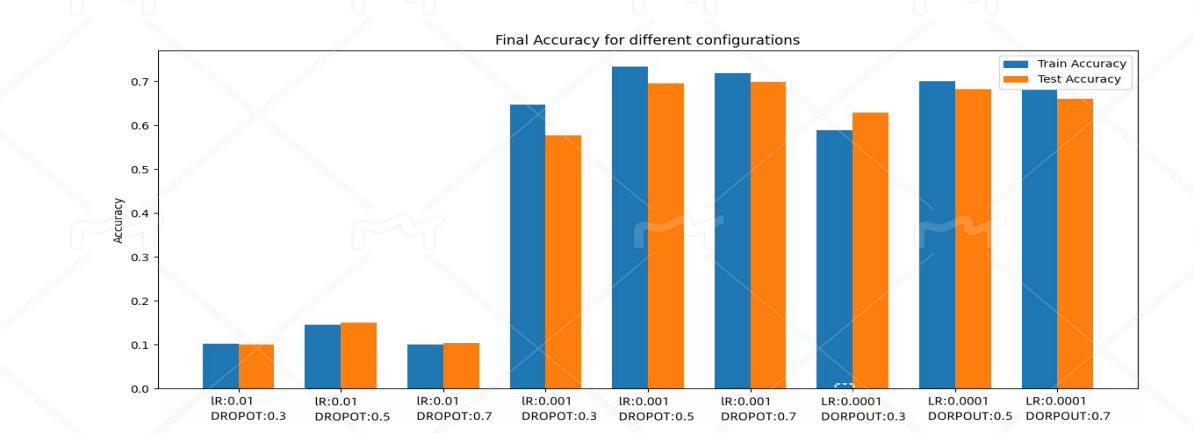
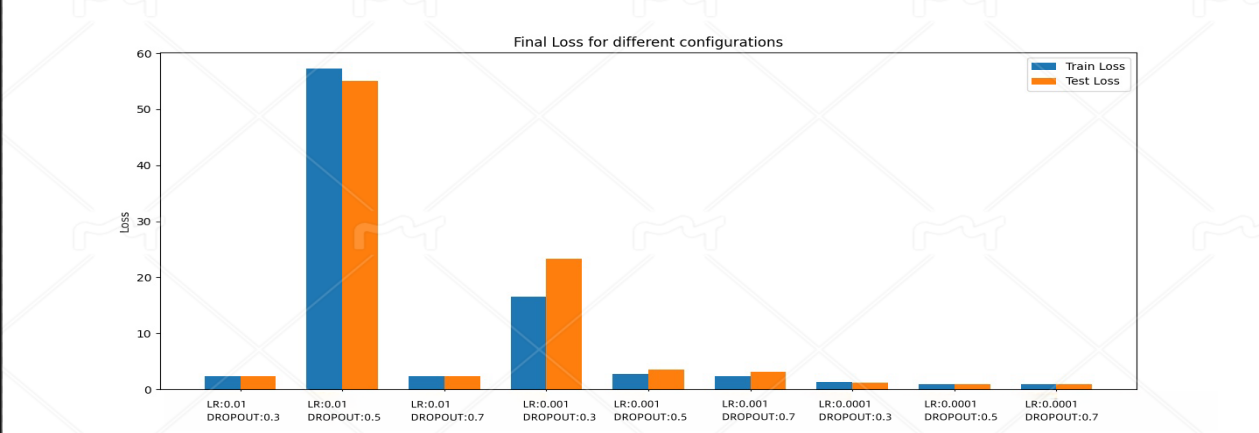
Figure 4. All accuracy and loss rates
By summarizing and analyzing the three sets of experiments, the following conclusions can be drawn:
The influence of learning rate: Learning rate has a significant impact on the convergence speed and final performance of the model. A high learning rate (0.01) leads to unstable performance of the model during training, making it difficult to learn effective features and resulting in severe underfitting. However, a low learning rate (0.0001) may allow for detailed adjustment of weights, but under certain configurations, it may result in slow model learning speed and limited accuracy improvement. A learning rate of 0.001 performed the best in the experiment, achieving a good balance between training time and model performance.
The impact of Dropout rate: The main function of Dropout rate is to prevent overfitting. A lower Dropout rate (0.3) can easily lead to overfitting in the later stages of the model, while a higher Dropout rate (0.7) may limit the model's learning ability and result in underfitting. The configuration with a Dropout rate of 0.5 exhibits good balancing ability at various learning rates, which can prevent overfitting without oversimplifying the model.
Optimal configuration: Taking into account all experimental results, the configuration with a learning rate of 0.001 combined with a Dropout rate of 0.5 performs the best. Under this configuration, the model can effectively learn the features of the CIFAR-10 dataset, with good accuracy and loss value performance, and no obvious overfitting or underfitting phenomena.
4. Discussion and Summary
4.1. Discussion on Model Performance
By analyzing the experimental results of different combinations of learning rates and dropout rates, it can be seen that these hyperparameters have a significant impact on the training performance of CNN models.
The impact of learning rate:
The role of learning rate in model training cannot be ignored. A learning rate that is too high (such as 0.01) may result in the model taking too large steps during training, skipping the global optimum, and even causing the model to fail to converge. In this experiment, the high learning rate resulted in severe underfitting, and the model failed to effectively learn the features of the dataset during the training process.
On the contrary, a low learning rate (such as 0.0001) can finely adjust model parameters, but it slows down the training speed to a certain extent, which may lead to long training time and the model cannot achieve ideal accuracy within a fixed number of training rounds. However, a low learning rate can effectively avoid oscillation problems, especially after long-term training, the model can achieve relatively good performance.
When the learning rate is 0.001, the model achieves a good balance between training speed and accuracy. This moderate learning rate allows the model to converge quickly while avoiding instability caused by significant weight updates.
The impact of Dropout rate:
Dropout, as a regularization method, mainly serves to prevent model overfitting. The experimental results showed that when the Dropout rate was 0.3, the model exhibited overfitting in the later stages of training. Although the loss value curve showed a good downward trend in the early stages, overfitting in the later stages led to a rebound in the loss value.
When the Dropout rate is 0.5, the model performs the best. At this point, the model can effectively prevent overfitting while maintaining high learning ability, significantly improving accuracy, and the loss curve also shows good convergence.
When the Dropout rate increases to 0.7, the learning ability of the model is suppressed, exhibiting a certain degree of underfitting. This indicates that although a high dropout rate can further prevent overfitting, it may also lead to a decrease in the model's learning ability, especially when the training data is complex and the model struggles to capture sufficient feature information.
4.2. Summary of Optimal Configuration
Based on the results of the three experiments, the combination of a learning rate of 0.001 and a Dropout rate of 0.5 performed the best in this experiment. Under this configuration, the model can achieve high accuracy within a limited training time and effectively control overfitting, making the performance of the model on the test set similar to that on the training set. This indicates that a moderate learning rate combined with a reasonable dropout rate can enable the model to exhibit good generalization ability in deep learning tasks, making it suitable for processing datasets such as CIFAR-10 with multiple categories and low resolution images.
4.3. limitations
Despite the positive results achieved in this study, there are several limitations that should be acknowledged. First, the experiments were conducted using only the CIFAR-10 dataset, which consists of relatively small and low-resolution images. The findings may not generalize well to larger and more complex datasets. Second, the experiments were limited to only two hyperparameters—learning rate and dropout rate—while other important hyperparameters, such as batch size or optimizer type, were kept constant. Further tuning of these parameters could provide additional insights. Finally, due to computational limitations, the number of training epochs was restricted, which might have impacted the model's ability to fully converge, especially for lower learning rates.
4.4. Suggestions for Future Work
Although this experiment achieved good results, there are still some aspects that deserve further research and improvement:
Further optimization of hyperparameters: Automated tuning tools such as Grid Search, Random Search, or Bayesian Optimization can be considered to further optimize the selection of learning rate and dropout rate, in order to find potentially better combinations of hyperparameters.
Increasing the number of training epochs: Due to the low learning rate, the model may not fully converge within a limited number of training epochs. In the future, the number of training epochs can be increased to observe further performance of the model.
Introducing other regularization methods: In addition to Dropout, other regularization methods such as L2 regularization, Batch Normalization, etc. can also be attempted to further enhance the model's generalization ability.
Extended data augmentation techniques: In this experiment, data augmentation techniques were not used. In the future, data augmentation methods such as random cropping, rotation, and color jitter can be considered to improve the robustness of the model.
5. Conclusion
This experiment validated the importance of hyperparameters in deep learning models by testing different combinations of learning rates and dropout rates. Moderate learning rate and reasonable dropout rate can not only improve the learning efficiency of the model, but also effectively prevent overfitting, enabling the model to achieve good generalization performance on the test set. The experimental results indicate that the combination of a learning rate of 0.001 and a Dropout rate of 0.5 is the optimal configuration for this experiment, which can provide valuable references for subsequent research and practical applications.
References
[1]. Krizhevsky, A., Sutskever, I., & Hinton, G. E. (2012). ImageNet classification with deep convolutional neural networks. Advances in neural information processing systems, 25.
[2]. LeCun, Y., Bengio, Y., & Hinton, G. (2015). Deep learning. Nature, 521(7553), 436-444.
[3]. Goodfellow, I., Bengio, Y., & Courville, A. (2016). Deep learning. MIT press.
[4]. Kingma, D. P., & Ba, J. (2014). Adam: A method for stochastic optimization. arXiv preprint arXiv:1412.6980.
[5]. Srivastava, N., Hinton, G., Krizhevsky, A., Sutskever, I., & Salakhutdinov, R. (2014). Dropout: A simple way to prevent neural networks from overfitting. The journal of machine learning research, 15(1), 1929-1958.
[6]. Gal, Y., & Ghahramani, Z. (2016). Dropout as a Bayesian approximation: Representing model uncertainty in deep learning. In international conference on machine learning (pp. 1050-1059).
[7]. Krizhevsky, A., & Hinton, G. (2009). Learning multiple layers of features from tiny images (Vol. 1, No. 4, p. 7).
[8]. He, K., Zhang, X., Ren, S., & Sun, J. (2016). Deep residual learning for image recognition. In Proceedings of the IEEE conference on computer vision and pattern recognition (pp. 770-778).
[9]. Ioffe, S., & Szegedy, C. (2015). Batch normalization: Accelerating deep network training by reducing internal covariate shift. In International conference on machine learning (pp. 448-456).
[10]. Zagoruyko, S., & Komodakis, N. (2016). Wide residual networks. In Proceedings of the British Machine Vision Conference (BMVC), (Vol. 1, No. 2, p. 3).
[11]. Lin, M., Chen, Q., & Yan, S. (2013). Network in network. arXiv preprint arXiv:1312.4400.
[12]. Huang, G., Liu, Z., Van Der Maaten, L., & Weinberger, K. Q. (2017). Densely connected convolutional networks. In Proceedings of the IEEE conference on computer vision and pattern recognition (pp. 4700-4708).
[13]. Simonyan, K., & Zisserman, A. (2014). Very deep convolutional networks for large-scale image recognition. arXiv preprint arXiv:1409.1556.
Cite this article
Peng,C. (2024). Comprehensive Analysis of the Impact of Learning Rate and Dropout Rate on the Performance of Convolutional Neural Networks on the CIFAR-10 Dataset. Applied and Computational Engineering,102,183-192.
Data availability
The datasets used and/or analyzed during the current study will be available from the authors upon reasonable request.
Disclaimer/Publisher's Note
The statements, opinions and data contained in all publications are solely those of the individual author(s) and contributor(s) and not of EWA Publishing and/or the editor(s). EWA Publishing and/or the editor(s) disclaim responsibility for any injury to people or property resulting from any ideas, methods, instructions or products referred to in the content.
About volume
Volume title: Proceedings of the 2nd International Conference on Machine Learning and Automation
© 2024 by the author(s). Licensee EWA Publishing, Oxford, UK. This article is an open access article distributed under the terms and
conditions of the Creative Commons Attribution (CC BY) license. Authors who
publish this series agree to the following terms:
1. Authors retain copyright and grant the series right of first publication with the work simultaneously licensed under a Creative Commons
Attribution License that allows others to share the work with an acknowledgment of the work's authorship and initial publication in this
series.
2. Authors are able to enter into separate, additional contractual arrangements for the non-exclusive distribution of the series's published
version of the work (e.g., post it to an institutional repository or publish it in a book), with an acknowledgment of its initial
publication in this series.
3. Authors are permitted and encouraged to post their work online (e.g., in institutional repositories or on their website) prior to and
during the submission process, as it can lead to productive exchanges, as well as earlier and greater citation of published work (See
Open access policy for details).
References
[1]. Krizhevsky, A., Sutskever, I., & Hinton, G. E. (2012). ImageNet classification with deep convolutional neural networks. Advances in neural information processing systems, 25.
[2]. LeCun, Y., Bengio, Y., & Hinton, G. (2015). Deep learning. Nature, 521(7553), 436-444.
[3]. Goodfellow, I., Bengio, Y., & Courville, A. (2016). Deep learning. MIT press.
[4]. Kingma, D. P., & Ba, J. (2014). Adam: A method for stochastic optimization. arXiv preprint arXiv:1412.6980.
[5]. Srivastava, N., Hinton, G., Krizhevsky, A., Sutskever, I., & Salakhutdinov, R. (2014). Dropout: A simple way to prevent neural networks from overfitting. The journal of machine learning research, 15(1), 1929-1958.
[6]. Gal, Y., & Ghahramani, Z. (2016). Dropout as a Bayesian approximation: Representing model uncertainty in deep learning. In international conference on machine learning (pp. 1050-1059).
[7]. Krizhevsky, A., & Hinton, G. (2009). Learning multiple layers of features from tiny images (Vol. 1, No. 4, p. 7).
[8]. He, K., Zhang, X., Ren, S., & Sun, J. (2016). Deep residual learning for image recognition. In Proceedings of the IEEE conference on computer vision and pattern recognition (pp. 770-778).
[9]. Ioffe, S., & Szegedy, C. (2015). Batch normalization: Accelerating deep network training by reducing internal covariate shift. In International conference on machine learning (pp. 448-456).
[10]. Zagoruyko, S., & Komodakis, N. (2016). Wide residual networks. In Proceedings of the British Machine Vision Conference (BMVC), (Vol. 1, No. 2, p. 3).
[11]. Lin, M., Chen, Q., & Yan, S. (2013). Network in network. arXiv preprint arXiv:1312.4400.
[12]. Huang, G., Liu, Z., Van Der Maaten, L., & Weinberger, K. Q. (2017). Densely connected convolutional networks. In Proceedings of the IEEE conference on computer vision and pattern recognition (pp. 4700-4708).
[13]. Simonyan, K., & Zisserman, A. (2014). Very deep convolutional networks for large-scale image recognition. arXiv preprint arXiv:1409.1556.