


1. Introduction
For the deaf and hard of hearing community—which, according to the World Health Organization, makes up around 5% of the world's population—sign language is an essential form of communication [1]. This corresponds to more than 70 million individuals who use sign language as their main form of communication [2]. The importance of sign language extends beyond the deaf community, as it plays a crucial role in inclusive education, emergency services, and social interactions. The creation of precise sign language recognition systems has grown in importance as a result of the growing integration of technology into daily life. These systems provide a link between the hearing and deaf populations.
Deep Learning (DL) and Convolutional Neural Networks (CNNs) have shown impressive results in a variety of computer vision applications, such as sign language detection [3]. These techniques have outperformed more conventional vector machine-based methods, mostly because of their capacity to automatically identify and extract hierarchical characteristics from unprocessed data [4]. Since CNNs were introduced, the accuracy of sign language recognition has significantly improved, which can effectively capture the spatial hierarchies in sign language movements [5].
Past research has primarily focused on developing complex CNN architectures to enhance recognition rates. For instance, studies have explored the use of deeper networks, wider networks, and various regularization techniques to improve performance. However, Nonetheless, a still untapped topic is the comparison of various CNN models on the same sign language identification problem [6]. The purpose of this work is to close this gap by examining how different CNN architectures perform in terms of identifying signals in American Sign Language (ASL).
This study introduces a comparative analysis of multiple CNN models, including ResNet, LeNet, and other convolutional neural networks, on a standardized dataset of ASL signs. This work emphasizes the importance of understanding how different architectural choices impact the recognition accuracy and computational efficiency. This research advances the area of sign language recognition while also shedding light on how well CNN models generalize to other challenges.
2. Method
2.1. Dataset and preprocessing
Sign Language MNIST is used as the dataset. It is a contemporary reimagination of the classic MNIST, focusing on ASL gestures instead of handwritten digits [7]. It features 24 classes of ASL letters, each represented by 28x28 grayscale images. Designed for advancing computer vision techniques, particularly CNNs, the dataset stands out for its rigorous preprocessing. It is a powerful tool for gesture recognition research and applications since it can crop, grayscale, resize, and amplify images using filters, pixelation, brightness/contrast modifications, and rotations.
The dimensionality of these datasets was then determined using the shape attribute, revealing that each dataset contained 7,995 instances with 785 features, where the first 784 features correspond to pixel intensities and the last feature represents the class label indicating the sign language letter. To meet the input requirements of convolutional neural networks, which necessitate three-dimensional image data, the feature matrices were reshaped to include an additional dimension for the channel, resulting in a shape of (images, height, width, channels).
2.2. Model architecture
Three different neural network models were used in this study to tackle the issue of ASL recognition: a basic CNN model, a modified ResNet-50 model, and a classic LeNet-5 model. Each model was tailored and optimized for the specific characteristics of sign language recognition. In addition to this, this work also performed batch normalization on the three models, which led to a faster convergence rate of the models, simultaneously, the batch normalization acts as a regularization to a certain extent, which helps to reduce the overfitting phenomenon of the models.
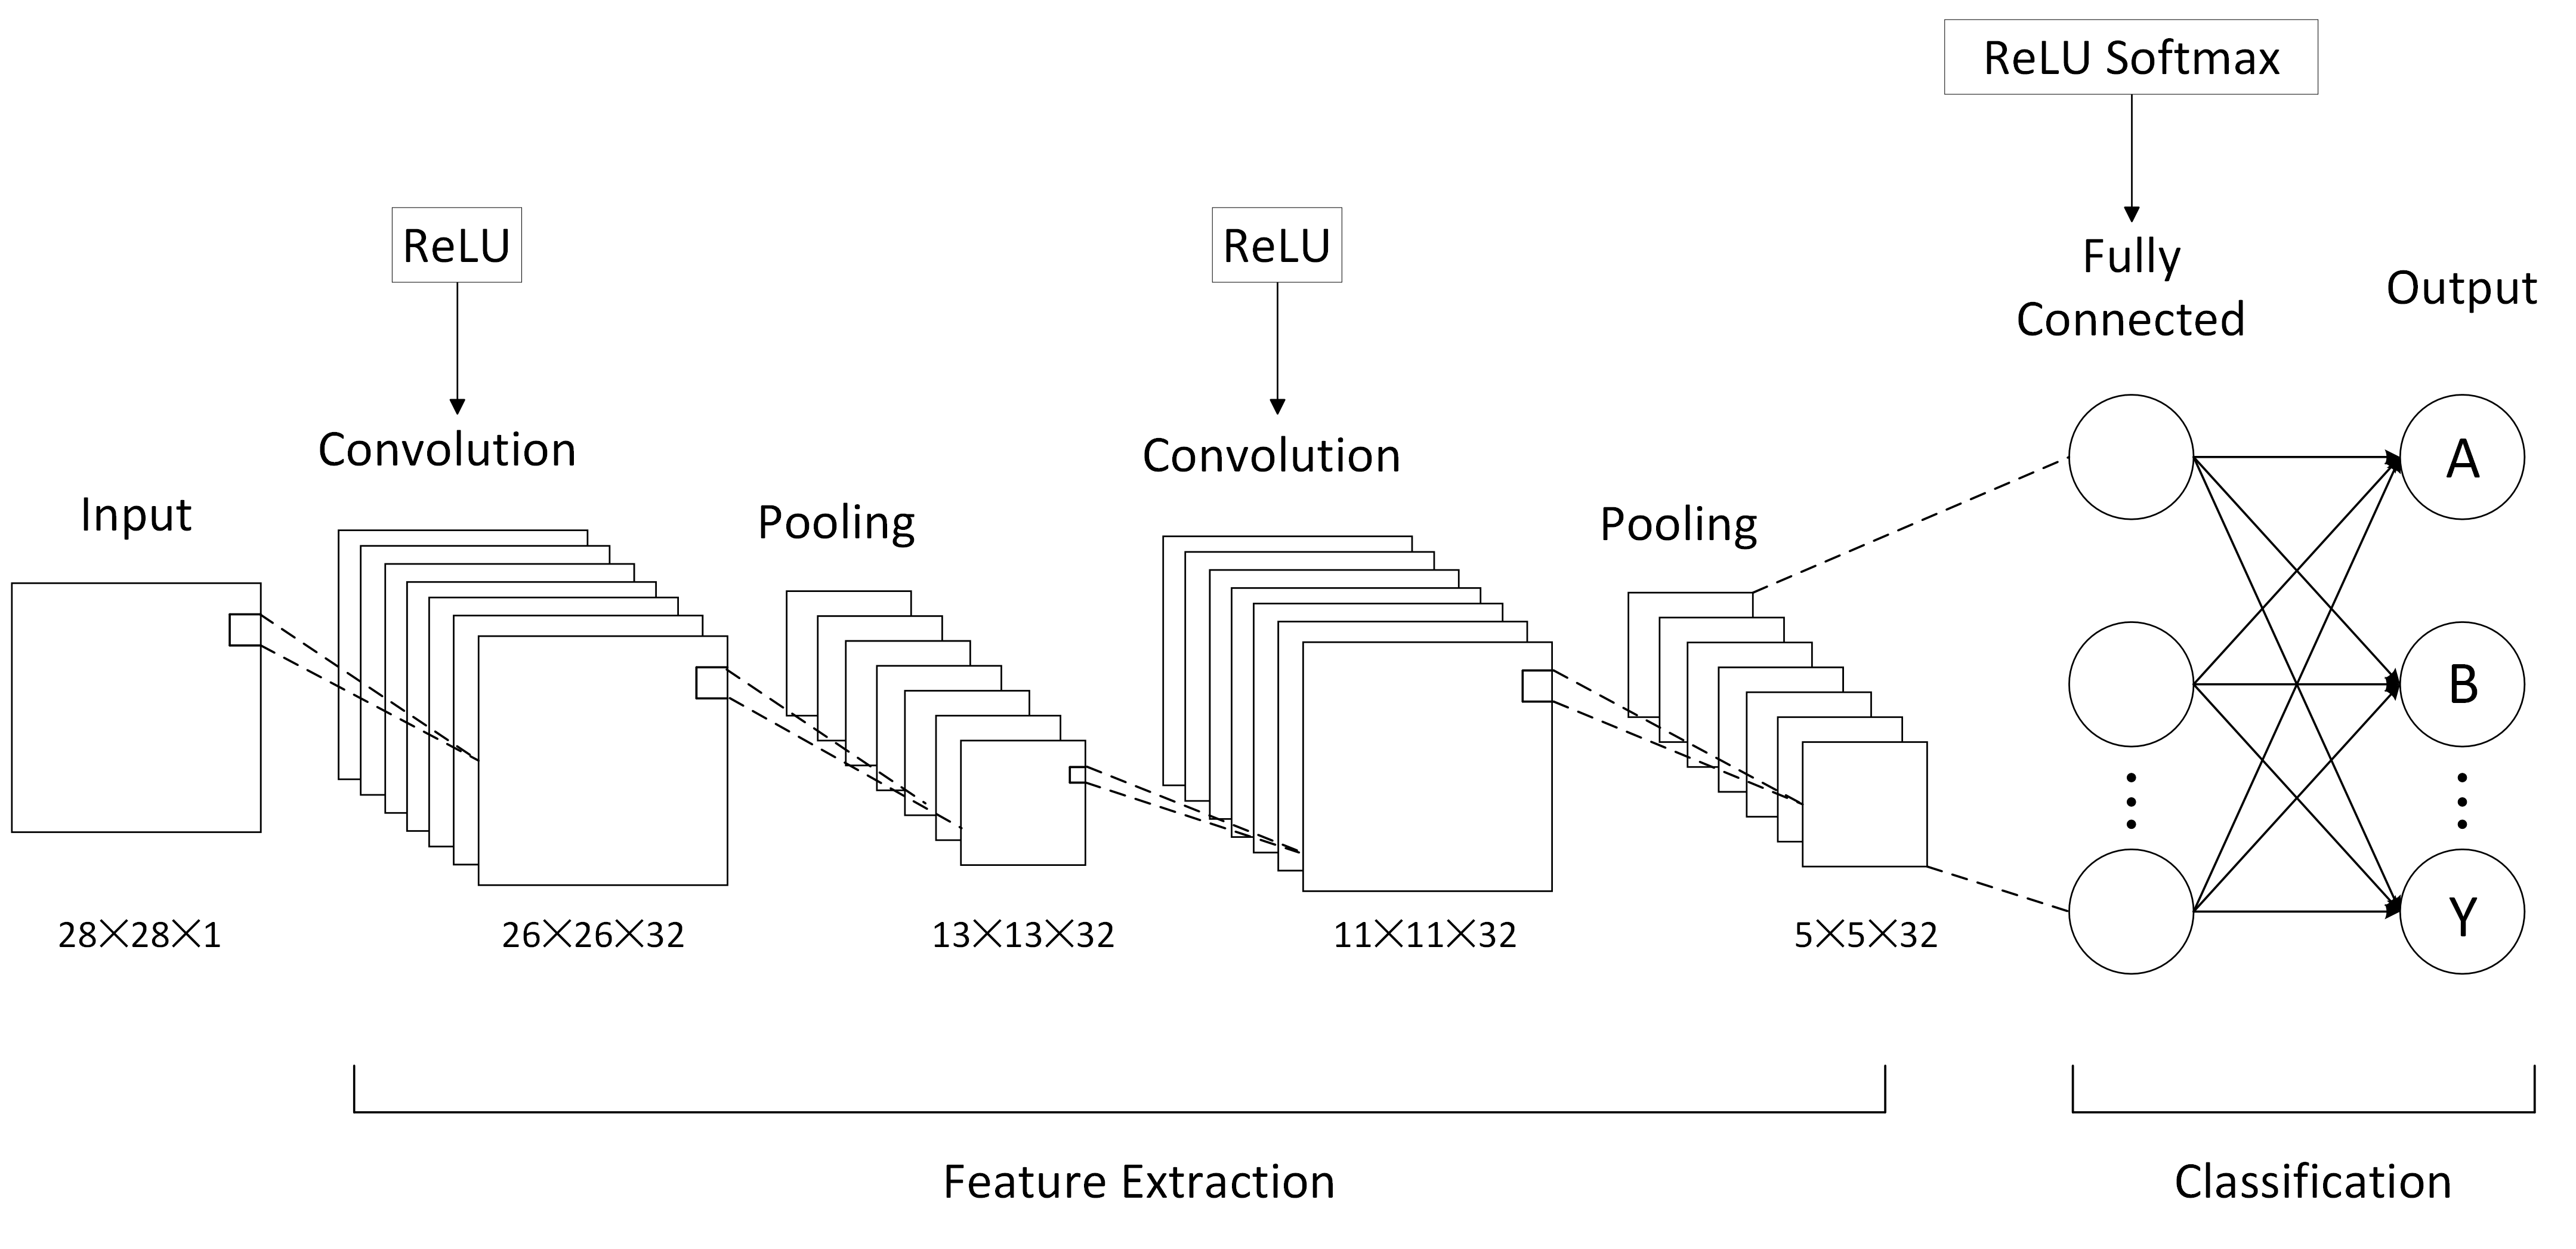
Multiple convolutional and fully connected layers make up the Basic CNN Model, which is intended to extract essential information from images of sign language. As shown in Figure 1, this model starts with grayscale images of size 28 by 28 pixels and goes through several convolutional and pooling layers before reaching fully connected layers that produce predictions for 26 different categories.
The Modified ResNet-50 Model incorporates residual learning to enhance the training efficiency and performance of deep networks [8]. By stacking numerous convolutional and identity blocks, the model significantly increases network depth while mitigating the vanishing gradient problem through skip connections. This work adapted the original ResNet-50 architecture to suit the smaller ASL dataset, including adjustments to the network's input and output layers.
The LeNet-5 Model, which consists of two convolutional layers, two pooling layers, and three fully connected layers, was chosen because to its simplicity and efficacy [9]. The design focus of LeNet-5 lies in its ability to swiftly learn image features while maintaining low computational complexity. This work retained the core architecture of LeNet-5, making appropriate adjustments for the sign language dataset.
| |
Figure 1. Architecture of basic CNN (figure credit: original). | |
Sparse categorical cross-entropy was used as the loss function while training all models using the Adam optimizer, which was appropriate for the multi-class sign language recognition challenge [10]. Throughout the training process, each model underwent an equal number of training epochs, using the same batch size, and were run on identical hardware configurations to ensure fairness and comparability of the experimental results.
2.3. Evaluation Metrics
The accuracy and effectiveness of the predictions were evaluated quantitatively using the following metrics to gauge the model's performance:
Accuracy: This statistic, which shows the percentage of properly predicted occurrences relative to the total number of examples, is a basic measurement in classification tasks. It gives a clear indicator of the general accuracy of the model.
Loss Function: The operator function called the loss function is used to quantify the degree to which the true values and the predicted values of the model deviate from each other. It serves as a key differentiator during the training phase, guiding the optimization process to minimize this difference.
Confusion Matrix: In a classification model, a confusion matrix is a visualization table that counts the number of observations categorized in the incorrect category and the correct category and shows the results separately. The real category of the data is represented by each row in the confusion matrix, while the anticipated category is represented by each column.
3. Results
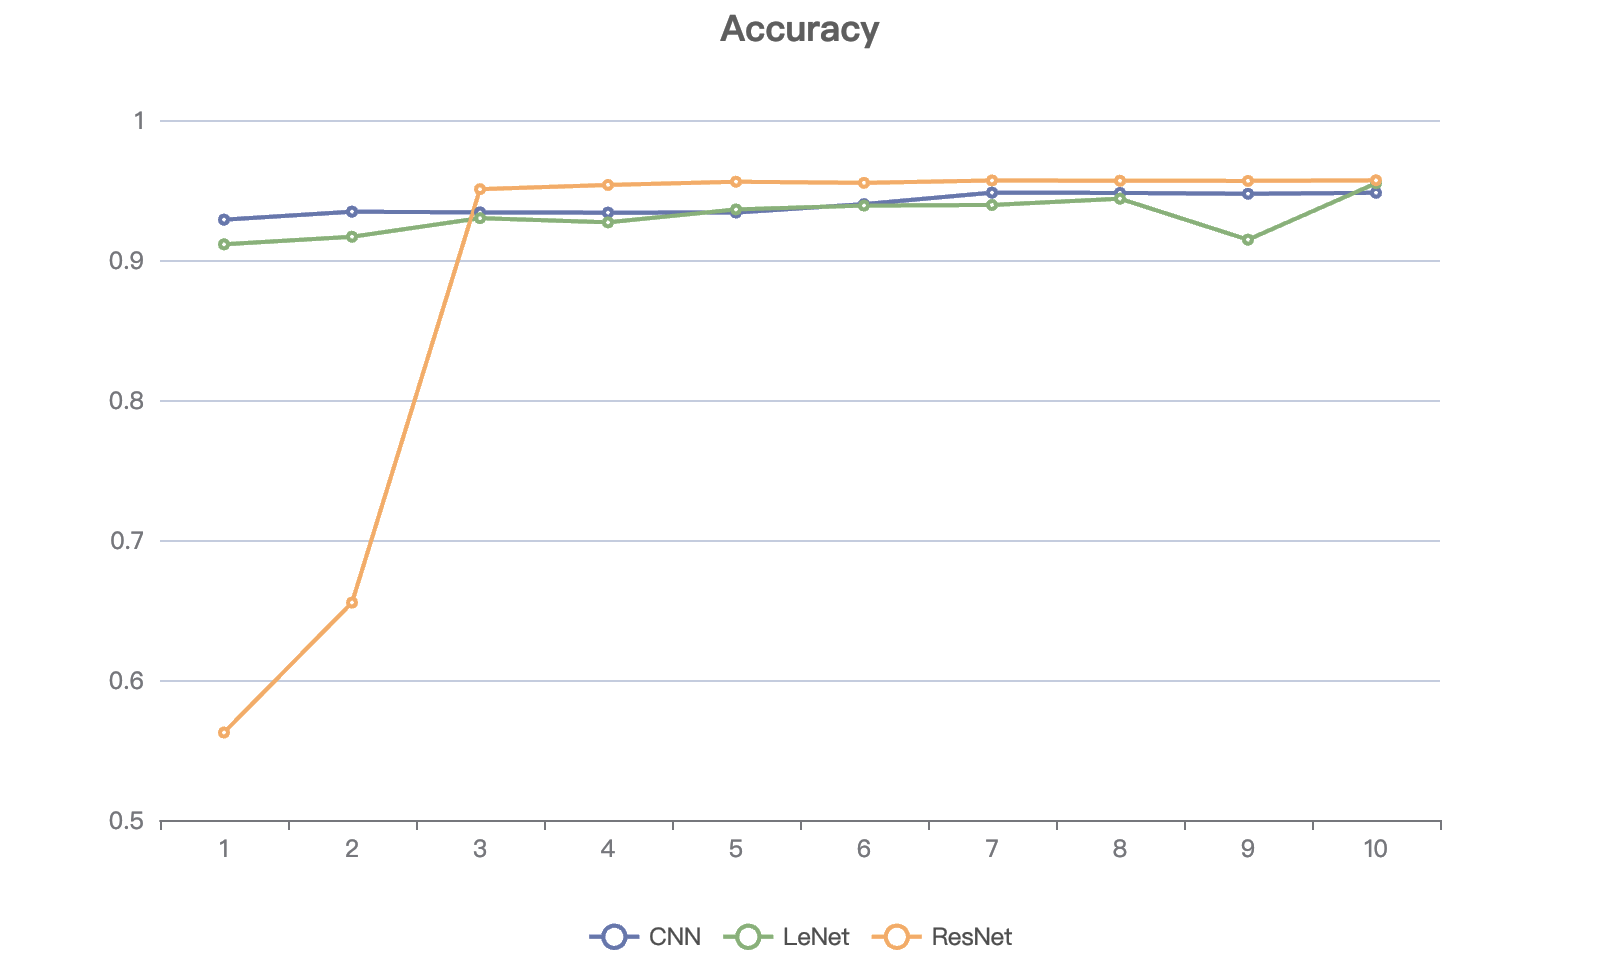
After conducting 10 epochs for each model, a comparative analysis of the metrics was performed to evaluate their performance. The outcomes are illustrated in Figure 2 and Figure 3:
This study presents an exhaustive comparative analysis of the accuracy and loss metrics of three architectures, Basic CNN, LeNet and ResNet, after 10 epochs. By comparing the performance metrics of these models, the purpose of this work is to evaluate several network designs for image recognition tasks in terms of accuracy and efficiency.
In terms of accuracy, ResNet shows excellent performance in some training cycles, with its accuracy above 95% up to 95.69% in the third epoch (95.06%) and beyond, but its accuracy fluctuates greatly at the beginning of training, reflecting the relative instability of the model. In contrast, CNN and LeNet are slightly less accurate, but the highest accuracy rate still reaches 94.81% and 95.48% respectively, showing good recognition performance. It is worth noting that the accuracy of CNN fluctuates less during the training cycle, indicating that throughout training, the model is more stable.
|
| |
Figure 2. Accuracy of different models during training (Figure credit: original). | Figure 3. Loss of different models during training (Figure credit: original). |
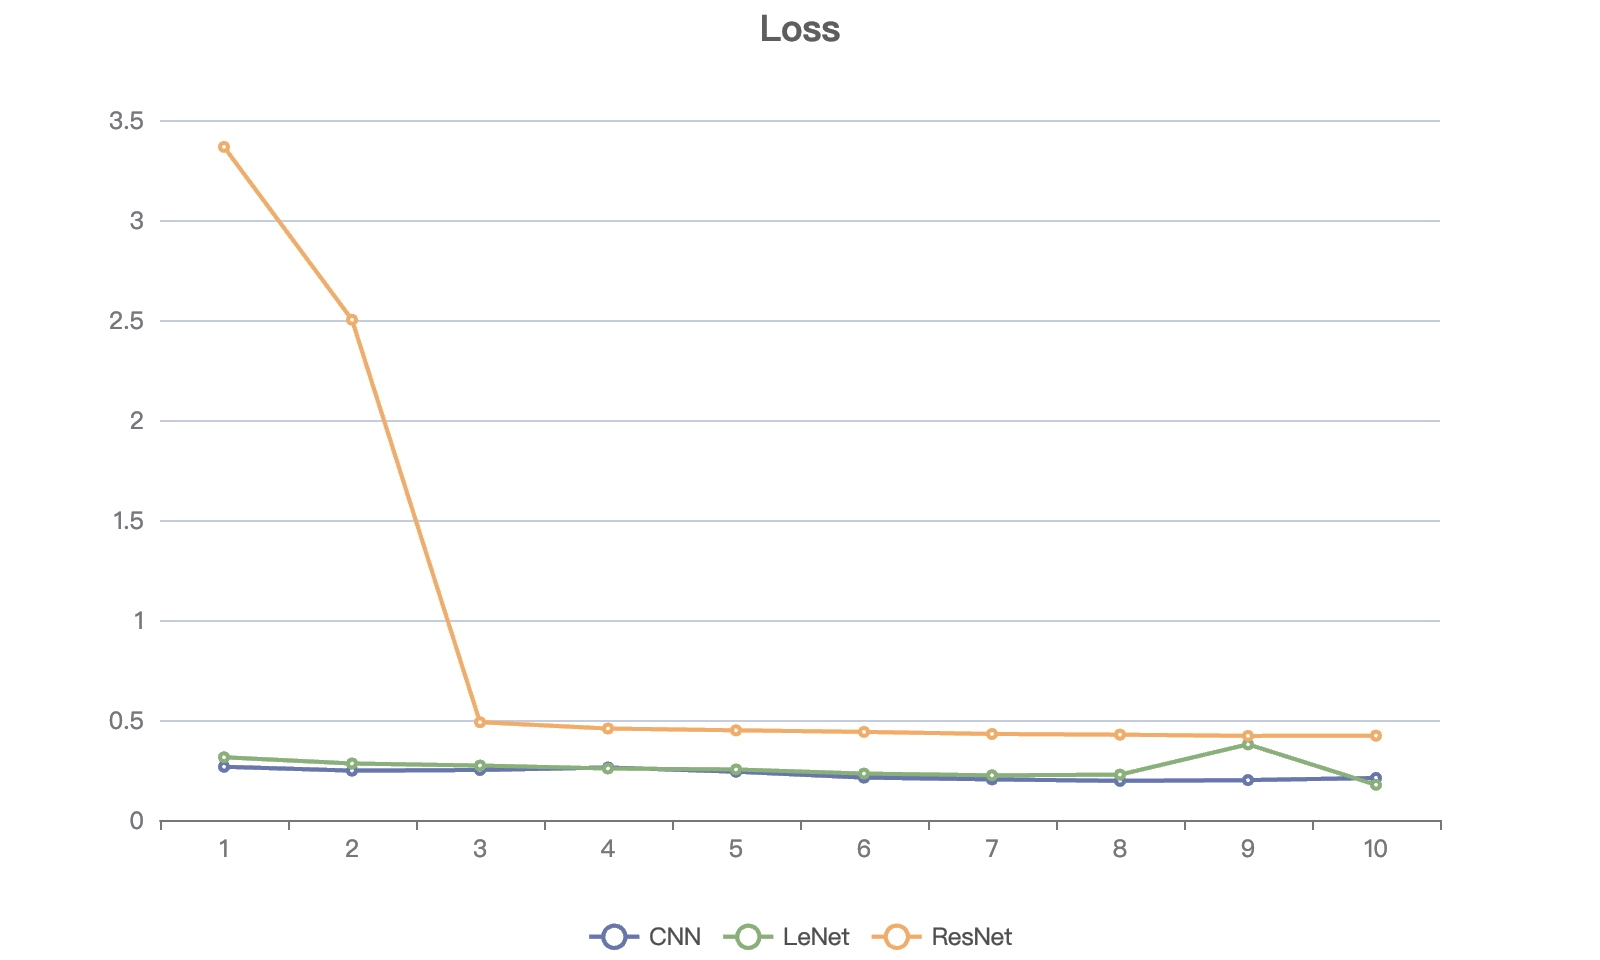
In terms of loss metrics, ResNet shows a large range of fluctuations, ranging from 3.3655 to 0.4205. This variation shows how sensitive the model is to the loss function during training, and further adjustment of the learning rate and other hyperparameters may be required to optimize performance. For the two models, LeNet and CNN, which have low and stable loss values, they show high efficiency in the training process.
In addition to this, the confusion matrices corresponding to the three models were generated, as demonstrated as seen, respectively, in Figure 4, Figure 5, and Figure 6.
|
| |
Figure 4. Confusion matrix of basic CNN model (Figure credit: original). | Figure 5. Confusion matrix of LeNet model (Figure credit: original). |
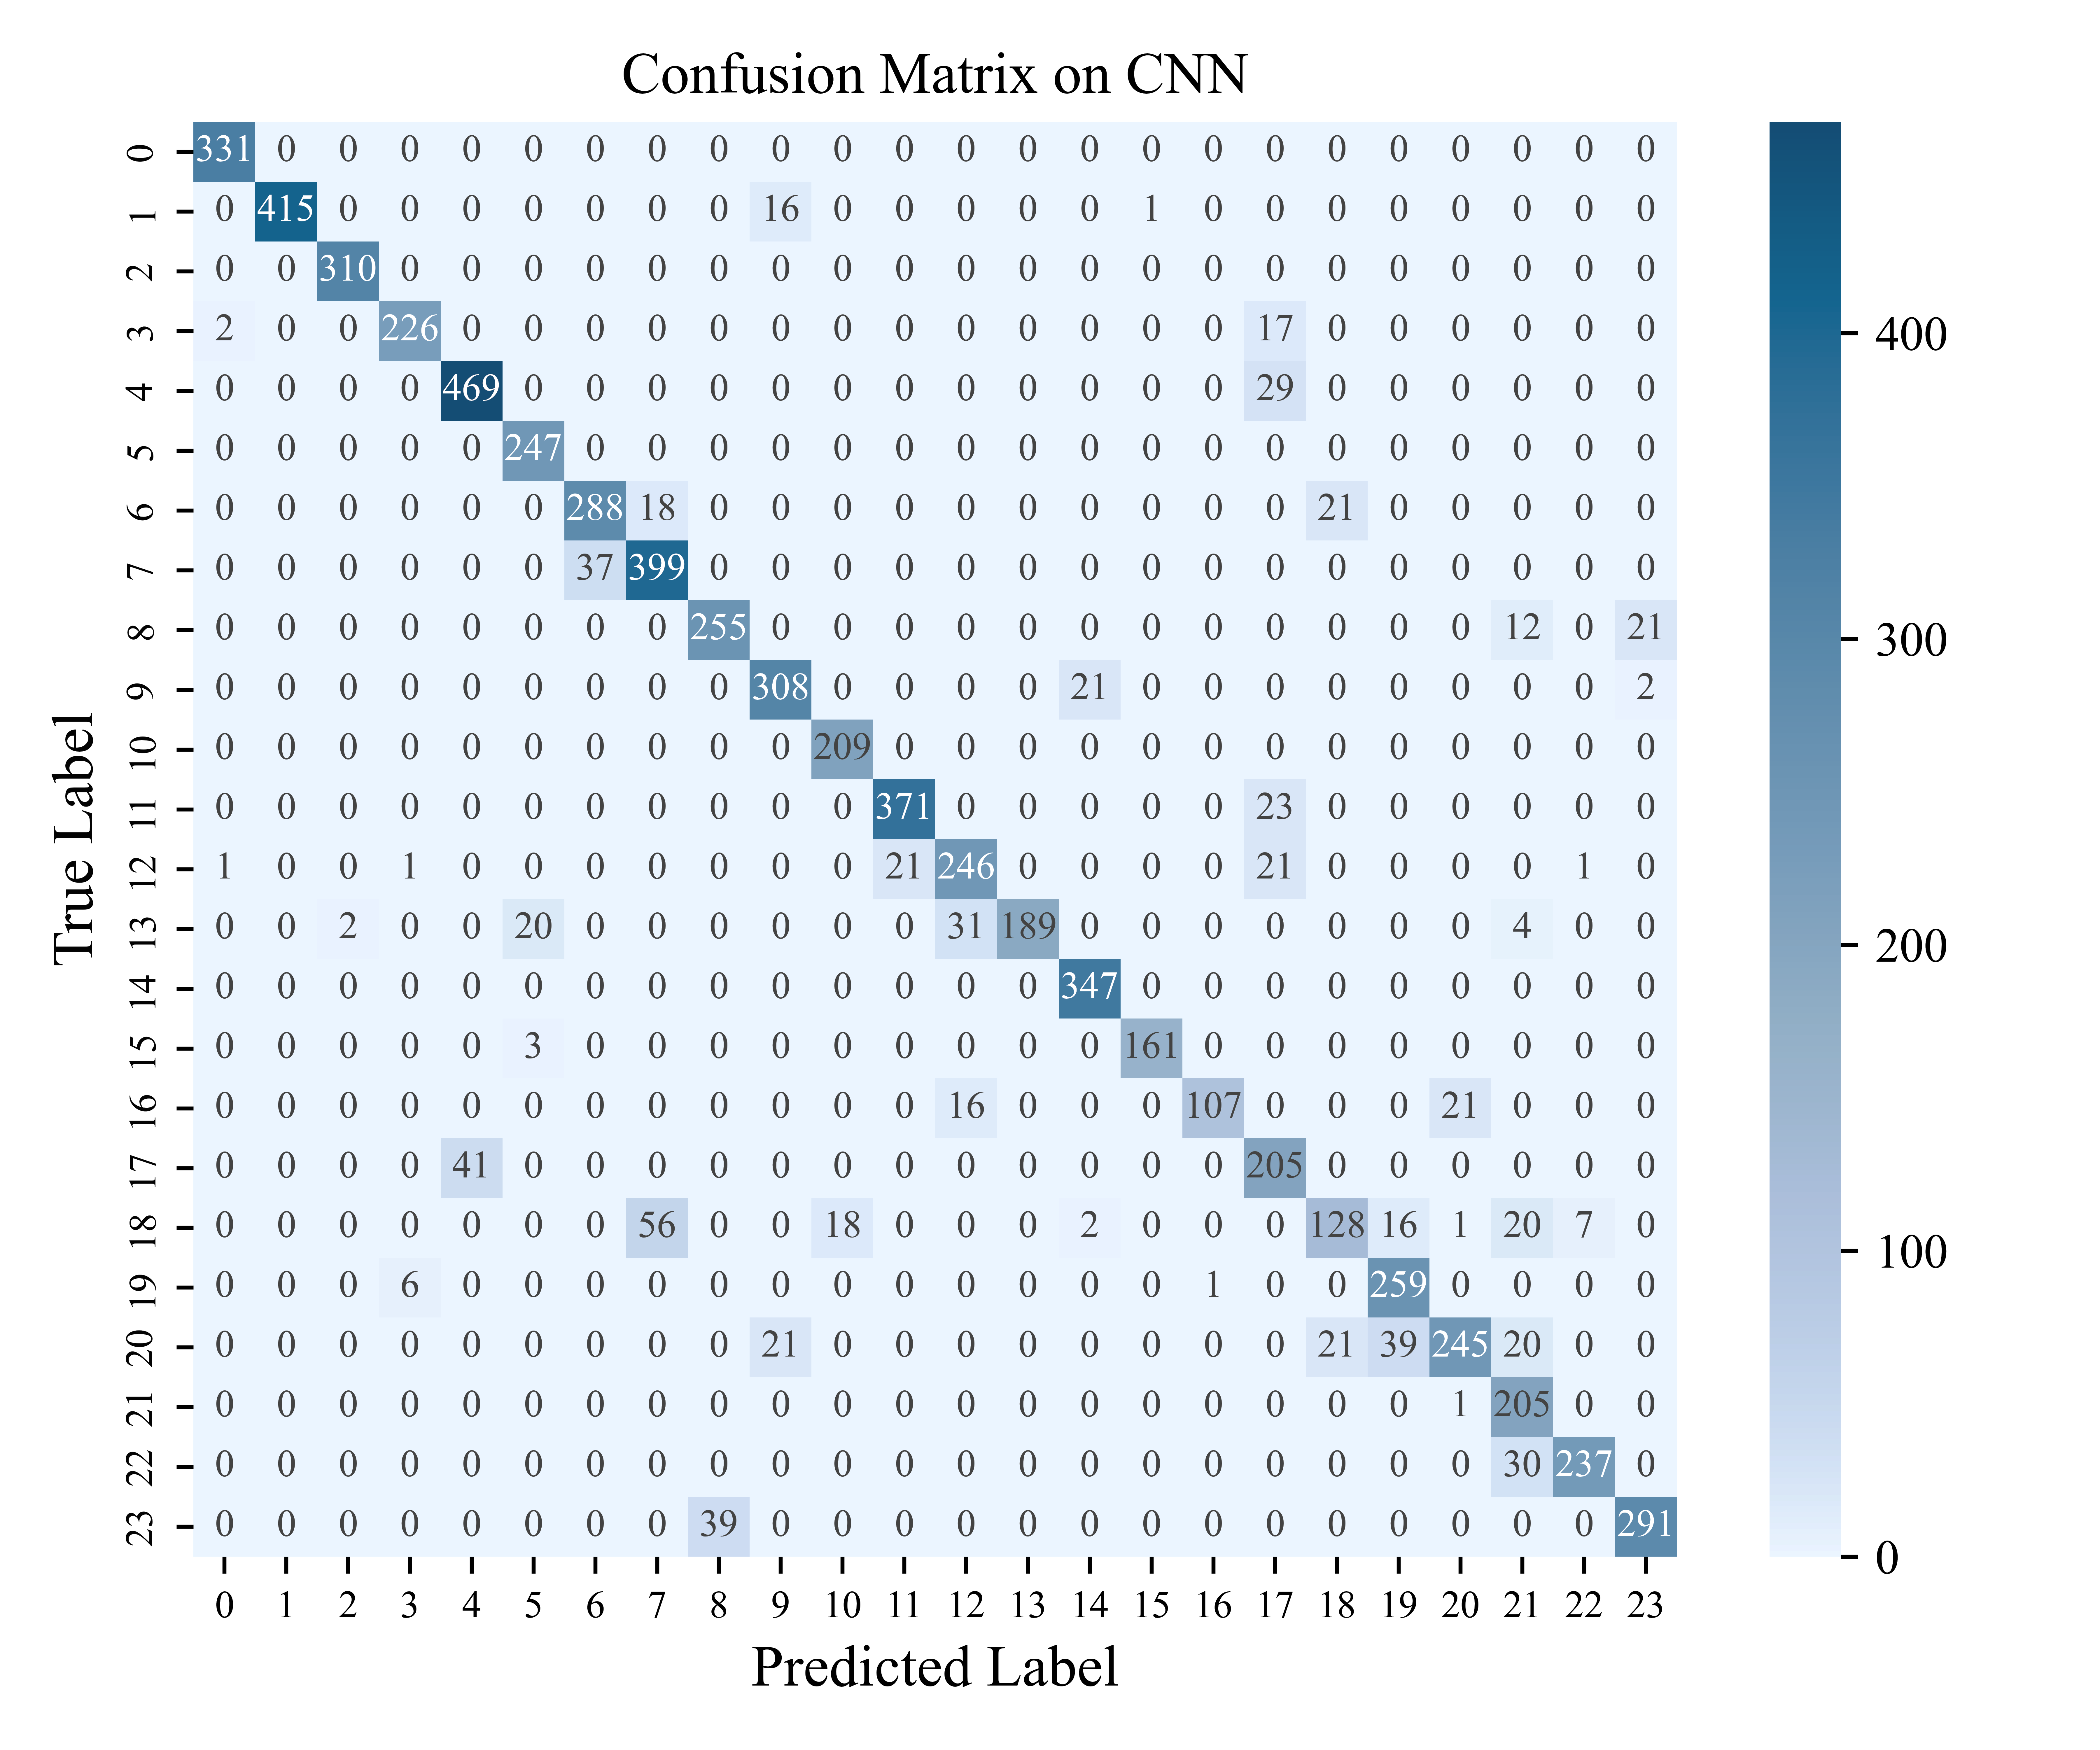
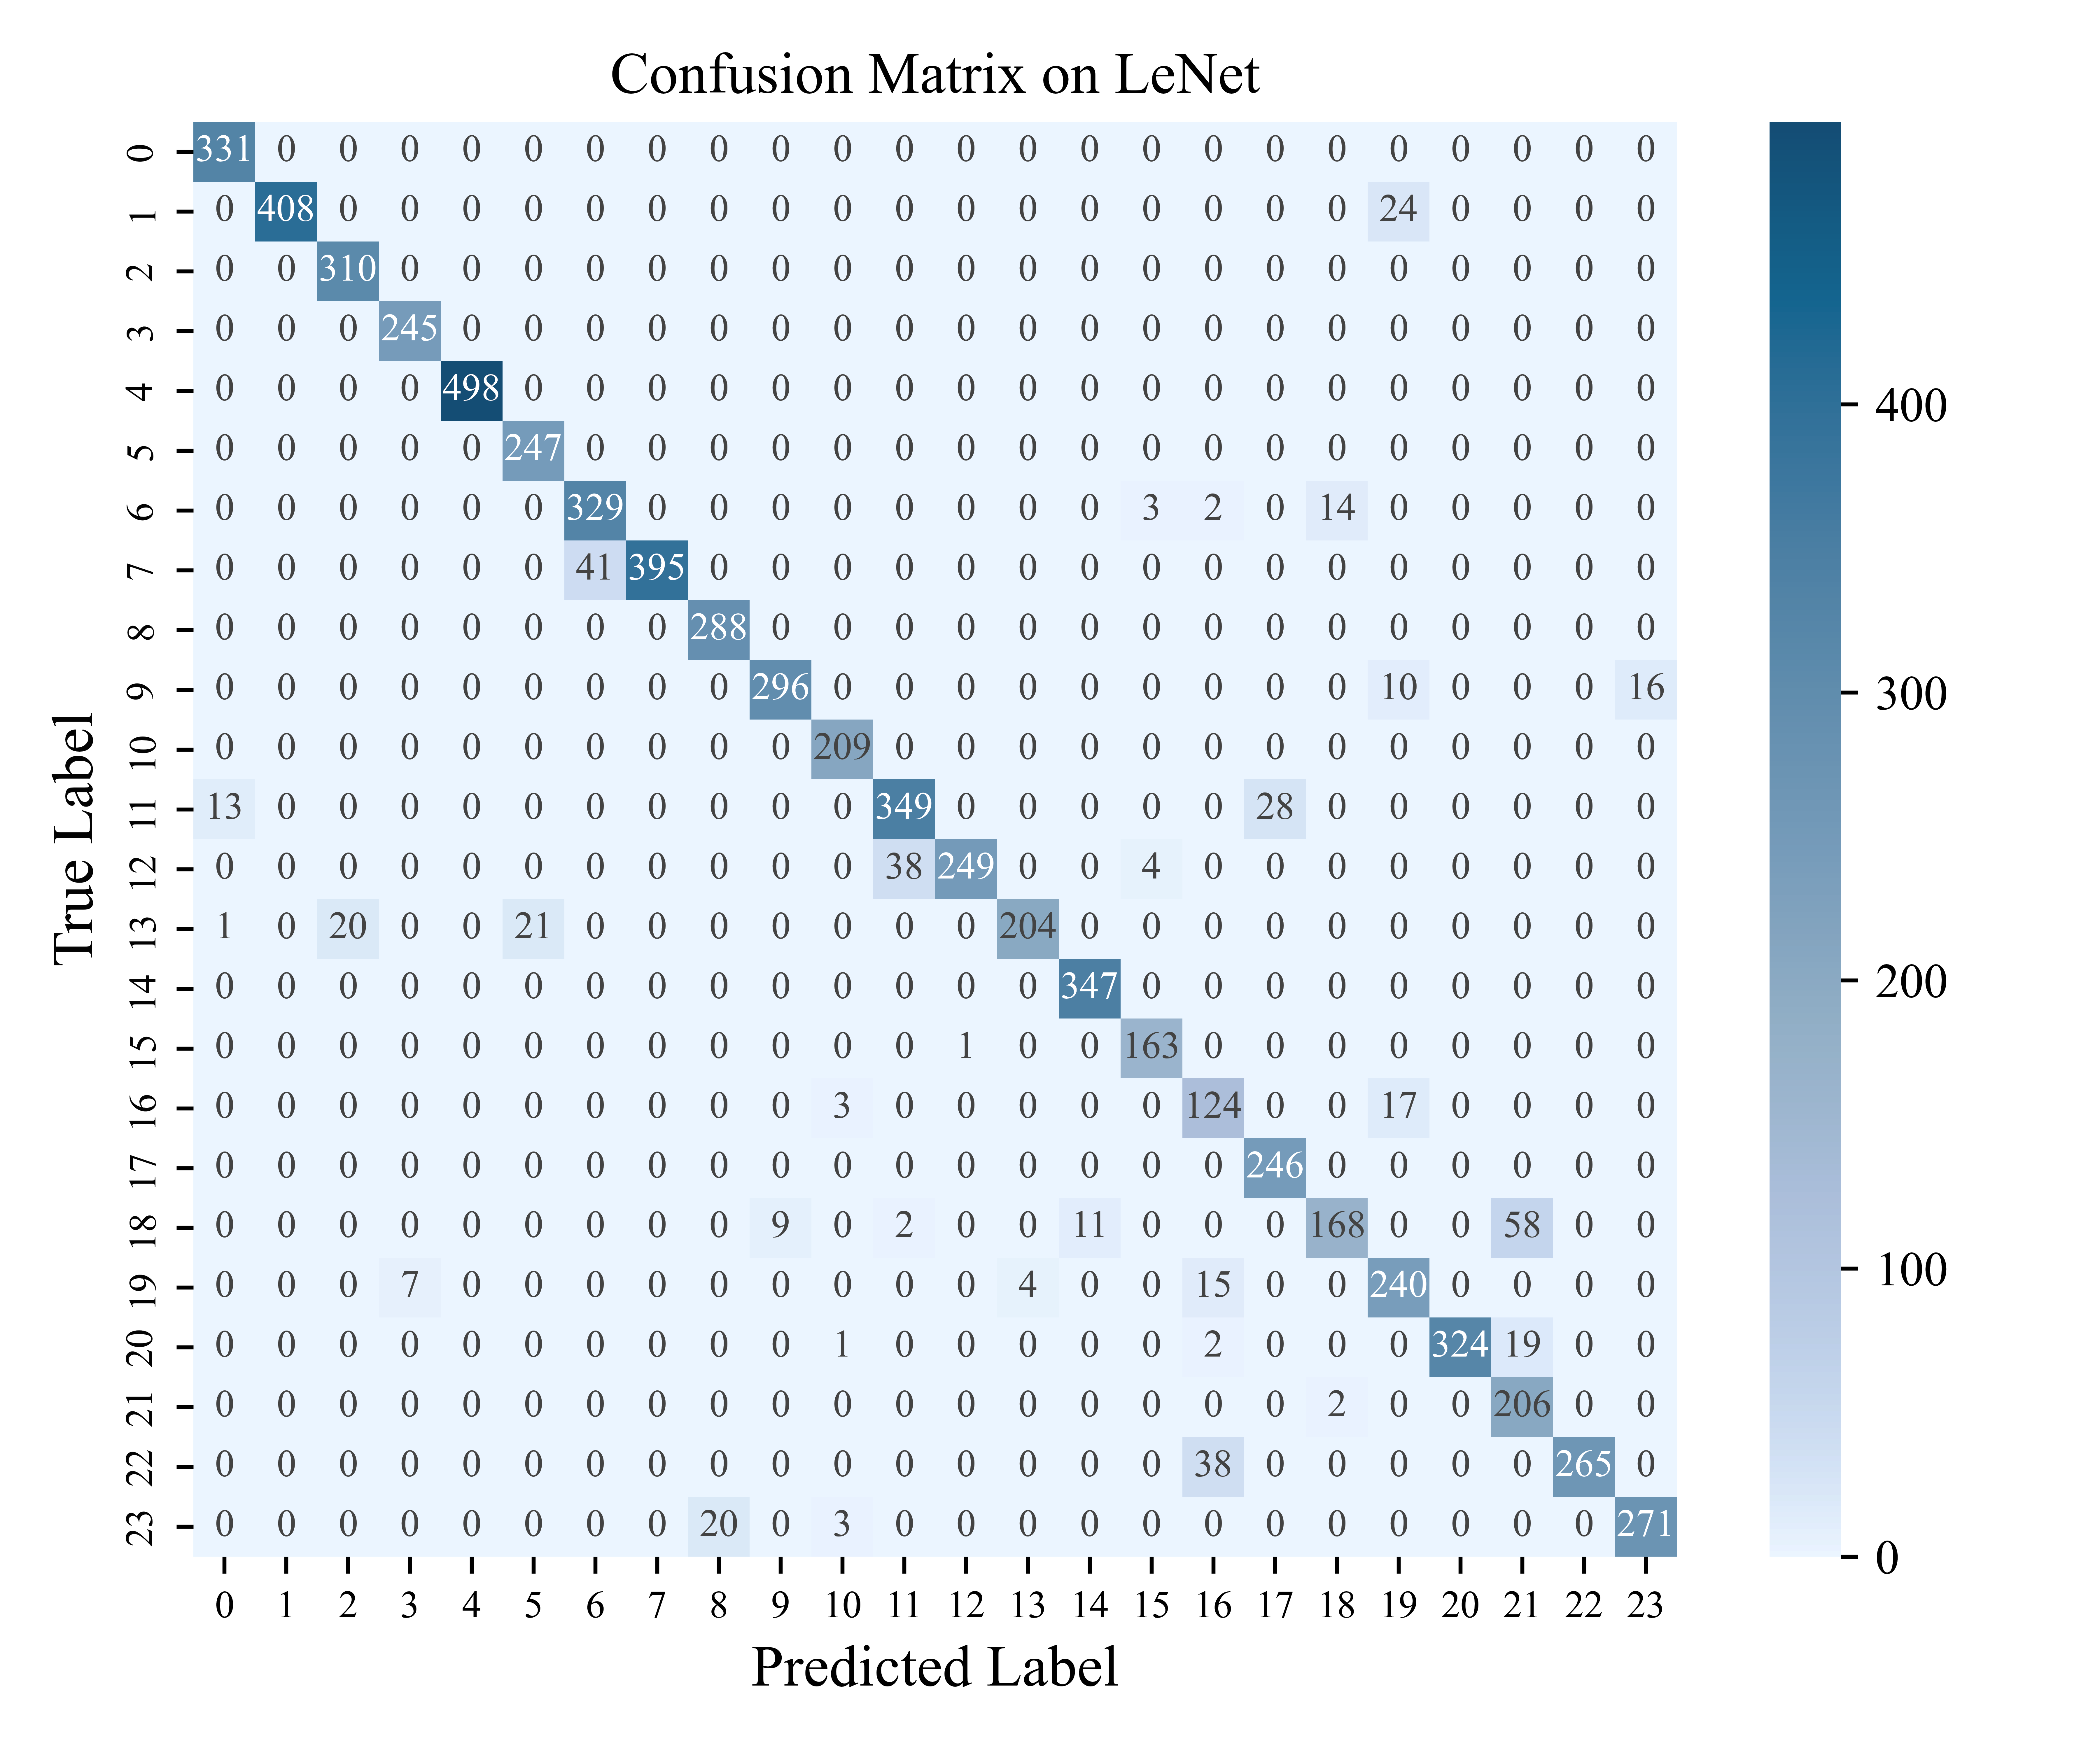
According to the category accuracy formula \( {Accuracy_{i}}=\frac{{C_{ii}}}{\sum _{j=1}^{n}{C_{ji}}} \) , the accuracy of each category was calculated and it was found that the letter T labeled 18 had the lowest prediction accuracy among the three models, CNN: 51.56%, LeNet: 67.74%, and ResNet: 77.02%.
In the CNN model, the letter T is incorrectly recognized as the letter H in the highest proportion, accounting for 56% of the recognition error rate; while in both the LeNet model and the ResNet model, the recognition error rate of the letter T is significantly declined, but in the LeNet model, there is still a part of the letter T being incorrectly recognized as the letter X, which accounts for 72.5% of the recognition error rate; this defect is greatly improved in the ResNet model, where only a small portion of letter T is incorrectly recognized as letters L, H, and X. The comparison of the ASL gestures of these letters reveals that most of them have relatively similar features, which have a high indistinguishability.
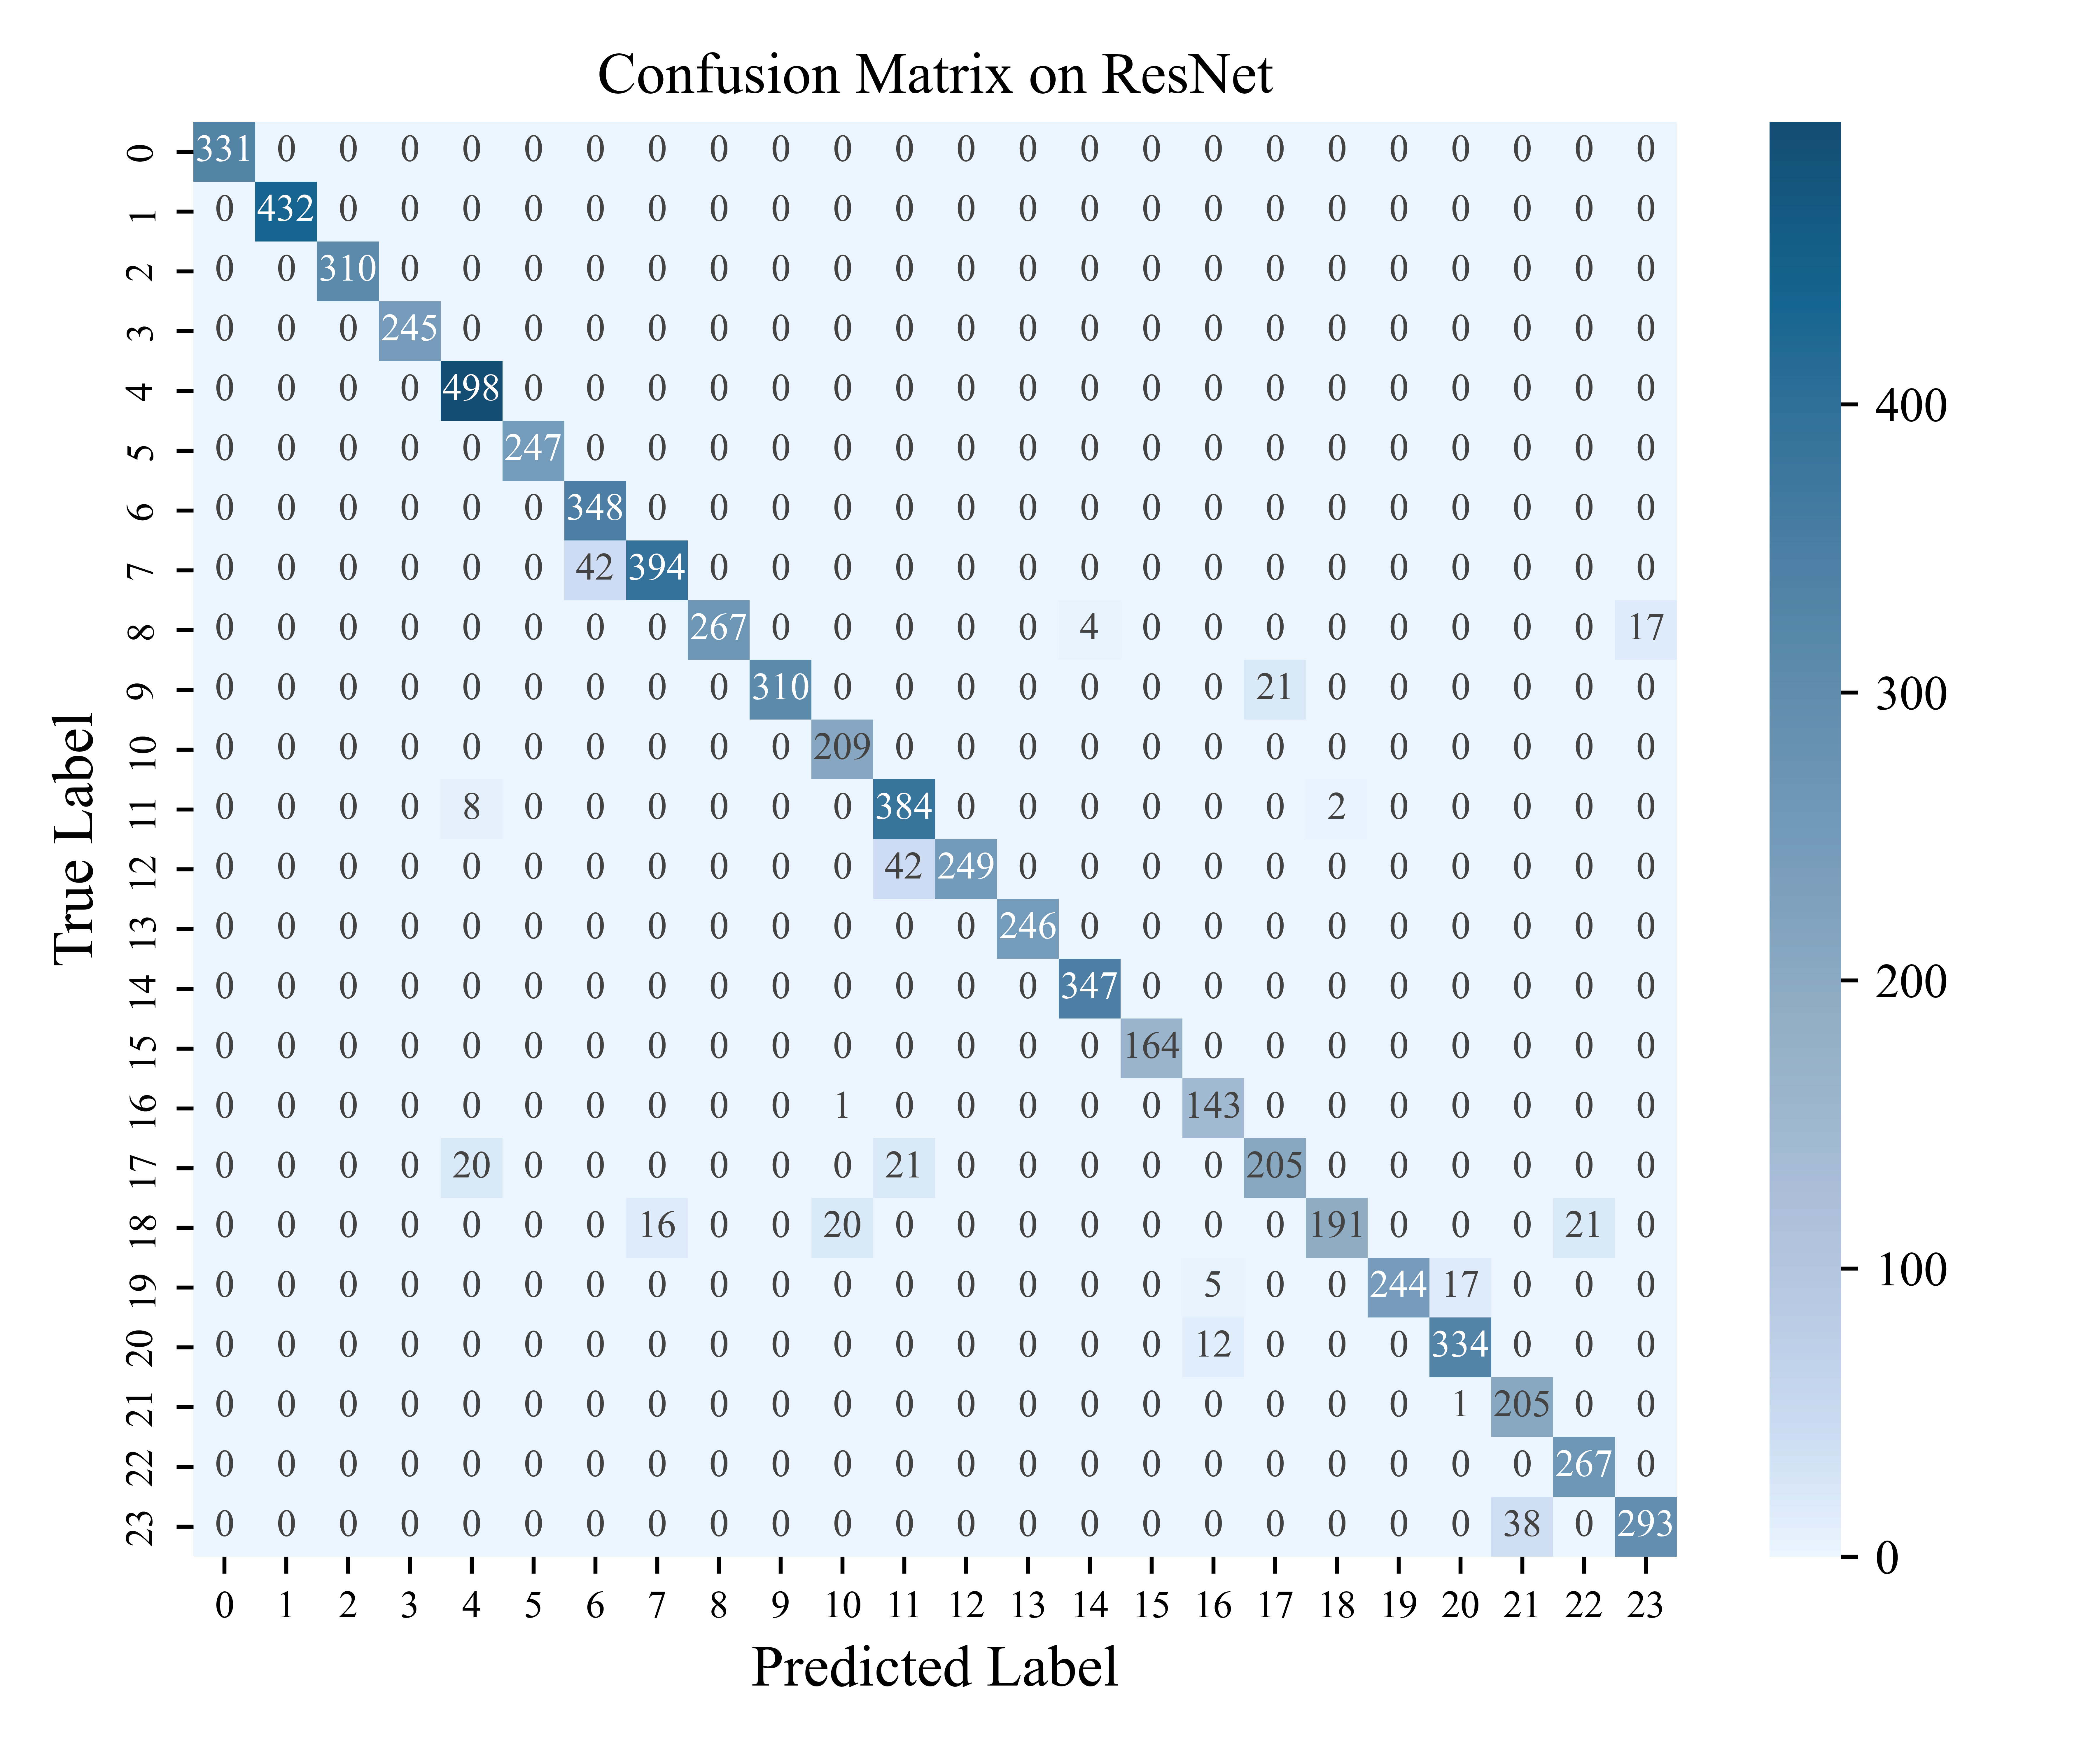
Figure 6. Confusion matrix of ResNet model (Figure credit: original).
4. Discussions
In this study, the author provides an in-depth comparison of the behaviour of three neural network architectures, Basic CNN, LeNet, and ResNet, in the American Sign Language recognition task. ResNet performs well during the training process, especially in the third cycle when it reaches an accuracy of 95.69%, which highlights its excellent recognition ability in the image recognition task. However, ResNet's accuracy fluctuates a lot in the initial period of training, which may be due to the sensitivity of its deep structure to gradient in the initialization stage, leading to the instability of the model in the early stage of training. In contrast, CNN and LeNet have slightly lower accuracies of 94.81% and 95.48%, respectively, but they show less fluctuation during the training cycle and show higher stability.
The high performance of ResNet is attributed to its deep structure that captures more complex features, while the stability of CNN may be due to its relatively shallow network structure that makes the model easier to train. However, ResNet's instability in the early stages of training may require more tuning work, such as adjusting the learning rate and regularization strategy, to ensure stable training of the model. LeNet and CNN, although more accurate and stable, still need to improve their discriminative ability when dealing with categories with similar features, such as the letter T. The model's performance can be further improved by applying a more sophisticated network structure, which can be used to catch more complex features.
In order to further improve the model performance, future research can consider the following directions: first, hyper-parameter tuning of ResNet, such as adjusting the learning rate, increasing regularization, or using more advanced optimization algorithms to reduce fluctuations at the beginning of training. Second, data enhancement strategies, such as rotation, scaling and color transformation, are implemented for all models to enhance the generalization ability of the models. In addition, existing network structures are optimized, e.g., by introducing attention mechanisms or exploring deeper network structures to enhance the model's capacity to capture intricate details. Finally, for categories with low recognition accuracy, the model's recognition ability can be improved by oversampling a few categories or using category weights. Future research is anticipated to further improve the behaviour of these models in tasks involving the recognition of American Sign Language with these avenues for improvement.
5. Conclusions
This study employs three models, Basic CNN, LeNet-5, and ResNet-50, with careful tuning of the models. Through batch normalization, the author effectively reduces the internal covariate bias, improves the training efficiency and stability of the models and lowers the possibility of overfitting. In addition, three evaluation metrics are applied, Accuracy, Loss function, and Confusion Matrix are used to examine and contrast the three models' respective performances as well as to track precise class accuracies.
The experimental results show that ResNet exhibits excellent performance in the recognition task despite initial fluctuations. In contrast, CNN and LeNet are slightly less accurate, but their stability and lower training difficulty make them equally attractive for practical applications. These results offer insightful references for next studies on the recognition of sign language.
Notwithstanding the findings of this study, the author recognizes that the diversity of the dataset is crucial for building more reliable models. Changes in skin tone, the distinction between left and right hands, adult compared to child hands, and environmental circumstances are among the variables that might affect how well the model performs in practical applications, but none of these are adequately covered by the current dataset. It is expected that in the future, more diverse and richer datasets will be available to improve the generalization and flexibility of the model.
References
[1]. Rastgoo, R., Kiani, K., & Escalera, S. (2021). Sign language recognition: A deep survey. Expert systems with applications, vol.164, p. 113794.
[2]. Wadhawan, A., & Kumar, P. (2021). Sign language recognition systems: A decade systematic literature review. Archives of computational methods in engineering, vol. 28, pp. 785-813.
[3]. Li, Z., Liu, F., Yang, W., Peng, S., & Zhou, J. (2021). A survey of convolutional neural networks: analysis, applications, and prospects. IEEE transactions on neural networks and learning systems, vol. 33(12), pp. 6999-7019.
[4]. Al-Saffar, A. A. M., Tao, H., & Talab, M. A. (2017). Review of deep convolution neural network in image classification. International conference on radar, antenna, microwave, electronics, and telecommunications (pp. 26-31).
[5]. Rawat, W., & Wang, Z. (2017). Deep convolutional neural networks for image classification: A comprehensive review. Neural computation, vol. 29(9), pp. 2352-2449.
[6]. Gu, J., Wang, Z., Kuen, J., Ma, L., Shahroudy, A., Shuai, B., & Chen, T. (2018). Recent advances in convolutional neural networks. Pattern recognition, vol. 77, pp. 354-377.
[7]. Tecperson. (2017). Sign Language MNIST. URL: https://www.kaggle.com/datasets/datamunge/sign-language-mnist/data. Last Accessed: 2024/10/13.
[8]. He, K., Zhang, X., Ren, S., & Sun, J. (2016). Deep residual learning for image recognition. In Proceedings of the IEEE conference on computer vision and pattern recognition (pp. 770-778).
[9]. LeCun, Y., Bottou, L., Bengio, Y., & Haffner, P. (1998). Gradient-based learning applied to document recognition. Proceedings of the IEEE, vol. 86(11), pp. 2278-2324.
[10]. Kingma, D. P. (2014). Adam: A method for stochastic optimization. arXiv preprint arXiv:1412.6980.
Cite this article
Fang,H. (2024). A Comparative Analysis of Convolutional Neural Networks for American Sign Language Recognition. Applied and Computational Engineering,97,133-138.
Data availability
The datasets used and/or analyzed during the current study will be available from the authors upon reasonable request.
Disclaimer/Publisher's Note
The statements, opinions and data contained in all publications are solely those of the individual author(s) and contributor(s) and not of EWA Publishing and/or the editor(s). EWA Publishing and/or the editor(s) disclaim responsibility for any injury to people or property resulting from any ideas, methods, instructions or products referred to in the content.
About volume
Volume title: Proceedings of the 2nd International Conference on Machine Learning and Automation
© 2024 by the author(s). Licensee EWA Publishing, Oxford, UK. This article is an open access article distributed under the terms and
conditions of the Creative Commons Attribution (CC BY) license. Authors who
publish this series agree to the following terms:
1. Authors retain copyright and grant the series right of first publication with the work simultaneously licensed under a Creative Commons
Attribution License that allows others to share the work with an acknowledgment of the work's authorship and initial publication in this
series.
2. Authors are able to enter into separate, additional contractual arrangements for the non-exclusive distribution of the series's published
version of the work (e.g., post it to an institutional repository or publish it in a book), with an acknowledgment of its initial
publication in this series.
3. Authors are permitted and encouraged to post their work online (e.g., in institutional repositories or on their website) prior to and
during the submission process, as it can lead to productive exchanges, as well as earlier and greater citation of published work (See
Open access policy for details).
References
[1]. Rastgoo, R., Kiani, K., & Escalera, S. (2021). Sign language recognition: A deep survey. Expert systems with applications, vol.164, p. 113794.
[2]. Wadhawan, A., & Kumar, P. (2021). Sign language recognition systems: A decade systematic literature review. Archives of computational methods in engineering, vol. 28, pp. 785-813.
[3]. Li, Z., Liu, F., Yang, W., Peng, S., & Zhou, J. (2021). A survey of convolutional neural networks: analysis, applications, and prospects. IEEE transactions on neural networks and learning systems, vol. 33(12), pp. 6999-7019.
[4]. Al-Saffar, A. A. M., Tao, H., & Talab, M. A. (2017). Review of deep convolution neural network in image classification. International conference on radar, antenna, microwave, electronics, and telecommunications (pp. 26-31).
[5]. Rawat, W., & Wang, Z. (2017). Deep convolutional neural networks for image classification: A comprehensive review. Neural computation, vol. 29(9), pp. 2352-2449.
[6]. Gu, J., Wang, Z., Kuen, J., Ma, L., Shahroudy, A., Shuai, B., & Chen, T. (2018). Recent advances in convolutional neural networks. Pattern recognition, vol. 77, pp. 354-377.
[7]. Tecperson. (2017). Sign Language MNIST. URL: https://www.kaggle.com/datasets/datamunge/sign-language-mnist/data. Last Accessed: 2024/10/13.
[8]. He, K., Zhang, X., Ren, S., & Sun, J. (2016). Deep residual learning for image recognition. In Proceedings of the IEEE conference on computer vision and pattern recognition (pp. 770-778).
[9]. LeCun, Y., Bottou, L., Bengio, Y., & Haffner, P. (1998). Gradient-based learning applied to document recognition. Proceedings of the IEEE, vol. 86(11), pp. 2278-2324.
[10]. Kingma, D. P. (2014). Adam: A method for stochastic optimization. arXiv preprint arXiv:1412.6980.