


1. Introduction
Artificial intelligence has become a revolutionary force that has a profound impact on many facets of human life and work as a result of the rapid advancement of science and technology. As an important branch of artificial intelligence, computer vision has been widely used in many fields, among which garbage classification is one of its key applications in the field of smart cities and sustainable development [1, 2]. In China, one of the world's most populous countries and largest economies, the problem of waste generation has escalated dramatically. For example, China, as the world's most populous country, faces serious waste management challenges, and the amount of urban waste generated is expected to grow rapidly by 2030. This presents an urgent need for efficient automated garbage sorting methods [3]. Similarly, the annual global production of waste is also growing rapidly, and it is predicted that if reasonable and rapid measures are not taken, the production of waste will further increase rapidly. In 2022, the world produced about 2.1 billion tons of municipal solid waste, and this figure is expected to reach 3.4 to 3.8 billion tons by 2050 [4, 5]. Despite the challenges posed by waste, it also represents a valuable recyclable resource. However, the current methods of waste classification, heavily reliant on manual labor, remain inefficient and resource-intensive, leading to wasted human, financial, and material resources [6].
To address this issue, modern advancements in computer vision technology offer innovative solutions for improving the efficiency of waste classification, providing new methods for resource recycling and waste management. By leveraging computer vision, it becomes possible to automate the classification process, replacing manual labor and significantly reducing costs.
In traditional methods, simple algorithms like Support Vector Machines (SVM) and decision trees have been used for classification tasks, but these methods heavily rely on manually extracted features, limiting their performance in high-complexity scenarios. In contrast, deep learning can automatically extract information and features from data without manual intervention, significantly saving human and material resources. Additionally, deep learning exhibits high robustness when handling input with noise, missing data, or other forms of incompleteness, effectively identifying and ignoring minor variations, which enhances resilience to anomalous data and potential attacks [7]. This gives deep learning a clear advantage in dealing with complex data.
The feasibility of applying computer vision and convolutional neural networks (CNNs) to waste classification is supported by the availability of both data and proven technological methodologies. In smart city contexts, artificial intelligence technologies, including computer vision, have been effectively utilized for waste management tasks, as highlighted in the overview by Smith et al. [8]. The review emphasizes the scalability and efficiency that AI-driven solutions bring to waste sorting and processing, making technologies like CNNs highly suitable for handling complex waste classification challenges, which require fast and accurate decision-making capabilities in dynamic environments [8].
To achieve this goal, a sufficient dataset is needed to train the model. A wide range of high-quality image datasets related to waste classification is readily accessible on public platforms such as Kaggle. These datasets provide a sufficient and diverse pool of labelled images, enabling effective training and validation of CNN-based models. This data ensures that the algorithm can be trained on real-world examples, making the system robust and adaptable to different waste classification scenarios.
CNNs have already established themselves as the leading tool for image classification, processing, and analysis [2]. By incorporating advanced architectures such as the Deep Residual Network (ResNet), the proposed system can achieve even higher accuracy levels in classification tasks, potentially surpassing human capabilities [9]. ResNet's innovative residual mechanism allows for deeper network training without the risk of vanishing gradients, enabling more effective feature extraction from complex image data. Furthermore, the success of CNNs-based models in similar image recognition tasks provides strong evidence of the method's viability for waste classification. For instance, CNN technology not only excels in extracting features from visual and point cloud data but also adapts flexibly to various complex scenarios [10]. In the medical field, CNNs have demonstrated exceptional performance, particularly in medical image analysis, where they can effectively extract both local and global features, aiding radiologists in tumor diagnosis [11]. To improve the classification performance of the model in complex environments, this study draws on deep learning techniques used in plant disease image processing. These techniques have shown excellent generalization capabilities in segmenting leaves with plant diseases in complex backgrounds [12]. By adopting a similar approach, this study attempts to reduce the interference of environmental backgrounds on the model's recognition performance in the waste classification task.
Given the strong foundation of available data and the proven effectiveness of CNNs in image recognition tasks, the implementation of a CNNs-based waste classification system is not only feasible but also highly promising. The application of this technology can substantially improve efficiency in both daily life and industrial processes, reducing resource consumption and promoting sustainable waste management practices.
2. Method
2.1. Data Source
The dataset used in this study was sourced from the Kaggle platform and the UCI Machine Learning Repository, specifically utilizing the "Garbage Classification Dataset" from both platforms [13, 14]. This combined dataset consists of approximately 5,000 images, categorized into ten major types: cardboard, food organics, glass, metal, paper, plastic, vegetation, miscellaneous trash, textile trash, and other trash. The dataset is relatively balanced, with each category containing between 400 to 900 images, ensuring fair representation of all classes.
2.2. Image Preprocessing
Before training, all images were resized to 384×384 pixels to maintain uniformity, and square images are more conducive to deep learning. Data augmentation techniques were also applied, including random rotation, horizontal and vertical shifts, random zoom, random horizontal flips, slight shear transformations (with a shear range of 0.05), brightness adjustments (ranging from 90% to 110% of the original brightness), and random channel shifts. These techniques were employed to enhance the robustness of the model and reduce overfitting. In this study, the balance of the mixed dataset has a significant impact on classification performance. As highlighted in the plant disease image processing literature, data imbalance can affect the learning capacity and generalization effectiveness of the model, especially in complex environments [12]. To address this issue, the study enhances the dataset's balance by incorporating data augmentation techniques and optimizing image segmentation methods, thereby improving the overall performance of the model.
2.3. Application of CNN (ResNet-50)
The CNNs employed in this project are based on a modified version of the ResNet-50 architecture. This architecture was selected due to its proven effectiveness in image classification tasks and its ability to handle deep networks without encountering vanishing gradient issues.
The model consists of three convolutional layers with varying filter sizes, followed by batch normalization and ReLU activation functions (Figure 1). A global average pooling layer was added before the final softmax output layer to generate the classification probabilities for the ten waste categories.
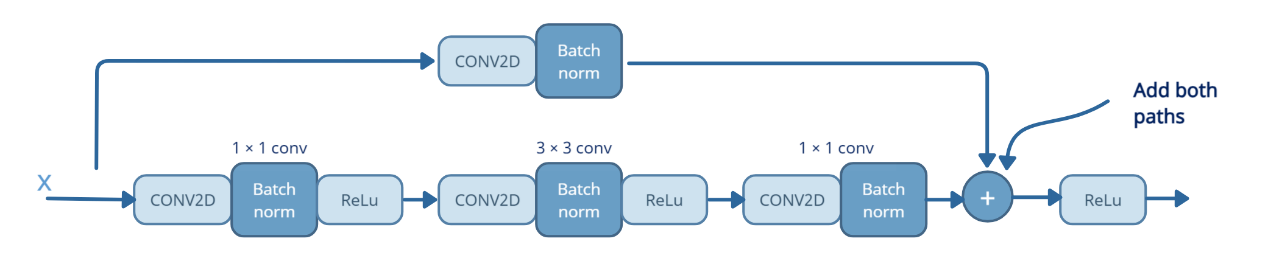
Figure 1: Residual Block [13]
2.4. Model Performance Evaluation and Optimization
To evaluate the model’s performance in the waste classification task, this study primarily adopts categorical cross-entropy as the standard for optimizing the model. Categorical cross-entropy effectively measures the difference between the model's output and the true labels. During model training, a reduction in the loss function indicates an improvement in the model's prediction accuracy.
In each epoch of training, this research monitors the model's performance by calculating the accuracy of both the training and validation sets to ensure the model's gradual convergence. Additionally, to address the need for learning rate adjustment during training, this research employs the ReduceLROnPlateau strategy. When the validation loss no longer decreases, the learning rate is automatically halved, further optimizing the training process and enhancing the model's generalization ability.
Moreover, the EarlyStopping mechanism is used to monitor changes in the validation loss. During training, when the validation performance no longer improves, the model training automatically stops to prevent overfitting, thereby ensuring the model's robustness in practical applications.
In terms of evaluating classification performance, in addition to using accuracy to measure the overall model performance, this research also analyzes the precision of the model in waste classification through a confusion matrix. The confusion matrix helps identify which waste categories are more prone to misclassification, providing insights for future model improvements. The F1-score, as a comprehensive metric calculated based on the confusion matrix, is particularly important when evaluating classification performance on imbalanced datasets. By combining the detailed analysis of the confusion matrix, this study can more clearly identify the strengths and weaknesses of the model in the waste classification task, providing a basis for future model improvements [6].
Here are the steps to calculate the F1 score:
Precision is calculated as the ratio of true positives (TP) to the sum of true positives and false positives (FP).
Formula:
\( Precision=\frac{TP}{TP+FP}\ \ \ (1) \)
Recall, also known as sensitivity, is the ratio of true positives (TP) to the sum of true positives and false negatives (FN).
Formula
\( Recall=\frac{TP}{TP+FP}\ \ \ (2) \)
The F1 score is the harmonic mean of precision and recall, and it provides a single metric that balances both values.
Formula:
\( F1=2×\frac{Precision×Recall}{Precision+Recall}\ \ \ (3) \)
3. Results and Discussion
For dataset selection, the first part involves a dataset from Kaggle. The second part is from the UCI Machine Learning Repository. The third part combines the Kaggle dataset and the UCI Machine Learning Repository dataset.
3.1. Model Performance(Kaggle data)
On the Kaggle dataset, the model's training and validation curves demonstrated a reasonable convergence trend (Figure 2). Specifically, as the training progressed, the loss on the training set consistently decreased, while the accuracy gradually increased. The loss and accuracy curves exhibited clear convergence during training, indicating that the model successfully learned the features of the waste classification task. The model’s performance on the training set approached near perfection, with the final training accuracy reaching almost 100%. However, the validation set’s performance fluctuated considerably. Although the validation accuracy improved over time, it frequently fluctuated between 70% and 80%. This suggests that while the model fit well with the training data, there was some generalization error when applied to the validation data.
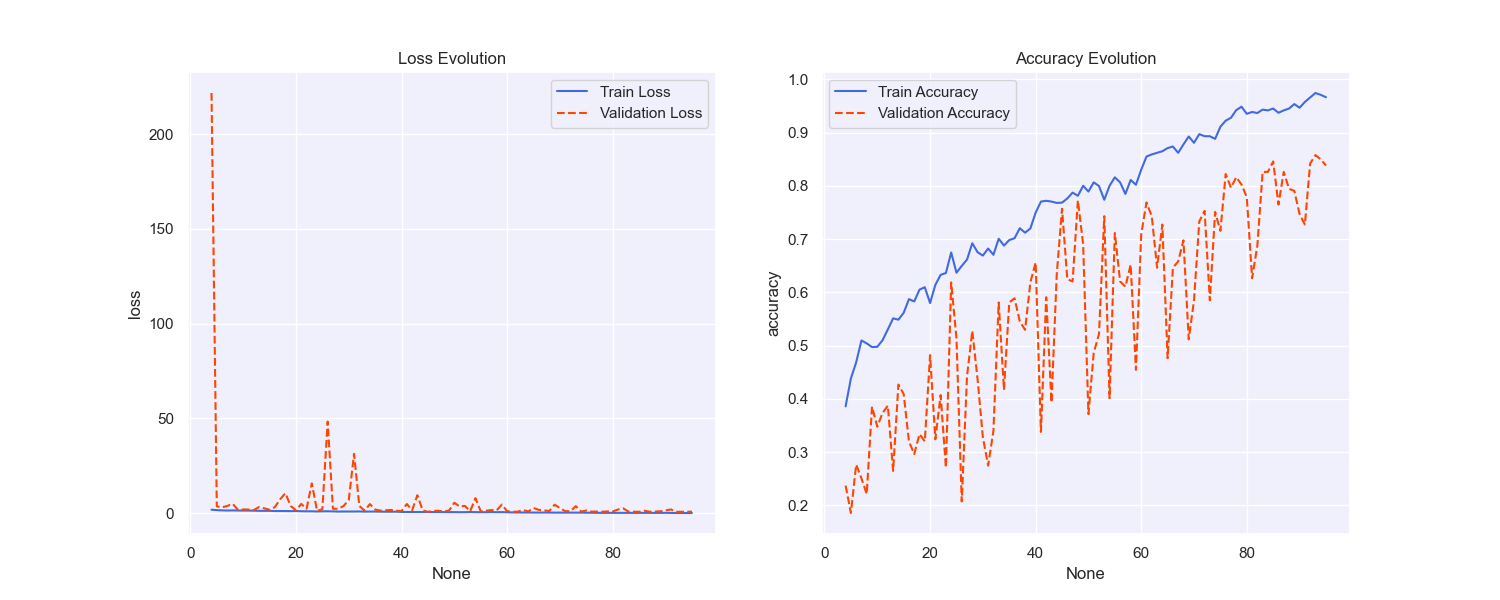
Figure 2: Loss and accuracy curves for training and validation of Kaggle data
An analysis of the confusion matrix reveals that the model performed well in classifying certain types of waste. For example, the classification accuracy for categories like "cardboard" and "glass" exceeded 90%. However, the model's performance in categorizing "trash" and "plastic" was relatively poor, with higher misclassification rates. Notably, the model often misclassified "trash" as other categories, such as "plastic" or "paper." This indicates that the classifier lacked sufficient discrimination when dealing with certain categories with smaller inter-class differences (Figure 3).
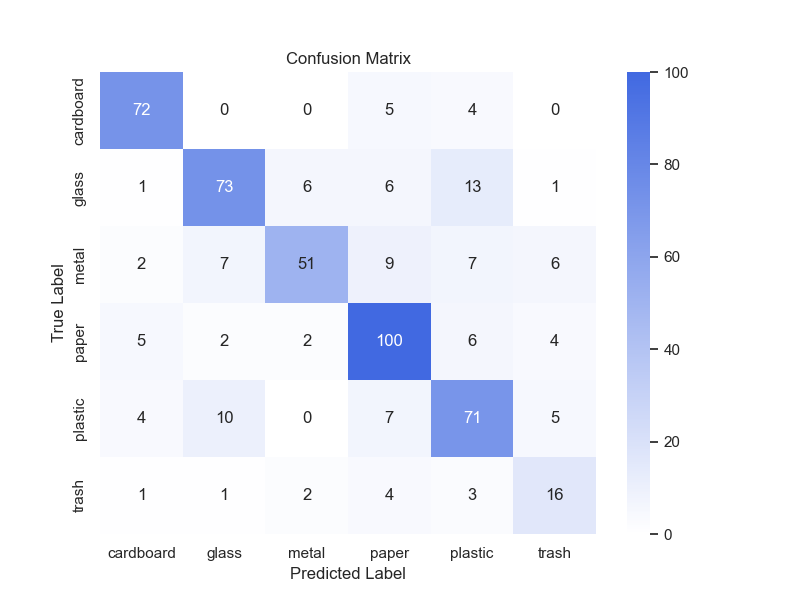
Figure 3: Kaggle data confusion matrix
The detailed classification performance metrics of the original dataset are shown in Table 1. From Table 1, it can be seen that the model performs well in classifying categories such as "cardboard" and "paper," with F1 scores of 0.87 and 0.80, respectively. This indicates that the model has effectively learned the features of these types of waste and can distinguish them accurately. However, for the "trash" category, the F1 score is relatively low, at only 0.54, which suggests that the model has limited ability to identify this type of waste and a higher misclassification rate. Further analysis of the table reveals that the model's classification performance is significantly influenced by the balance of categories in the dataset. For instance, the "trash" category has fewer samples, leading to poor model performance in this category, whereas categories such as "cardboard" and "paper" have more samples, resulting in better precision and recall.
The dataset's overall F1 score is 0.76, which shows a comparatively high recognition rate but also a fair amount of misclassification. Furthermore, macro-average and weighted-average performance indicators are included in Table 1. Without taking into account the number of samples in each class, macro-average values are computed by averaging precision, recall, and F1 scores over all classes.
Table 1 shows that the macro-average score is a reasonable 0.73. This suggests that even though the approach works well for some classes, some smaller classes still have a lot of space for improvement. At 0.76, the weighted average F1 score is marginally higher than the macro-average. This shows that the model performs well on categories with larger sample sizes (such as "cardboard" and "paper"). These results indicate that the model performs better for categories with a larger number of samples and struggles with categories that have fewer samples. Therefore, although the overall weighted average is relatively satisfactory, the macro-average highlights the model's shortcomings with smaller sample sizes. This indicates that the model still has room for improvement. Given the model's poor performance in categories with fewer samples, future efforts should focus on increasing the data volume for these categories or improving the training strategy (e.g., using data augmentation techniques) to enhance the model's classification performance and generalization ability in minority categories. This would not only help the model adapt better to minority class data but also improve its overall robustness in the waste classification task.
Table 1: Kaggle data classification performance evaluation
precision | recall | f1-score | support | |
cardboard | 0.85 | 0.89 | 0.87 | 81 |
glass | 0.78 | 0.73 | 0.76 | 100 |
metal | 0.84 | 0.62 | 0.71 | 82 |
paper | 0.76 | 0.84 | 0.80 | 119 |
plastic | 0.68 | 0.73 | 0.71 | 97 |
trash | 0.50 | 0.59 | 0.54 | 27 |
accuracy | 0.76 | 506 | ||
macro avg | 0.74 | 0.73 | 0.73 | 506 |
weighted avg | 0.76 | 0.76 | 0.76 | 506 |
3.2. UCI Dataset Experiment
After training with the UCI dataset, the results are shown in Figure 4.
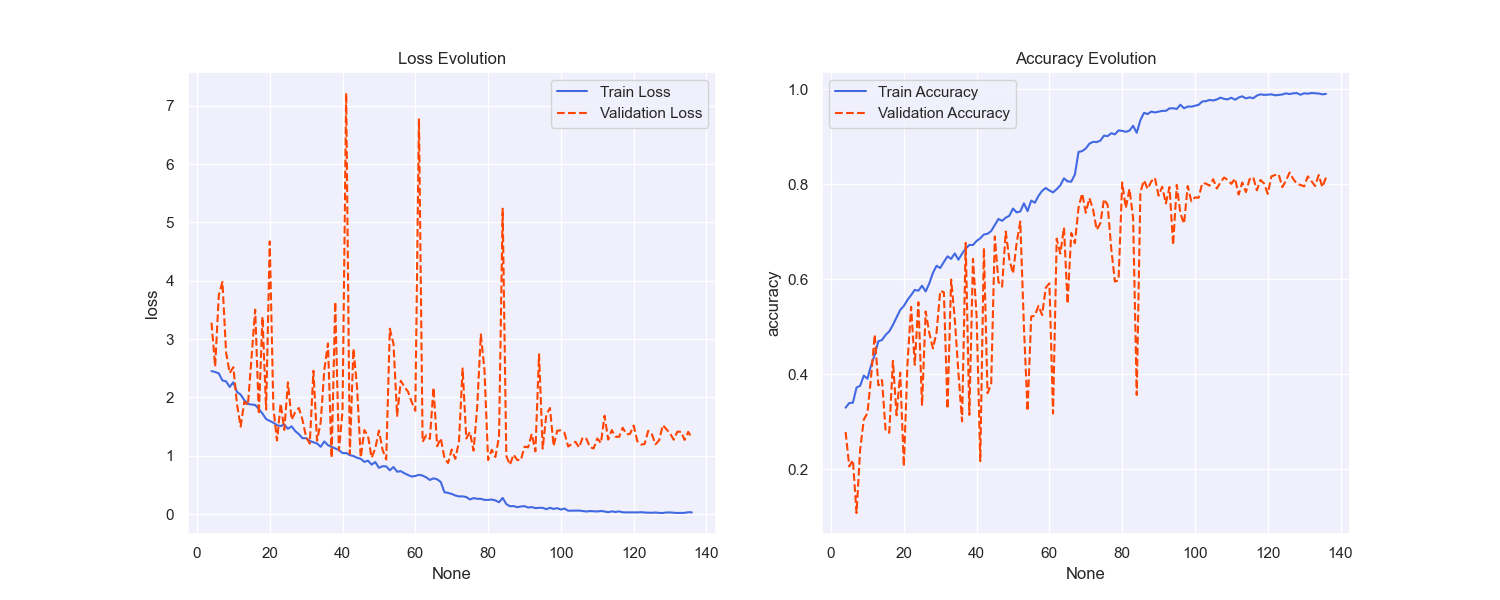
Figure 4: Loss and accuracy curves for training and validation of UCI data
Figure 4 illustrates the evolution of the model's loss and accuracy on the UCI dataset. During training, the training loss (left plot) significantly decreased, indicating that the model was progressively learning the features of this dataset. However, the validation loss showed notable fluctuations even as it decreased, particularly during the first 50 epochs, where multiple peaks were observed. This might reflect the model's sensitivity to certain portions of the validation data, especially when there are inconsistencies in feature distribution.
At the same time, the right plot depicts the training and validation accuracy. The accuracy of the training set gradually increased, eventually approaching 1.0, demonstrating good model fitting on the training data. The validation accuracy mirrored the fluctuations seen in the loss curve, with significant variability, especially between epochs 50 and 80. Nevertheless, the overall trend was an improvement, with the final validation accuracy stabilizing around 0.8. This suggests that despite some challenges in generalization, the model was able to effectively learn from the UCI dataset, albeit with room for improvement in handling diverse or inconsistent data characteristics.
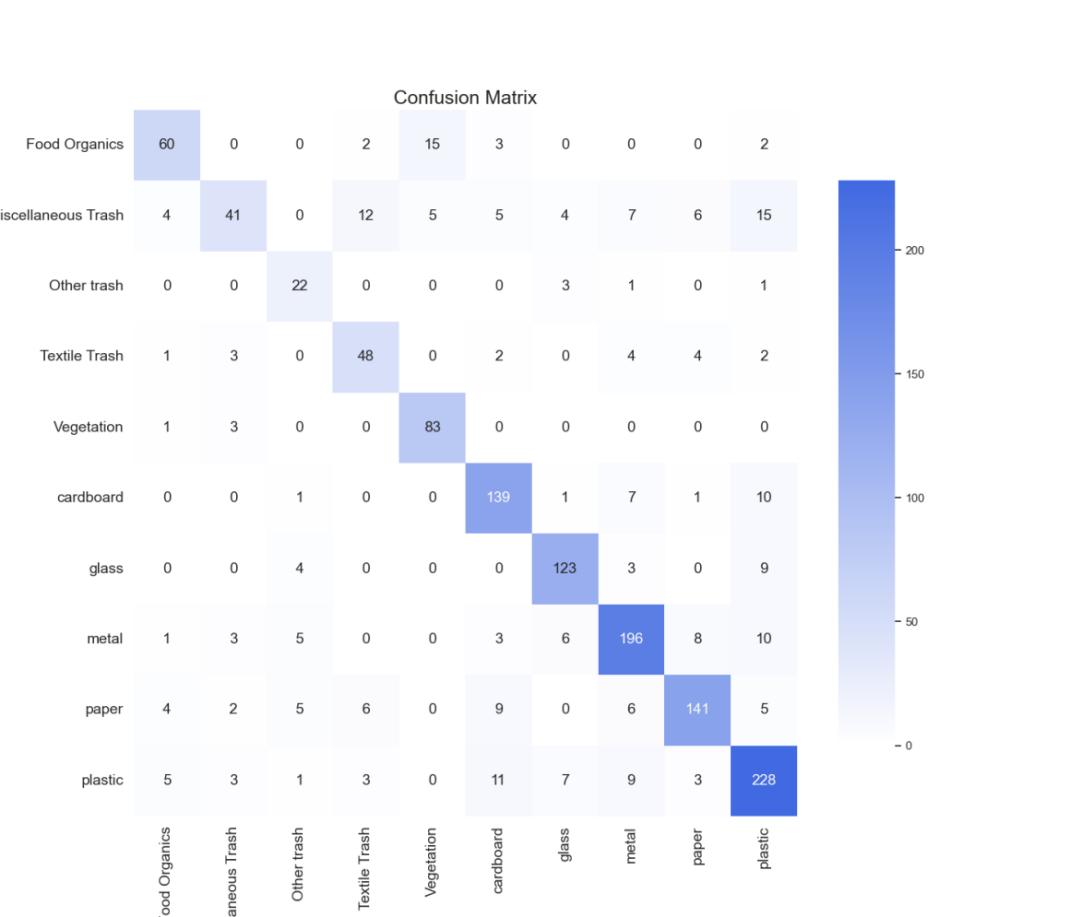
Figure 5: UCI data confusion matrix
To further evaluate the model's classification performance on the UCI dataset, Figure 5 presents the confusion matrix of the final model on the test set. The confusion matrix visually represents the model's predictions across different categories of waste. Overall, the model's performance on the UCI dataset showed variability, with high classification accuracy for some categories and high misclassification rates for others.
From the UCI dataset's confusion matrix, it is evident that the model performed well on certain categories but struggled with some misclassifications. For instance, the categories "Vegetation" and "Cardboard" were classified accurately, with nearly all instances being correctly identified. However, for categories such as "Miscellaneous Trash" and "Plastic," the model exhibited a higher misclassification rate, indicating a lack of differentiation ability for these categories. The similarity in features between these categories might be the main reason for the misclassification. Additionally, data imbalance between categories also significantly influenced the model's performance. Categories with larger sample sizes, such as "Plastic," performed better, while those with fewer samples, like "Other Trash," showed relatively poor performance.
Overall, the confusion matrix not only helps us understand the model's classification performance on the UCI dataset but also reveals the shortcomings in handling specific categories, providing concrete guidance for subsequent optimization and improvement efforts.
Table 2: UCI data classification performance evaluation
precision | recall | f1-score | support | |
food organics | 0.79 | 0.73 | 0.76 | 82 |
miscellaneous trash | 0.75 | 0.41 | 0.53 | 99 |
other trash | 0.58 | 0.81 | 0.68 | 27 |
textile trash | 0.68 | 0.75 | 0.71 | 64 |
vegetation | 0.81 | 0.95 | 0.87 | 87 |
cardboard | 0.81 | 0.87 | 0.84 | 159 |
glass | 0.85 | 0.88 | 0.87 | 139 |
metal | 0.84 | 0.84 | 0.84 | 232 |
paper | 0.81 | 0.79 | 0.83 | 178 |
plastic | 0.81 | 0.84 | 0.83 | 270 |
accuracy | 0.81 | 1337 | ||
macro avg | 0.78 | 0.79 | 0.78 | 1337 |
weighted avg | 0.81 | 0.81 | 0.80 | 1337 |
From the classification performance table for the UCI dataset (Table 2), it can be seen that the model's performance varies significantly across different categories of waste. Firstly, the overall accuracy of the model is 0.81, indicating a certain degree of classification effectiveness. Nevertheless, macro-average and weighted-average measures may be used to further examine the notable differences in categorization performance between categories. The macro-average's accuracy, recall, and F1-score are 0.78, 0.79, and 0.78, respectively. These values show that the classification performance is not balanced when all categories are handled equally. On the other hand, the precision, recall, and F1-score of the weighted average are 0.81, 0.81, and 0.80, reflecting that the overall performance metrics are, to some extent, influenced by larger sample sizes from major categories.
For different waste categories, the model performed well on categories like "Vegetation" and "Cardboard," with F1-scores of 0.87 and 0.84, and high recall rates, indicating that the model could accurately identify these categories. However, the model performed relatively poorly in categories such as "Miscellaneous Trash" and "Textile Trash," especially for "Miscellaneous Trash," which had an F1-score of only 0.53 and a recall rate of 0.41. This suggests that the model struggles with categories that have ambiguous features or fewer samples.
Additionally, the precision for the "Metal" category is 0.84, but the F1-score is relatively lower, suggesting that while the model can accurately classify most "Metal" samples, there is still a higher risk of misclassification in some cases. Similarly, the "Plastic" category's F1-score is 0.83, indicating average performance, and there is room for improvement in distinguishing between similar categories.
In summary, the classification results on the UCI dataset show that the model performs well in most categories but struggles with categories with fewer samples or ambiguous features. This highlights the need for improving the balance of the dataset in the future, particularly by increasing the sample size for minority categories. Additionally, adopting more advanced feature extraction techniques could enhance the model's generalization capabilities and reduce misclassification in complex scenarios.
3.3. Impact of the Mixed Dataset(Mixed data)
Combining the Kaggle and UCI datasets resulted in some notable changes in the model's performance, reflected in both the convergence behavior during training and validation and the final classification accuracy. The use of a combined dataset introduced more diverse training samples, which enhanced the model's generalization capabilities but also brought new challenges, such as imbalanced data feature distribution and increased confusion between categories (as shown in Figure 6).
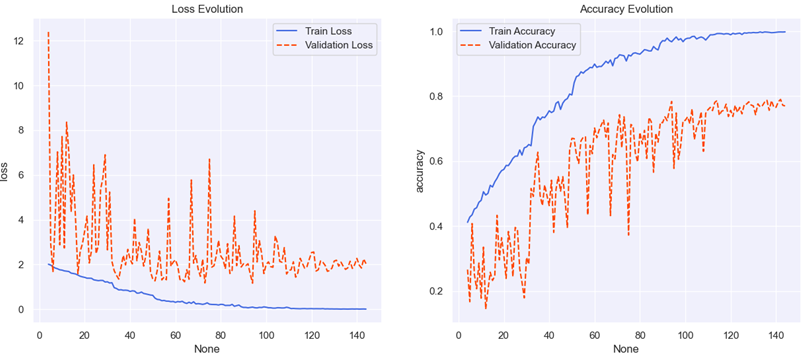
Figure 6: Loss and accuracy curves for training and validation of mixed data
During training, the introduction of the mixed dataset led to different characteristics in the loss curves for both the training and validation sets. The training loss curve showed a steady decline, indicating that the model gradually learned the features of the data during the training process. However, the validation loss curve displayed noticeable fluctuations, which may reflect the inconsistency in feature distribution between the datasets. For instance, images from the Kaggle dataset might have significant differences in terms of shooting angles, lighting conditions, etc., compared to those from the UCI dataset. These discrepancies introduced challenges to the model during learning. Such inconsistencies led to increased fluctuations in the validation set, indicating difficulties in generalizing data from different sources.
The detailed classification performance metrics for the mixed dataset are presented in Table 3. From Table 3, it can be observed that the model's classification performance improved in certain categories, particularly for "plastic" and "paper," with F1 scores increasing to 0.71 and 0.80, respectively. This suggests that the increase in data volume effectively aided the model's learning, leading to a deeper understanding of the characteristics of these categories. However, the F1 scores for some categories, such as "trash" and "metal," remained low, especially for "trash," with an F1 score of only 0.54. This indicates that even with an increased sample size from the mixed dataset, the model still struggles to distinguish certain complex features effectively. This phenomenon is particularly common in waste classification tasks, where differences between certain categories are minimal. For example, "trash" and "plastic" are often misclassified due to their similar materials. From these observations, this research can further explore how to optimize the model and dataset to improve the model's ability to distinguish complex categories, thereby enhancing overall classification performance.
Table 3: Mixed data Classification performance evaluation
precision | recall | f1-score | support | |
food organics | 0.94 | 0.72 | 0.81 | 82 |
miscellaneous trash | 0.78 | 0.63 | 0.70 | 99 |
other trash | 0.64 | 0.59 | 0.62 | 27 |
textile trash | 0.82 | 0.80 | 0.81 | 64 |
vegetation | 0.76 | 1.00 | 0.87 | 87 |
cardboard | 0.87 | 0.82 | 0.84 | 133 |
glass | 0.76 | 0.82 | 0.79 | 111 |
metal | 0.82 | 0.63 | 0.71 | 147 |
paper | 0.81 | 0.81 | 0.81 | 157 |
plastic | 0.69 | 0.87 | 0.77 | 194 |
accuracy | 0.78 | 1101 | ||
macro avg | 0.79 | 0.77 | 0.77 | 1101 |
weighted avg | 0.79 | 0.78 | 0.78 | 1101 |
From the confusion matrix (Figure 7), this research can gain a more detailed understanding of the model's performance across different categories. There is a significant confusion between "Miscellaneous Trash" and "Metal," which results in misclassification for multiple categories. Specifically, the model frequently misclassifies "Miscellaneous Trash" as "Metal," which could be due to the visual similarities between these two types of waste, especially under poor lighting conditions. The confusion matrix also shows that the model has a strong ability to distinguish the "Vegetation" category, achieving a recall rate of 1.00, meaning that the model almost perfectly identifies this category. However, the model performs poorly in classifying "Textile Trash" and "Other Trash," with a high misclassification rate, further indicating that the lack of distinct features for these categories increases the difficulty of classification.
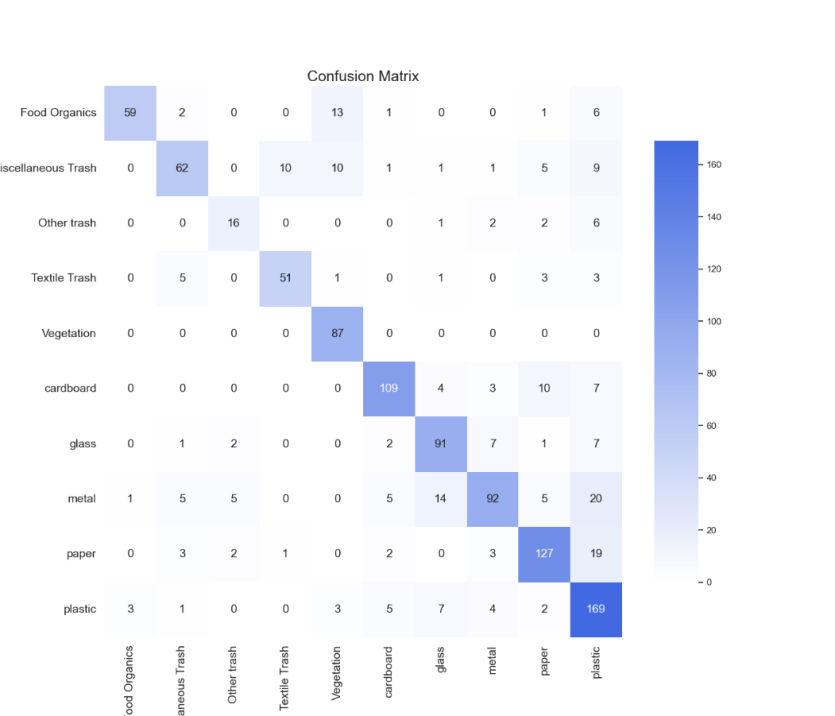
Figure 7: Mixed data confusion matrix
Additionally, the metrics for the macro average and weighted average in Table 3 further reveal the impact of dataset balance on overall model performance. The macro average score is 0.73, which reflects the average performance of the model across different categories. However, the model's subpar performance in those categories reduced the overall macro average score because of the small number of data in those categories. The weighted average, on the other hand, accounts for the number of samples in each category, yielding a better score of 0.76, suggesting that the model functions more steadily in categories with bigger sample quantities.
These results demonstrate that although the mixed dataset increased the diversity of the training data, it also introduced inconsistencies in feature distribution, which affected the model's generalization performance. Especially for categories with fewer samples, the model's performance under complex backgrounds and diverse features remains less than ideal. Future research could further improve the model's performance in small-sample categories by using more diverse data augmentation techniques, such as Generative Adversarial Networks (GANs) and transfer learning, to enhance the model's overall classification performance and generalization ability. These improvements would better address waste classification tasks in complex scenarios, reduce misclassification, and improve resource recovery efficiency.
3.4. Summary of Model Training Results Comparison
Through the analysis of experimental results on three different datasets (Kaggle dataset, UCI dataset, and mixed dataset), this research can observe the varied impact each dataset has on the model's performance.
Firstly, on the Kaggle dataset, the training and validation processes were relatively stable, with the model demonstrating good classification performance, especially achieving high accuracy in categories like "cardboard" and "glass." This indicates that the Kaggle dataset has good data consistency and clear feature distribution, which allows the model to more effectively learn the characteristics of each category.
Secondly, the UCI dataset, which adds diversity in sample quantity and class variety, improved the model’s overall classification performance, especially in categories such as "Vegetation" and "plastic," where the model showed high precision and recall. However, the model had difficulty with complex categories like "Miscellaneous Trash" and "Metal," resulting in more misclassifications. The performance was notably affected by categories with a small number of samples and indistinct features, which indicates that dataset balance plays a crucial role in the model's learning stability.
Finally, the use of the mixed dataset significantly increased the diversity of the training data, potentially improving the model's generalization capability. However, the feature differences from different data sources in the mixed dataset led to more pronounced fluctuations in the validation set, and classification performance even declined in some categories. In particular, the model's performance in the "trash" category was poor, with a low F1 score, reflecting the negative impact of inconsistent feature distributions from different data sources on model performance.
Overall, the three datasets had different effects on the model's training and testing results. The Kaggle dataset demonstrated learning stability, the UCI dataset enriched sample diversity, while the mixed dataset, although increasing data diversity, also introduced new challenges, such as confusion between different data features. Future research should address these challenges, particularly focusing on enhancing the model's robustness against small sample categories and complex background features, to further optimize the overall performance of the waste classification model.
3.5. Discussion
This study reveals the problem of imbalanced datasets, which leads to overfitting or underfitting of the model during training. To solve this problem, in the future, we can increase minority class samples or use data augmentation techniques, such as generative adversarial networks (GANs) to generate synthetic samples or use transfer learning to introduce additional features to improve model performance and reduce classification errors.
To simulate real-world scenarios, data augmentation techniques were introduced in the study, including random rotation, flipping, and brightness adjustment, to improve model robustness and reduce overfitting. However, it is necessary to carefully select augmentation strategies to avoid excessive augmentation affecting model generalization performance. In the future, alternative augmentation methods such as random cropping, gamma correction, and colour jittering can be explored to further optimize the processing of mixed data.
In terms of training, categorical cross-entropy loss is used to monitor training and validation loss and accuracy to track model convergence. To optimize the training process, the ReduceLROnPlateau strategy is applied to automatically reduce the learning rate when the validation loss is stable to prevent local minima. In the future, training efficiency can be improved by fine-tuning the learning rate and batch size and combining advanced optimization algorithms (such as AdamW).
Despite the progress, a model application still faces challenges. The model learning ability needs to be enhanced. It is recommended to increase the sample size or introduce more garbage categories. In addition, deeper network structures (such as EfficientNet or Vision Transformers) can be explored to enhance feature extraction capabilities. Considering practical applications, multimodal data (such as visual and audio inputs) can be integrated to further improve classification accuracy and robustness.
4. Conclusion
This study experimentally analyzed the application of deep learning methods for waste classification tasks and verified the effectiveness and limitations of a CNNs-based waste classification model on three different datasets. Firstly, the experimental results on the original dataset indicated that the model was able to effectively learn the features of certain waste categories, achieving high classification accuracy, particularly for categories with distinct features and sufficient sample sizes. However, the model's performance was relatively poor for categories with fewer samples or similar inter-class features.
For the UCI dataset, the increased number of samples and category diversity positively impacted the overall performance of the model. Particularly for categories with higher feature distinctiveness, the model demonstrated significant improvement in both precision and recall. However, there remained considerable misclassification in some categories, revealing the model's limitations when dealing with complex and diverse data.
The use of a mixed dataset further increased the diversity of training data but also introduced feature differences between different data sources, leading to a decline in the model's classification performance for certain categories. The pronounced fluctuations observed in the validation set indicate the negative impact of inconsistent data sources on the model's generalization capability.
In summary, although CNNs-based deep learning methods have shown potential in waste classification tasks, there are still challenges when it comes to dealing with diverse and complex real-world scenarios. Future research could focus on enhancing the model's generalization capabilities and classification performance through the introduction of data augmentation techniques, improvement of model structures (such as deeper networks or attention mechanisms), and an increase in the number of samples. Additionally, incorporating multimodal data, such as combining visual and auditory information, into the classification system could further improve the model's applicability and stability.
References
[1]. Yu, H., & Han, C. (2022). Overview of technological development in the field of artificial intelligence in 2021. Tactical Missile Technology, (02), 42-51.
[2]. Tang, J., Qi, L., & Guo, T. (2024). Automated visual inventory method based on deep learning [J/OL]. Mechanical and Electrical Engineering Technology, 1-5. Retrieved August 29, 2024, from http://kns.cnki.net/kcms/detail/44.1522.TH.20240828.0925.002.html.
[3]. Cudjoe, D., Nketiah, E., Obuobi, B., et al. (2022). Predicting waste sorting intention of residents of Jiangsu Province, China. Journal of Cleaner Production, 366, 132838.
[4]. UNEP. (2024). Perspectiva Mundial de la Gestión de Residuos 2024, En cumplimiento de la Resolución 2/7 del segundo período de sesiones (UNEP/EA.2/RES.7). Retrieved from https://www.unep.org/es/resources/perspectiva-mundial-de-la-gestion-de-residuos-2024
[5]. World Bank. (2018). Without urgent action, global waste will rise by 70% by 2050. Retrieved from https://www.shihang.org/zh/news/press-release/2018/09/20/global-waste-to-grow-by-70-percent-by-2050-unless-urgent-action-is-taken-world-bank-report
[6]. Zhang, X. (2024). Application of improved Faster R-CNN algorithm in waste classification Doctoral dissertation, Changchun University of Technology.
[7]. Wang, R., Wang, S., & Shi, T. (2024). Introduction to deep learning applications in biomedical fields [J/OL]. Chinese Science: Life Sciences, 1-20. Retrieved September 13, 2024, from http://kns.cnki.net/kcms/detail/11.5840.Q.20240801.1537.006.html.
[8]. Majchrowska, S., Mikołajczyk, A., Ferlin, M., et al. (2022). Deep learning-based waste detection in natural and urban environments. Waste Management, 138, 274-284.
[9]. He, K., Zhang, X., Ren, S., et al. (2016). Deep residual learning for image recognition. In Proceedings of the IEEE Conference on Computer Vision and Pattern Recognition (pp. 770-778).
[10]. Dafang. (2022). Potential applications of deep learning technology in high-precision maps for autonomous driving. Transport Manager World, (13), 154-156.
[11]. Esteva, A., Kuprel, B., Novoa, R. A., et al. (2017). Dermatologist-level classification of skin cancer with deep neural networks. Nature, 542(7639), 115-118.
[12]. Wang, Z. (2020). Research on plant disease leaf image segmentation method and its application in complex environments [Doctoral dissertation, Xijing University].
[13]. Nekouei, F. (2023). Imbalanced garbage classification [Online]. Available: https://www.kaggle.com/code/farzadnekouei/imbalanced-garbage-classification-resnet50/notebook
[14]. Single, S., Iranmanesh, S., & Raad, R. (2023). "RealWaste, " UCI Machine Learning Repository. Available: https://doi.org/10.24432/C5SS4G.
Cite this article
Yu,P. (2024). Garbage Sorting and Processing Based on Convolutional Neural Network. Applied and Computational Engineering,100,72-84.
Data availability
The datasets used and/or analyzed during the current study will be available from the authors upon reasonable request.
Disclaimer/Publisher's Note
The statements, opinions and data contained in all publications are solely those of the individual author(s) and contributor(s) and not of EWA Publishing and/or the editor(s). EWA Publishing and/or the editor(s) disclaim responsibility for any injury to people or property resulting from any ideas, methods, instructions or products referred to in the content.
About volume
Volume title: Proceedings of the 5th International Conference on Signal Processing and Machine Learning
© 2024 by the author(s). Licensee EWA Publishing, Oxford, UK. This article is an open access article distributed under the terms and
conditions of the Creative Commons Attribution (CC BY) license. Authors who
publish this series agree to the following terms:
1. Authors retain copyright and grant the series right of first publication with the work simultaneously licensed under a Creative Commons
Attribution License that allows others to share the work with an acknowledgment of the work's authorship and initial publication in this
series.
2. Authors are able to enter into separate, additional contractual arrangements for the non-exclusive distribution of the series's published
version of the work (e.g., post it to an institutional repository or publish it in a book), with an acknowledgment of its initial
publication in this series.
3. Authors are permitted and encouraged to post their work online (e.g., in institutional repositories or on their website) prior to and
during the submission process, as it can lead to productive exchanges, as well as earlier and greater citation of published work (See
Open access policy for details).
References
[1]. Yu, H., & Han, C. (2022). Overview of technological development in the field of artificial intelligence in 2021. Tactical Missile Technology, (02), 42-51.
[2]. Tang, J., Qi, L., & Guo, T. (2024). Automated visual inventory method based on deep learning [J/OL]. Mechanical and Electrical Engineering Technology, 1-5. Retrieved August 29, 2024, from http://kns.cnki.net/kcms/detail/44.1522.TH.20240828.0925.002.html.
[3]. Cudjoe, D., Nketiah, E., Obuobi, B., et al. (2022). Predicting waste sorting intention of residents of Jiangsu Province, China. Journal of Cleaner Production, 366, 132838.
[4]. UNEP. (2024). Perspectiva Mundial de la Gestión de Residuos 2024, En cumplimiento de la Resolución 2/7 del segundo período de sesiones (UNEP/EA.2/RES.7). Retrieved from https://www.unep.org/es/resources/perspectiva-mundial-de-la-gestion-de-residuos-2024
[5]. World Bank. (2018). Without urgent action, global waste will rise by 70% by 2050. Retrieved from https://www.shihang.org/zh/news/press-release/2018/09/20/global-waste-to-grow-by-70-percent-by-2050-unless-urgent-action-is-taken-world-bank-report
[6]. Zhang, X. (2024). Application of improved Faster R-CNN algorithm in waste classification Doctoral dissertation, Changchun University of Technology.
[7]. Wang, R., Wang, S., & Shi, T. (2024). Introduction to deep learning applications in biomedical fields [J/OL]. Chinese Science: Life Sciences, 1-20. Retrieved September 13, 2024, from http://kns.cnki.net/kcms/detail/11.5840.Q.20240801.1537.006.html.
[8]. Majchrowska, S., Mikołajczyk, A., Ferlin, M., et al. (2022). Deep learning-based waste detection in natural and urban environments. Waste Management, 138, 274-284.
[9]. He, K., Zhang, X., Ren, S., et al. (2016). Deep residual learning for image recognition. In Proceedings of the IEEE Conference on Computer Vision and Pattern Recognition (pp. 770-778).
[10]. Dafang. (2022). Potential applications of deep learning technology in high-precision maps for autonomous driving. Transport Manager World, (13), 154-156.
[11]. Esteva, A., Kuprel, B., Novoa, R. A., et al. (2017). Dermatologist-level classification of skin cancer with deep neural networks. Nature, 542(7639), 115-118.
[12]. Wang, Z. (2020). Research on plant disease leaf image segmentation method and its application in complex environments [Doctoral dissertation, Xijing University].
[13]. Nekouei, F. (2023). Imbalanced garbage classification [Online]. Available: https://www.kaggle.com/code/farzadnekouei/imbalanced-garbage-classification-resnet50/notebook
[14]. Single, S., Iranmanesh, S., & Raad, R. (2023). "RealWaste, " UCI Machine Learning Repository. Available: https://doi.org/10.24432/C5SS4G.