


1. Introduction
In recent years, thanks to the modernization and urbanization of China, the economy of China has grown rapidly, and the requirements of people for quality of life have significantly improved. The problem of air pollution has become one of the most significant obstacles to the pursuit of people seeking a better life. Three aspects, ozone layer destruction, acid rain corrosion, and global warming, have been found to primarily reflect the impact of air pollution on the global climate, as evidenced by studies. It is believed that among the major pollutants that may cause various global climate impacts, PM2.5 occupies the primary position [1]. PM2.5 is the term used to describe small particles in the air that are not larger than 2.5 microns. These particles can penetrate deep into the human respiratory system, causing serious impacts on cardiovascular and respiratory health [2]. They are capable of floating in the air for extended periods, and their concentration levels directly reflect the severity of air pollution. Although PM2.5 is not a significant component of the atmosphere of the Earth, it has a significant impact on the overall quality of the air and key factors such as visual visibility. Compared with larger atmospheric particles, PM2.5 has a higher chemical activity due to its smaller particle size, larger surface area, and enhanced chemical activity, which enables it to absorb and carry toxic and harmful substances like heavy metals and microorganisms more easily. In addition, PM2.5 stays in the atmosphere longer and spreads further, posing a more serious threat to human health and the quality of the atmospheric environment.
There are two categories of PM2.5 prediction models, one for mechanism models and the other for data-driven models [3]. Mechanism models are based on atmospheric physical and chemical principles, capable of detailed description of the entire process of air pollutants from generation to diffusion. However complex environmental factors increase the computational difficulty and cost [3,4]. In contrast, data-driven models generate predictions in a relatively short time through machine learning algorithms. However their effectiveness is highly dependent on data quality, and there may be risks of overfitting or underfitting [5].
Although traditional statistical models and shallow machine learning models have achieved certain results in predicting PM2.5 concentrations, they struggle to capture complex nonlinear relationships. In recent years, deep learning algorithms have shown advantages in processing complex time series data. Bai et al. predicted PM2.5 in Beijing based on the LSTM neural network [6]. Liu et al. decomposed air quality data using EMD and predicted it with the LSTM model [7]. Li et al. predicted air quality by combining XGBoost and LSTM [8]. The LSTM model effectively avoids the risks of overfitting and underfitting, providing a new direction for PM2.5 concentration prediction. The model has the ability to capture long-term dependencies and nonlinear relationships in the data. This is of particular significance for predicting air quality because the influence of various factors on air quality includes meteorological conditions, industrial emissions, and traffic flow [9].
Using Beijing's weather data from 2010 to 2014 as the basic data parameters. This paper integrates hourly PM2.5 concentration data with time, temperature, speed of wind, and other factors to establish a prediction model through the LSTM deep learning algorithm. Identifying the relationship between PM2.5 and various factors is the objective.
2. Methods
2.1. Data Source
The Kaggle website is the source of the dataset used in this study [10]. This dataset presents Beijing's weather data from 2010 to 2014, encompassing a range of meteorological variables. The aforementioned meteorological data can be employed to make a comprehensive prediction of the air quality in Beijing.
In this study, time, Temperature (℃), and Pressure (hPa) are employed as metrics for PM2.5 prediction due to their established correlation with PM2.5 levels in previous research. Furthermore, our dataset is comprehensive and reliable in this regard. Table 1 contains the selected indicators.
Table 1: Selected Indicators
Indicators | Description | Example |
Time | The time of data recording | 2010/1/1 00:00 |
Temperature | The temperature at Beijing Capital International Airpor | -11(℃) |
Pressure | The air pressure at Beijing Capital International Airport | 1021(hPa) |
Lws | The cumulated wind speed at Beijing Capital International Airport | 1.79(m/s) |
PM2.5 | The concentration of PM2.5 in the US Embassy in Beijing | 129(ug/m^3) |
2.2. Method
The concentration of PM2.5 is subject to a number of influencing factors [11], including temporal considerations, temperature and precipitation levels. These factors frequently demonstrate non-linear relationships, which can render prediction models based on traditional statistics or machine learning algorithms incapable of accurately capturing the characteristics of the data, potentially affecting the precision of the resulting predictions. Relevant literature was reviewed and the LSTM model was chosen as the research method. The vanishing gradient problem is an inherent feature of traditional RNNs, which is addressed by an LSTM type of recurrent neural network (RNN) that aims to address it [12]. The relative insensitivity of LSTMs to gap length represents a considerable edge over other RNNs, hidden Markov models, and other sequence learning approaches. The aim is to create an immediate memory for RNNs that can endure thousands of timesteps, thus justifying the designation "long short-term memory". It is our contention that the use of LSTM as the research method for our paper is highly appropriate, given that it is capable of handling the aforementioned dataset with great efficacy.
The architecture of LSTM comprises a memory cell, along with three control gates surrounding this cell: the input gate, the forget gate, and the output gate. This processing flow can be illustrated and comprehended through Figure 1.
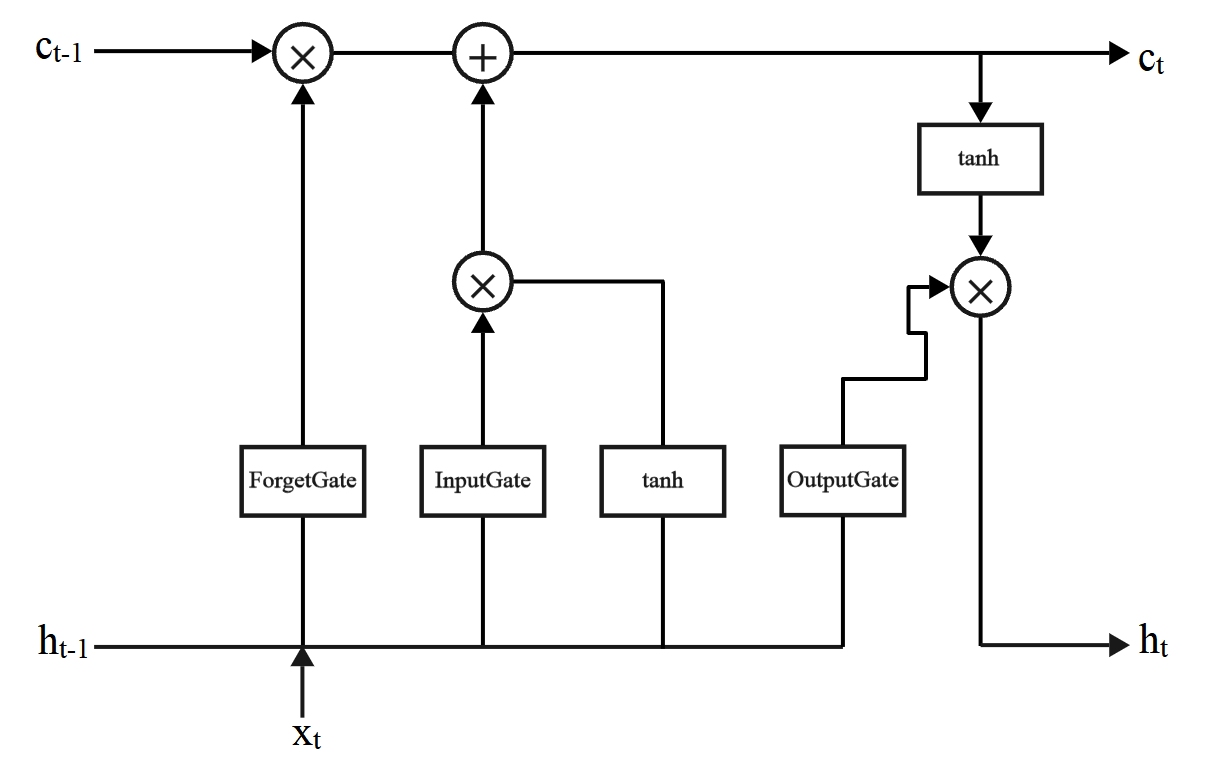
Figure 1: LSTM Flowchart
Adding new information to the memory cell is decided by the input gate. The forget gate is responsible for selecting which old information to delete or ignore from the memory cell. The current state of the memory cell is determined by the output gate, which determines which information to output.
The formula for the forget gate:
\( {f_{t}}=σ({W_{f}}∙[{h_{t-1}},{x_{t}}]+{b_{f}})\ \ \ (1) \)
The formula for the input gate:
\( {i_{t}}=σ({W_{i}}∙[{h_{t-1}},{x_{t}}]+{b_{i}})\ \ \ (2) \)
\( {\widetilde{c}_{t}}=tanh{({W_{c}}∙[{h_{t-1}},{x_{t}}]+{b_{c}})}\ \ \ (3) \)
The formula for the cell at time t:
\( {c_{t}}={f_{t}}∙{c_{t-1}}+{i_{t}}∙{\widetilde{c}_{t}}\ \ \ (4) \)
The formula for the output gate:
\( {o_{t}}=σ({W_{o}}∙[{h_{t-1}},{x_{t}}]+{b_{o}})\ \ \ (5) \)
\( {h_{t}}={o_{t}}∙tanh{({c_{t}})}\ \ \ (6) \)
W is the weight matrix, b is the bias term, \( σ \) is the sigmoid function, \( [{h_{t-1}},{x_{t}}] \) signifies the amalgamation of two vectors into a longer vector.
3. Results and Discussion
The analysis results are presented in this section and the findings associated with PM2.5 prediction are discussed based on deep learning models. The discussion is structured around key meteorological variables that influence PM2.5 levels and how these factors are incorporated into the LSTM model to enhance its predictive power [13].
3.1. Data Visualisation and Analysis
To comprehend the connections between PM2.5 concentrations and meteorological factors, a variety of data visualization techniques were employed. These visualizations facilitate the comprehension of temporal trends, correlations, and distribution patterns, which are essential for the development of an effective deep learning model.
3.1.1. Temporal Trends of PM2.5 Concentration
Figure 2 displays the variation in PM2.5 concentrations over the period. The graph shows several distinct peaks in PM2.5 concentrations, indicating possible pollution events related to specific weather conditions, seasons or human activities. Examples include straw burning and the use of domestic heating in winter. Time series analysis shows a cyclical pattern in PM2.5 concentrations, suggesting that certain seasons or weather conditions are associated with elevated pollution levels. For predicting such data, LSTM models are advantageous.
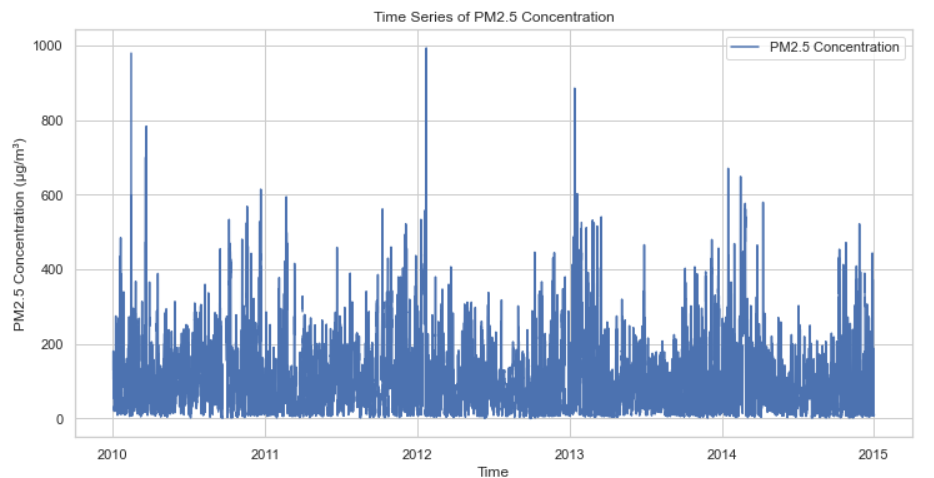
Figure 2: Variability of PM2.5 concentrations
3.1.2. Relationships Between PM2.5 and Meteorological Variables
Figure 3 presents a scatter plot matrix (pair plot), which examines the connections between PM2.5 concentration and essential meteorological variables, including temperature (TEMP), pressure (PRES), and wind speed (Iws). To select the most suitable features for the LSTM model, it's important to comprehend the relationships between these variables [14].
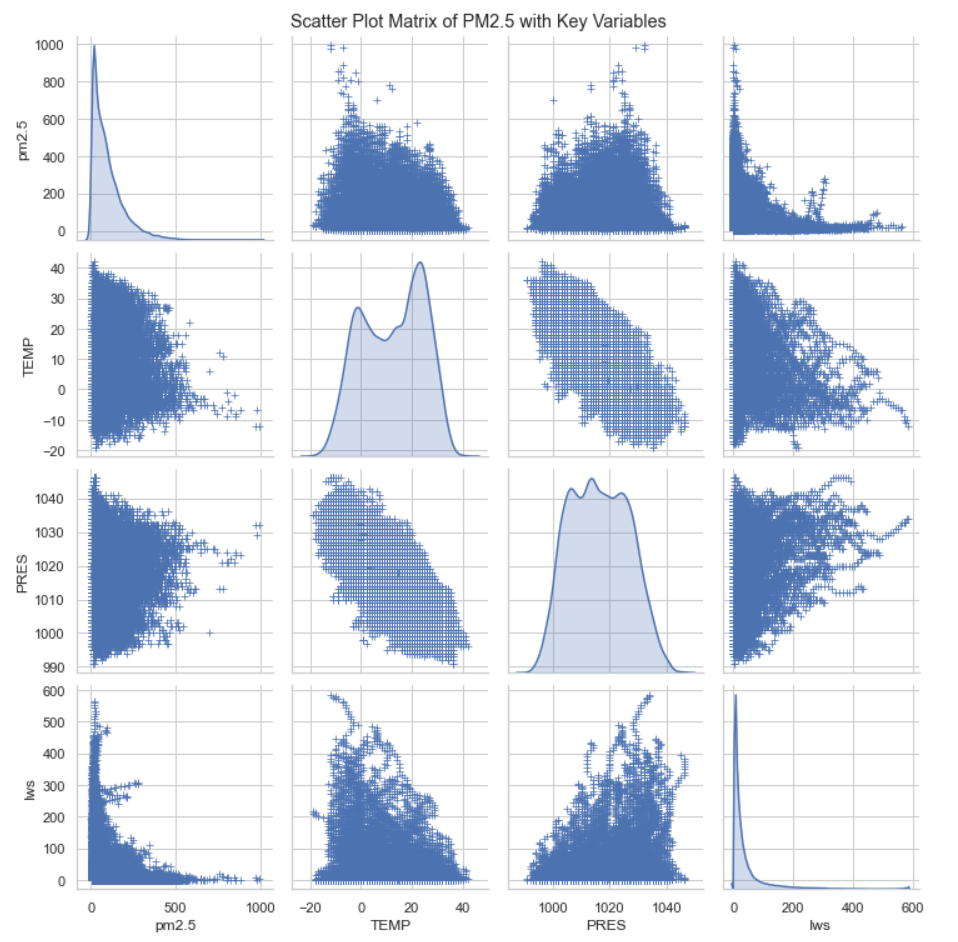
Figure 3: Interrelation between PM2.5 concentration and meteorological variables
The scatter plot matrix provides insight into several key areas. The connection between PM2.5 and temperature is as follows: A moderate negative correlation is observed between PM2.5 concentrations and temperature, which suggests that the temperature will rise and may facilitate the dispersion of pollutants through increased atmospheric mixing. PM2.5 and Wind Speed (Iws): Wind speed and PM2.5 levels have an inverse relationship. Consequently, PM2.5 concentrations can be reduced by diluting airborne pollutants with higher wind speeds. PM2.5 and Pressure (PRES): The relationship between PM2.5 and pressure is less pronounced but still suggests that pressure changes could impact pollutant dispersion, particularly during certain weather events. For example, sandstorms are often a feature of winter in Beijing.
3.2. Projected Results Analysis
The LSTM model was developed for the purpose of predicting PM2.5 concentrations, utilising the selected meteorological variables as input features. Historical data was used to train the model in order to capture the temporal dependencies and nonlinear relationships among the variables. Figure 4 shows the results of the model, which shows a comparison between the predicted and actual PM2.5 concentrations. The model predictions are less accurate for extreme cases, which may be due to the insufficient amount of data in these cases and the inherent difficulty of a single LSTM model in accurately predicting the data.
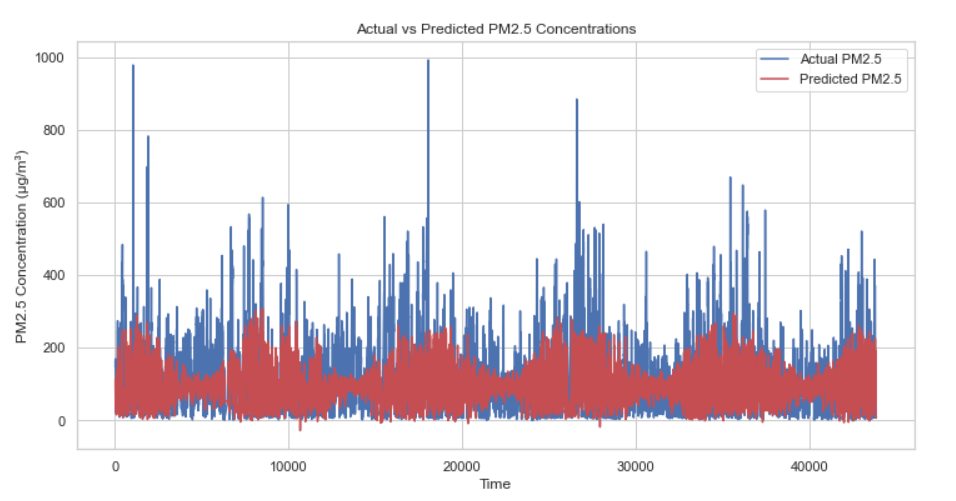
Figure 4: The results of the model
3.3. Discussion
The LSTM model exhibits robust predictive capabilities with regard to PM2.5 concentration levels, effectively capturing the temporal dependencies and nonlinear connections between PM2.5 and essential meteorological variables.
The model's performance is as follows: The predictive capacity of the LSTM model for PM2.5 concentrations is markedly enhanced by the incorporation of variables such as temperature and wind speed, which have been demonstrated to exhibit a robust correlation with PM2.5 levels. This indicates that incorporating these variables as features in the LSTM model is both appropriate and beneficial.
The practical implications of this research are as follows: The model's predictive capacity has implications for public health and policy-making in a practical sense. By accurately forecasting periods of elevated pollution, the model can inform the timely implementation of interventions, such as the issuance of air quality alerts and the implementation of traffic or industrial emission controls. The following limitations are inherent to the model: Despite its considerable merits, the LSTM model is not without certain limitations.
The model's performance depends on both the quality and the quantity of the input data. The model's generalisability may be affected by its limited geographic and temporal coverage.
The complexity of the LSTM model necessitates the allocation of considerable computational resources and time for training, which may restrict its applicability in real-time scenarios.
Additional meteorological variables should be considered when conducting further research, such as humidity and solar radiation, and other non-meteorological factors, like emissions from specific sources. Furthermore, exploring hybrid models that combine deep learning with other machine learning techniques could enhance predictive accuracy.
4. Conclusion
The use of meteorological variables as input features in an LSTM model can be utilized to predict PM2.5 concentrations, as demonstrated in this paper. The results from the LSTM model showcase its predictive capabilities, effectively capturing the temporal dependencies and nonlinear relationships between PM2.5 and meteorological variables. During the data preprocessing stage, missing values were addressed, and preliminary data analysis was conducted. Data visualization techniques were employed to illustrate the nonlinear relationships between meteorological factors and PM2.5 concentrations. With regard to the results, the graph of correlation enables a straightforward observation of the strong link between PM2.5 concentration and barometric pressure and temperature. The LSTM model also exhibits enhanced prediction capability for PM2.5; however, it is challenging to address the prediction in certain extreme cases. It may be challenging for a single model to be applied to this kind of complex prediction, and future research should consider composite models for data prediction.
Authors Contribution
All the authors contributed equally and their names were listed in alphabetical order.
References
[1]. Xu, Y., & Wu, J. (2023). Short-term PM2.5 prediction based on machine learning (in Chinese). Computers and Telecommunications, (12), 72-77.
[2]. Huang, C.-J., & Kuo, P.-H. (2018). A deep CNN-LSTM model for particulate matter (PM2.5) forecasting in smart cities. Sensors, 18(7), 2220.
[3]. Xiao, W., He, Y., Meng, F., Xu, J., Liu, S., & Yang, X. (2018). Development and comparison of atmospheric chemistry mechanisms in air quality models (in Chinese). Journal of Environmental Engineering Technology, (01), 12-22.
[4]. Yang, Q., Jin, C., Li, T., Yuan, Q., Shen, H., & Zhang, L. (2022). Research progress and challenges of data-driven quantitative remote sensing (in Chinese). Journal of Remote Sensing, (02), 268-285.
[5]. Li, Z., Zhang, T., & Li, H. (2023). Prediction of PM2.5 concentration based on XGBoost and LSTM combined model (in Chinese). Journal of Hebei Institute of Architecture and Civil Engineering, (04), 219-223.
[6]. Bai, S. N., & Shen, X. L. (2019). PM2.5 prediction based on LSTM recurrent neural network. Computer Applications and Software, (01), 67-70+104.
[7]. Liu, M., & Wei, L. (2020). EMD-LSTM algorithm and its application in PM2.5 prediction. Journal of Changchun University of Technology, (04), 322-327+417.
[8]. Li, Z. Y., Zhang, T. Y., & Li, H. Q. (2023). PM2.5 concentration prediction based on the XGBoost and LSTM combined model. Journal of Hebei University of Architecture and Engineering, (04), 219-223.
[9]. Mo, W. (2022). Research on air quality prediction based on deep learning (Master's thesis, East China Normal University) (in Chinese). Master's thesis. https://link.cnki.net/doi/10.27149/d.cnki.ghdsu.2022.004253 doi:10.27149/d.cnki.ghdsu.2022.004253.
[10]. Zia, U. (2024). Predict air quality in Beijing, China. Kaggle. https://www.kaggle.com/datasets/stealthtechnologies/preeeeeeee.
[11]. Qu, Y., Qian, X., Song, H., He, J., Li, J., & Xiu, H. (2024). Machine-learning-based model and simulation for air quality prediction.
[12]. Colah. (2015, August 27). Understanding LSTM networks. https://colah.github.io/posts/2015-08-Understanding-LSTMs/
[13]. Yan, J., & Wang, G. (2022). Self-variable weights-based CNN & LSTM combination for PM2.5 concentration prediction: A case study in Beijing. Advances in Applied Mathematics, 11(4), 2095-2106.
[14]. Bai, S., & Shen, X. (2019). Prediction of PM2.5 based on LSTM recurrent neural network. Computer Applications and Software, 36(1), 67-70.
Cite this article
Li,Y.;Wu,J. (2024). Prediction of Beijing's PM2.5 Concentration Based on the LSTM Model. Applied and Computational Engineering,112,35-41.
Data availability
The datasets used and/or analyzed during the current study will be available from the authors upon reasonable request.
Disclaimer/Publisher's Note
The statements, opinions and data contained in all publications are solely those of the individual author(s) and contributor(s) and not of EWA Publishing and/or the editor(s). EWA Publishing and/or the editor(s) disclaim responsibility for any injury to people or property resulting from any ideas, methods, instructions or products referred to in the content.
About volume
Volume title: Proceedings of the 5th International Conference on Signal Processing and Machine Learning
© 2024 by the author(s). Licensee EWA Publishing, Oxford, UK. This article is an open access article distributed under the terms and
conditions of the Creative Commons Attribution (CC BY) license. Authors who
publish this series agree to the following terms:
1. Authors retain copyright and grant the series right of first publication with the work simultaneously licensed under a Creative Commons
Attribution License that allows others to share the work with an acknowledgment of the work's authorship and initial publication in this
series.
2. Authors are able to enter into separate, additional contractual arrangements for the non-exclusive distribution of the series's published
version of the work (e.g., post it to an institutional repository or publish it in a book), with an acknowledgment of its initial
publication in this series.
3. Authors are permitted and encouraged to post their work online (e.g., in institutional repositories or on their website) prior to and
during the submission process, as it can lead to productive exchanges, as well as earlier and greater citation of published work (See
Open access policy for details).
References
[1]. Xu, Y., & Wu, J. (2023). Short-term PM2.5 prediction based on machine learning (in Chinese). Computers and Telecommunications, (12), 72-77.
[2]. Huang, C.-J., & Kuo, P.-H. (2018). A deep CNN-LSTM model for particulate matter (PM2.5) forecasting in smart cities. Sensors, 18(7), 2220.
[3]. Xiao, W., He, Y., Meng, F., Xu, J., Liu, S., & Yang, X. (2018). Development and comparison of atmospheric chemistry mechanisms in air quality models (in Chinese). Journal of Environmental Engineering Technology, (01), 12-22.
[4]. Yang, Q., Jin, C., Li, T., Yuan, Q., Shen, H., & Zhang, L. (2022). Research progress and challenges of data-driven quantitative remote sensing (in Chinese). Journal of Remote Sensing, (02), 268-285.
[5]. Li, Z., Zhang, T., & Li, H. (2023). Prediction of PM2.5 concentration based on XGBoost and LSTM combined model (in Chinese). Journal of Hebei Institute of Architecture and Civil Engineering, (04), 219-223.
[6]. Bai, S. N., & Shen, X. L. (2019). PM2.5 prediction based on LSTM recurrent neural network. Computer Applications and Software, (01), 67-70+104.
[7]. Liu, M., & Wei, L. (2020). EMD-LSTM algorithm and its application in PM2.5 prediction. Journal of Changchun University of Technology, (04), 322-327+417.
[8]. Li, Z. Y., Zhang, T. Y., & Li, H. Q. (2023). PM2.5 concentration prediction based on the XGBoost and LSTM combined model. Journal of Hebei University of Architecture and Engineering, (04), 219-223.
[9]. Mo, W. (2022). Research on air quality prediction based on deep learning (Master's thesis, East China Normal University) (in Chinese). Master's thesis. https://link.cnki.net/doi/10.27149/d.cnki.ghdsu.2022.004253 doi:10.27149/d.cnki.ghdsu.2022.004253.
[10]. Zia, U. (2024). Predict air quality in Beijing, China. Kaggle. https://www.kaggle.com/datasets/stealthtechnologies/preeeeeeee.
[11]. Qu, Y., Qian, X., Song, H., He, J., Li, J., & Xiu, H. (2024). Machine-learning-based model and simulation for air quality prediction.
[12]. Colah. (2015, August 27). Understanding LSTM networks. https://colah.github.io/posts/2015-08-Understanding-LSTMs/
[13]. Yan, J., & Wang, G. (2022). Self-variable weights-based CNN & LSTM combination for PM2.5 concentration prediction: A case study in Beijing. Advances in Applied Mathematics, 11(4), 2095-2106.
[14]. Bai, S., & Shen, X. (2019). Prediction of PM2.5 based on LSTM recurrent neural network. Computer Applications and Software, 36(1), 67-70.