


1. Introduction
Expected Goals (xG) is a prominent metric in modern soccer analytics that quantifies the probability of a shot resulting in a goal based on various characteristics [1], [2]. The metric assigns a value between 0 and 1 to each shot, with higher values indicating greater scoring probability [3]. This probability is calculated by analyzing thousands of historical shots with similar characteristics, including distance to goal, angle, body part used, and contextual factors such as preceding pass type and defensive positioning [1], [4]. While different providers like Opta and Understat employ varying algorithms, they analyze similar core features while continuously refining contextual elements to improve accuracy [5], [6], [7].
The significance of xG extends beyond traditional scoring metrics, offering insights into team and player performance patterns. It reveals offensive capabilities and highlights disparities between actual and expected goals, which can indicate performance levels influenced by finishing ability, defensive resilience, or variance in luck [2]. Post-Shot Expected Goals (PSxG), a specialized adaptation, further enhances analysis by considering on-target shot placement and goalkeeper positioning, providing a more nuanced evaluation of goalkeeper performance [1], [3].
xG has revolutionized soccer analytics by establishing an objective framework for shot quality assessment. This framework enhances team evaluation, scouting processes, and predictive modeling by forecasting scoring trends [6]. It enables coaches and analysts to identify optimal scoring opportunities and supports tactical decision-making through data-driven insights.
2. Literature review
Opta and Understat represent two of the most widely utilized publicly available xG providers [8]. A significant challenge in comparing these models stems from limited algorithmic transparency, a persistent issue in soccer analytics research [9]. Different providers employ distinct machine-learning approaches, resulting in varying feature weights for shot evaluation [10]. Cross-comparisons between StatsBomb, Opta, and Understat have revealed average absolute errors of approximately 1 xG, with extreme variations reaching 3.88 xG for certain teams like Manchester City.
To address model biases, analysts have proposed composite models averaging xG values across providers [11]. BeatTheBookie demonstrates that such approaches offer more balanced assessments by smoothing extreme deviations. Their research indicates that Understat shows the highest reliability across Europe's top five leagues, particularly in the Premier League, though this consistency diminishes in lower-tier competitions.
Analysis of the 2021-2022 Premier League season revealed consistent patterns across models: lower-ranked teams typically underperformed their xG expectations, while elite teams like Liverpool and Manchester City consistently outperformed predictions [12]. These variations highlight that while xG models provide valuable insights, they cannot fully account for complex match dynamics such as psychological factors or tactical adjustments that influence team performance.
In this paper, we aim to provide a comprehensive comparison of the Opta and Understat xG models by analyzing their predictive accuracy and the factors that drive their predictions across the top European leagues. By focusing on key features like goal exposure angle, shooting angle, and shot distance, our study highlights the strengths and limitations of each model in capturing goal probabilities [7]. This comparison is valuable for optimizing xG model selection based on league-specific characteristics, ultimately contributing to improved decision-making in soccer analytics [4].
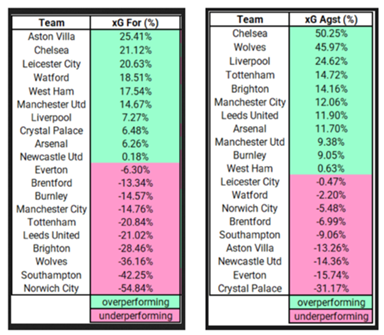
Figure 1. Premier League Team xG For and Against Performance Analysis.
3. Data sourcing and processing
The data used in this study was collected from two xG models: Opta and Understat. To analyze the predictive accuracy of these models, three numerical values were collected: real goals scored, Understat xG, and Opta xG, spanning seven seasons (2017-2018 to 2023-2024) across Europe's top five leagues (Bundesliga, LaLiga, Ligue 1, Premier League, and Serie A). The Opta xG data and actual goals were sourced from FBref.com, while Understat xG values were obtained from Understat.com. For analyzing feature significance, we examined statistical variables for every shot in the 2020-2021 Premier League season, chosen for its recency and data availability. The dataset included both spatial and contextual features: shot coordinates (x,y), match minute, situation type, shot type, last action before the shot, distance to the goal, and xG values from both models. Additional data was sourced from the SportsVizSunday GitHub repository. To enhance the feature importance analysis, we calculated two additional geometric variables: the shooting angle (measured relative to the axis perpendicular to the goal's midpoint) and the goal exposure angle. In which, shooting angel is the angle of the shot to the axis perpendicular to the mid-point of the goal:
\( Shooting angle (ø)={tan^{-1}}{(\frac{|0.5-Y|}{1-x})} \)
and goal exposure angle, which is the angle between the line segments from the position of the shot to the position of each goal post:
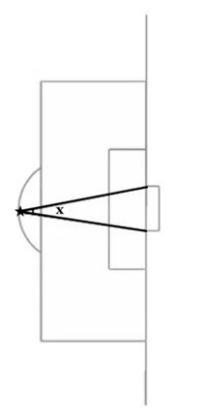
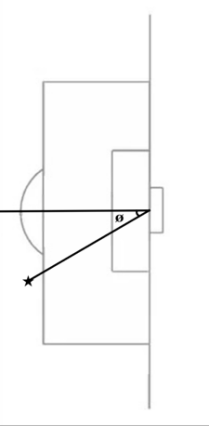
Figure 2. Diagram illustrating shot angle (ø) and goal exposure angle (x) for a specific shot (★).
\( Goal exposure angle (x)={cos^{-1}}{(\frac{{(0.55-Y)^{2}}+2{*(1-X)^{2}}+{(0.45-Y)^{2}}-0.01}{2*\sqrt[]{({0.55-Y)^{2}}{+(1-X)^{2}}}*\sqrt[]{({0.45-Y)^{2}}{+(1-X)^{2}}}})} \)
The collected data was organized in a CSV file containing key shot characteristics and imported into a Pandas DataFrame for analysis. The dataset included both numerical variables (match minute, X-Y coordinates, distance, shooting angle, and goal exposure angle) and categorical features (situation, shot type, and last action). The target variable was binary encoded, with goals assigned a value of 1 and non-goals assigned 0, implemented using a lambda function on the 'result' column. Data preprocessing was performed using scikit-learn's ColumnTransformer, applying StandardScaler to normalize numerical features and OneHotEncoder to transform categorical variables into binary representations. This preprocessing step ensured all features were appropriately formatted and scaled for subsequent machine learning analysis. The following section details the methodology of our analysis.
4. Methodology
The analysis of the performance and feature significance of the Opta and Understat xG models consists of two sections. First, the predictive accuracy of the models was assessed by applying L1 and L2 loss functions, comparing the predicted values of Opta and Understat xG with actual goals. L1 loss measured the mean absolute error, while L2 loss captured the mean squared error, providing a comprehensive evaluation of the prediction accuracy. Second, to analyze feature importance, a Random Forest regressor and an XGBoost regressor were used to analyze how each shot's variables—distance, angle, shot type, and other variables—contribute to goal predictions. Both regressors were applied to ensure robust results. For feature importance interpretation and visualization, SHAP swarm plots were provided.
4.1. Predictive Accuracy
The Opta and Understat xG models were compared by calculating L1-loss and L2-loss across the five leagues. The sum of xG values for the teams in each league was calculated and compared to the real goals for evaluation. L1-loss, or mean absolute error, computes the average magnitude of the differences between predicted xG and actual goals, while L2-loss, or mean squared error, computes the errors while including their square, penalizing larger deviations more than L1-loss. Each of these metrics was computed separately for each league; results were then combined as an aggregate evaluation of overall performance across all leagues. Moreover, to inspect model stability in more detail, the average L1-loss and its standard deviation were calculated for each model in every league, allowing for an examination of general predictive accuracy and the dispersion of performance within seasons.
Modeled xG was compared in detail with actual goals for the Premier League across team rankings from the 2017-2018 season through the 2023-2024 season. This analysis aimed to identify patterns of over- and under-predictions by team ranking position in the league table. K-means clustering will be used to divide teams into top-table and bottom-table clusters. This approach helps to determine whether the models systematically overestimated or underestimated the performance of teams at the top and bottom ends of the league table. The residuals—the difference between the predicted xG and actual goals—were calculated to quantify how much each model differed from the actual outcome.
4.2. Feature importance
Two machine learning models were implemented: Random Forest and XGBoost classifiers, both wrapped around scikit-learn Pipelines. Each pipeline combined the preprocessing step with model training for consistency and smooth data processing.
• Random Forest Classifier: An instance of RandomForestClassifier was created with 100 estimators; the random state has been set to 42 for reproducibility.
• XGBoost Classifier: The classification is performed using XGBClassifier with 100 estimators. The used parameters are use_label_encoder=False to prevent the encoding of labels and eval_metric= 'logloss' to measure binary classification performance.
Both models were fitted on the preprocessed feature set and the target variable. Because there were two sets of data, namely Opta and Understat, a separate model was trained for each. Thus, a total of four models were fitted: Random Forest and XGBoost for both Opta and Understat.
After training, feature importance was extracted to determine the contribution of each feature in predicting goal outcomes. Feature importance was directly available in Random Forest through the feature_importances_ attribute for each variable. Similarly, feature importance values were extracted from the feature_importances_ attribute for XGBoost.
Since the categorical variables had already been one-hot encoded during preprocessing, a function was written to sum the feature importance of one-hot-encoded features, providing an overall importance score for categorical features like situation, shot type, and last action.
These importance values were then combined into a final feature importance table that compared each feature's importance for the two models—Random Forest and XGBoost—across both datasets, Opta and Understat. This allowed for the comparison of the importance of different shot features with respect to their predictions on goal outcomes.
4.3. SHAP analysis for feature interpretation
SHAP (SHapley Additive exPlanations) values were calculated as an additional means of interpreting each feature's contribution to model predictions. The trained models were fed into the explainer functions of the SHAP library, which calculated the Shapley values for each feature. SHAP swarm plots were then generated to show the distribution of SHAP values across all features for both the Random Forest and XGBoost models. These swarm plots provided an overlay of SHAP values for each feature, allowing a comprehensive visualization of how features like minute, distance, shooting angle, and goal exposure angle influence the probability of a shot being classified as a goal. The SHAP value analysis was conducted separately for the Opta and Understat datasets, with swarm plots generated for both the Random Forest and XGBoost models, offering a visual representation of how features affect the probability of a shot resulting in a goal.
5. Results
In this section, we analyze the results of the predictive accuracy and feature significance.
5.1. Original model evaluation
This section evaluates the predictive performance of the original Opta and Understat xG models through L1-loss and L2-loss metrics, providing insights into their accuracy and consistency across Europe's top leagues.
Analysis of L1-loss and L2-loss metrics reveals distinct performance patterns between Understat and Opta xG models across European leagues. Understat demonstrated superior performance in three of five leagues, most notably in the Bundesliga and Premier League. Opta showed better accuracy in La Liga and Ligue 1, though with smaller margins of difference. (Table 1-2)
Aggregated results across all leagues favor Understat, with lower total L1-loss (3,954.04 vs. 4,096.00) and L2-loss (37,572.16 vs. 40,372.08). Mean L1-loss analysis shows Understat performing particularly well in the Bundesliga (M = 93.25) and Premier League (M = 107.15), while Opta maintained stronger performance in La Liga (M = 116.87) and Ligue 1 (M = 116.59).
Standard deviation analysis indicates varying stability between models across leagues. Opta showed remarkable consistency in the Premier League (SD = 11.13), while Understat demonstrated stable performance in the Bundesliga (SD = 16.02). However, both models exhibited higher variability in other leagues, particularly La Liga (Understat SD = 32.29, Opta SD = 25.44), suggesting league-specific characteristics influence model stability.
Table 1. L1-loss and L2-loss of Opta and Understat xG across the top five European leagues: Bundesliga, La Liga, Ligue 1, Premier League, and Serie A.
L1-Loss | L2-Loss | |||
Opta xG | Understat xG | Opta xG | Understat xG | |
Bundesliga | 729.70 | 652.72 | 7,317.45 | 5,936.62 |
LaLiga | 818.10 | 862.07 | 7,179.13 | 8,458.30 |
League 1 | 816.10 | 836.94 | 8,107.33 | 8,163.48 |
Premier League | 863.20 | 750.05 | 8,562.86 | 6,120.40 |
SerieA | 868.90 | 852.26 | 9,205.31 | 8,893.36 |
Total | 4,096.00 | 3,954.04 | 40,372.08 | 37,572.16 |
Table 2. Summary of mean L1-loss (M) and standard deviations (SD) for both Opta and Understat xG models across the top five European leagues.
Opta xG | Understat xG | |||
M | SD | M | SD | |
Bundesliga | 104.24 | 17.79 | 93.25 | 16.02 |
LaLiga | 116.87 | 25.44 | 123.15 | 32.29 |
League 1 | 116.59 | 32.16 | 119.56 | 22.95 |
Premier League | 123.31 | 11.13 | 107.15 | 17.72 |
SerieA | 124.13 | 19.81 | 121.75 | 26.12 |
Total | 585.14 | 106.32 | 564.86 | 115.10 |
Figure 3. Premier League Goals Analysis with Cutoff Points (2017-2024).
(Figure 3 presents a comparison of the number of real goals and xG predictions across Premier League rankings for each season from 2017-2018 to 2023-2024. For each ranking position from 1 through 20, real goals scored by teams are compared to the Understat xG and Opta xG predictions. The vertical lines represent the cutoff separating top-table and bottom-table teams using k-means clustering.)
K-means clustering analysis reveals systematic biases in both xG models' predictions across Premier League rankings (2017-2024). Both models exhibit a pattern of overestimating xG for bottom-table teams while underestimating for top-table teams (Figure 3).
Residual analysis shows that Opta produces larger prediction errors than Understat for top-five teams, consistently underpredicting their goal-scoring performance. For lower-ranked teams, Understat shows larger but less consistent overprediction compared to Opta (Figures 4, 5). While Understat generally achieves lower residuals overall, both models demonstrate limitations in capturing extreme performance cases, particularly the superior goal-scoring efficiency of top teams and the lower conversion rates of bottom teams.
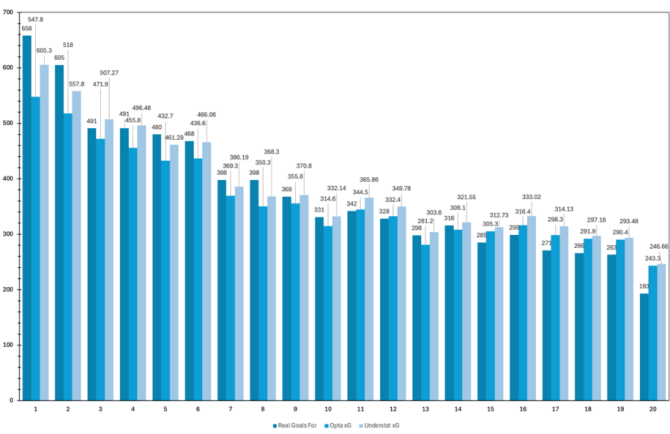
Figure 4. Comparison of Real Goals and xG Predictions Across Premier League Rankings (2017-2018 to 2023-2024 Seasons). This graph compares the total number of real goals scored by teams at each ranking position (1 through 20) with the Understat xG and Opta xG predictions for those teams.
Figure 5. Residual Analysis of xG Models Compared to Real Goals (Premier League Rankings, 2017-2018 to 2023-2024 Seasons). This graph shows the total residuals of both xG models compared to real goals scored across Premier League rankings. Negative residuals indicate underprediction, while positive values represent overprediction.
5.2. Feature importance analysis
Table 3: Feature Importance Values for Random Forest and XGBoost Models Predicting Expected Goals (xG) Using Opta and Understat Data.
Opta | Understat | |||
Random Forest | XGBoost | Random Forest | XGBoost | |
Minute | 0.0457 | 0.0386 | 0.0237 | 0.0158 |
X coordinate | 0.0408 | 0.0463 | 0.0264 | 0.0305 |
Y coordinate | 0.0534 | 0.0287 | 0.0335 | 0.0177 |
Situation | 0.038 | 0.025 | 0.072 | 0.075 |
Shot type | 0.037 | 0.054 | 0.115 | 0.200 |
Last Action | 0.057 | 0.132 | 0.107 | 0.181 |
Distance | 0.114 | 0.125 | 0.073 | 0.105 |
Shooting angle | 0.289 | 0.094 | 0.162 | 0.067 |
Goal Exposure Angle | 0.325 | 0.454 | 0.386 | 0.307 |
The analysis of feature importance across Random Forest and XGBoost models, using both Opta and Understat xG predictions, highlights key differences in the factors contributing to xG estimation. Table 3 presents the adjusted significance values for important variables: minute, shot location, X and Y coordinates, situation, shot type, last action, distance, shooting angle, and goal exposure angle.
Goal Exposure Angle emerged as the most influential variable in both xG models. In XGBoost, it achieved the highest significance value: 0.454 for Opta and 0.307 for Understat. This finding emphasizes the critical role of shot positioning relative to the goal, as a more favorable angle increases the likelihood of scoring (Table 3). The Opta model exhibits a step-like drop-off for the -0.05 SHAP values, suggesting that when the goal exposure angle is poor, the model abruptly reduces the xG estimate, effectively "capping" it. This behavior implies that Opta imposes a stricter interpretation on shots taken from suboptimal angles, leading to a significant reduction in their predicted impact. In contrast, the Understat model's SHAP values decrease more smoothly and gradually as the goal exposure angle worsens, indicating a more continuous adjustment based on goal exposure, potentially considering other contributing factors even when the shot angle is unfavorable. The smoother transition observed in Understat may suggest a more nuanced interaction of this variable with other shot characteristics.
Shooting Angle is also a significant factor, particularly in the Random Forest model for Opta, where its importance is 0.289. This aligns with the intuitive understanding that the angle of a shot influences conversion chances, with tighter angles typically associated with lower success rates. However, the Understat model assigns a lower significance value of 0.067 to the shooting angle, which may indicate a different weighting of this variable in its xG calculation.
Distance is an important variable, especially in the XGBoost models, with significance values of 0.125 for Opta and 0.105 for Understat. This finding underscores the importance of shot distance in predicting xG, consistent with the expectation that closer shots are more likely to result in goals (Table 3). The SHAP values for the Opta model are more widely distributed, particularly for longer distances, indicating that distance is more emphasized as a determining factor in Opta's predictions. The transition from negative to positive SHAP values for shorter distances demonstrates the model's recognition of the increased likelihood of scoring from closer ranges. Conversely, the Understat model shows less variation in SHAP values for longer distances, suggesting that it places less emphasis on very long shot distances, possibly relying more on other contextual features for xG prediction (Figure 6).
Last Action is another significant factor, especially in the XGBoost models for both data sources. The importance value is 0.132 for Opta and 0.182 for Understat, indicating that the context preceding the shot—such as the previous play or pass—has a substantial impact on the probability of scoring. This result implies that successful sequences of play leading up to shots are crucial for xG estimation (Table 3).
Shot Type also demonstrates substantial variability in importance. In the Understat Random Forest model, it holds an importance value of 0.115, whereas in XGBoost, it rises to 0.200. This suggests that different shot types, such as headers and volleys, significantly influence scoring probability, with Understat placing greater emphasis on this feature compared to Opta (Table 3).
The SHAP plots for categorical variables (shot type, situation, last action) reveal distinct cruciform patterns in the Opta model, indicating that certain categories are particularly influential in predicting xG. The greater vertical spread in the Opta model suggests higher variability in the influence of different categories, with some contributing more positively or negatively to the xG output. In contrast, the Understat model shows a less pronounced cruciform pattern, suggesting a more homogeneous treatment of these categorical variables and less differentiation in their influence compared to Opta (Figure 6).
The X and Y Coordinates of shot locations show limited significance across the models, with X coordinates having importance values of 0.041 and 0.046 in Opta's Random Forest and XGBoost models, respectively, and Y coordinates having values of 0.053 and 0.029. These findings indicate that while shot positioning contributes to xG estimation, it is less influential than other factors such as goal exposure angle and shot distance (Table 3). The SHAP values for the Opta model are closely grouped around zero, indicating minimal reliance on shot coordinates. The Understat model, while exhibiting slightly more variance, similarly shows that shot location plays a relatively minor role in predictions (Figure 6).
Finally, the minute of the match consistently shows minimal impact across both models, as indicated by flat SHAP value distributions. This suggests that the timing of the shot within the match has little influence on xG predictions for either Opta or Understat, aligning with the understanding that xG is more dependent on spatial and contextual shot characteristics rather than the temporal component (Figure 6).
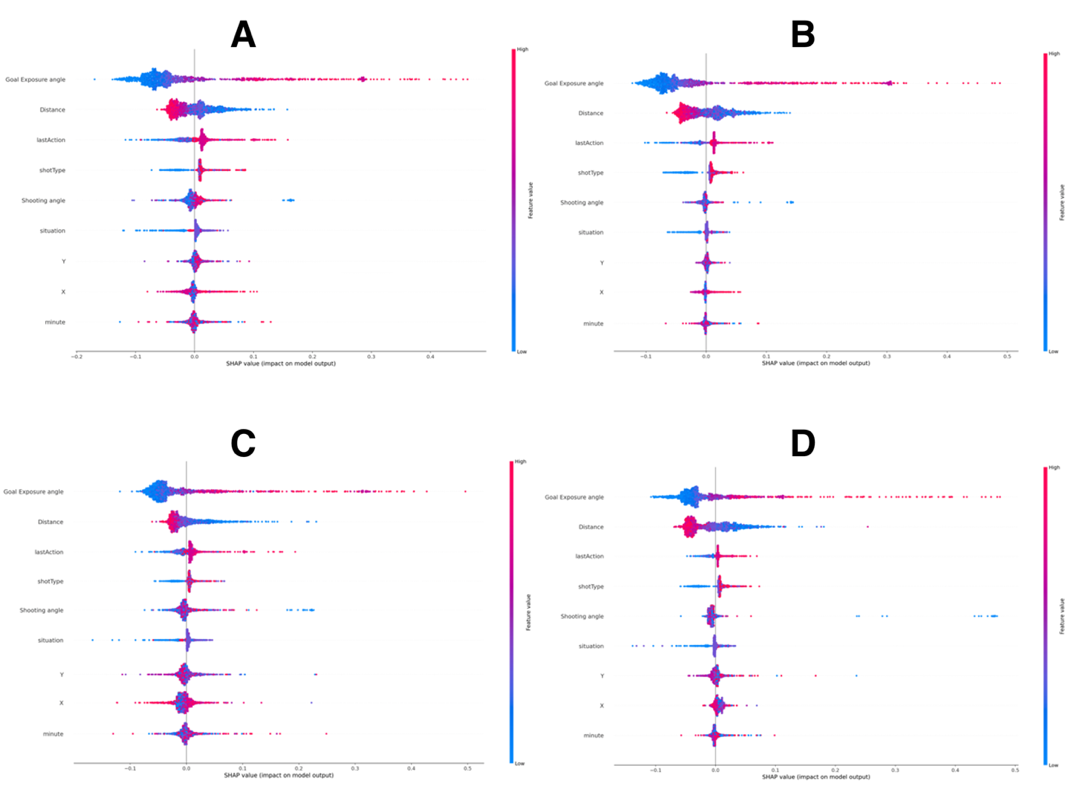
Figure 6. SHAP swarm plot for the XGBoost model predicting Understat xG values (A), for the Random Forest model predicting Understat xG values (B), for the XGBoost model predicting Opta xG values (C), and for the Random Forest model predicting Opta xG values (D). The ten highest-ranking variables are displayed, sorted by their mean absolute SHAP values in descending order, with the most important variables at the top.
6. Discussion
This section reviews the predictive accuracy and feature importance of Opta and Understat xG models across Europe's top leagues, revealing their comparative strengths and limitations.
Both models demonstrate systematic biases, overestimating xG for lower-ranked teams while underestimating for higher-ranked ones. Understat achieves superior predictive accuracy, particularly in the Bundesliga and Premier League, while Opta performs better in La Liga and Ligue 1. However, Opta's more consistent performance across seasons makes it valuable for longitudinal analyses, despite lower overall accuracy than Understat's more variable predictions.
League characteristics significantly influence model performance. Understat excels in dynamic leagues like the Bundesliga, while Opta's stability better suits less intense competitions like Ligue 1. The models differ in their feature weighting: both prioritize spatial variables, but Understat emphasizes categorical features like shot type, suggesting deeper contextual analysis, while Opta's focus on numerical features suits spatial assessment.
Understat provides more accurate predictions overall, while Opta offers greater cross-league consistency. Data limitations and unaccounted variables like defender positioning introduce potential inaccuracies. Future research should evaluate multiple models and incorporate contextual factors, while standardized data collection across providers could enhance xG analytics' reliability.
References
[1]. FBRef. (n.d.). xG explained. Retrieved from https://fbref.com/en/expected-goals-model-explained/
[2]. Hudl StatsBomb. (2024). What are expected goals (xG)?. Retrieved from https://statsbomb.com/soccer-metrics/expected-goals-xg-explained/
[3]. Harkness, C. (2020). What is expected goals (xG) in football and how is it calculated? Total Football Analysis. Retrieved from: https://statsbomb.com/soccer-metrics/expected-goals-xg-explained/.
[4]. Mead, J., O'Hare, A., & McMenemy, P. (2023). Expected goals in football: Improving model performance and demonstrating value. PloS one, 18(4), e0282295. Retrieved from https://doi.org/10.1371/journal.pone.0282295
[5]. Bornn, L., Fernández, J., Cervone, D., & Goldsberry, K. (2018). Soccer analytics: Unraveling the complexity of the beautiful game. INFORMS Journal on Applied Analytics, 48(4), 338-349. Retrieved from https://doi.org/10.1111/j.1740-9713.2018.01146.x
[6]. Roccetti, M., Berveglieri, F., & Cappiello, G. (2024). Football data analysis: The predictive power of expected goals (xG). https://doi.org/10.13140/RG.2.2.34493.27365/14
[7]. Spearman, W. (2018). Beyond expected goals. MIT Sloan Sports Analytics Conference. Retrieved from https://www.researchgate.net/publication/32713984_Beyond_Expected_Goals
[8]. Gieparda, M. (2023). Football Data Analytics — Let’s start. Medium. Retrieved from https://medium.com/@DataThinker/football-data-analytics-lets-start-4ad1a28ee357
[9]. Tiippana, T. (2020). How accurately does the expected goals model reflect goalscoring and success in football? Aaltodoc. Retrieved from https://aaltodoc.aalto.fi/server/api/core/bitstreams/43d75b97-553d-40eb-8aaf-79dadbe54514/content
[10]. Decroos, T., Bransen, L., Van Haaren, J., & Davis, J. (2019). Actions speak louder than goals: Valuing player actions in soccer. Proceedings of the 25th ACM SIGKDD International Conference on Knowledge Discovery & Data Mining, 1851-1861. Retrieved from https://doi.org/10.1145/3292500.3330758
[11]. Beatthebookie2017. (2024). Comparing the predictive power of different xG data providers. Retrieved from https://beatthebookie.blog/2024/01/06/comparing-the-predictive-power-of-different-xg-data-providers/
[12]. Orest. (2021, December 15). xG model comparison—Understat, StatsBomb & Opta. Retrieved from https://tacticsnotantics.org/statistical-models-and-analyses/xg-model-comparison/
Cite this article
Fu,S. (2024). Comparative Analysis of Expected Goals Models: Evaluating Predictive Accuracy and Feature Importance in European Soccer. Applied and Computational Engineering,113,36-45.
Data availability
The datasets used and/or analyzed during the current study will be available from the authors upon reasonable request.
Disclaimer/Publisher's Note
The statements, opinions and data contained in all publications are solely those of the individual author(s) and contributor(s) and not of EWA Publishing and/or the editor(s). EWA Publishing and/or the editor(s) disclaim responsibility for any injury to people or property resulting from any ideas, methods, instructions or products referred to in the content.
About volume
Volume title: Proceedings of the 2nd International Conference on Machine Learning and Automation
© 2024 by the author(s). Licensee EWA Publishing, Oxford, UK. This article is an open access article distributed under the terms and
conditions of the Creative Commons Attribution (CC BY) license. Authors who
publish this series agree to the following terms:
1. Authors retain copyright and grant the series right of first publication with the work simultaneously licensed under a Creative Commons
Attribution License that allows others to share the work with an acknowledgment of the work's authorship and initial publication in this
series.
2. Authors are able to enter into separate, additional contractual arrangements for the non-exclusive distribution of the series's published
version of the work (e.g., post it to an institutional repository or publish it in a book), with an acknowledgment of its initial
publication in this series.
3. Authors are permitted and encouraged to post their work online (e.g., in institutional repositories or on their website) prior to and
during the submission process, as it can lead to productive exchanges, as well as earlier and greater citation of published work (See
Open access policy for details).
References
[1]. FBRef. (n.d.). xG explained. Retrieved from https://fbref.com/en/expected-goals-model-explained/
[2]. Hudl StatsBomb. (2024). What are expected goals (xG)?. Retrieved from https://statsbomb.com/soccer-metrics/expected-goals-xg-explained/
[3]. Harkness, C. (2020). What is expected goals (xG) in football and how is it calculated? Total Football Analysis. Retrieved from: https://statsbomb.com/soccer-metrics/expected-goals-xg-explained/.
[4]. Mead, J., O'Hare, A., & McMenemy, P. (2023). Expected goals in football: Improving model performance and demonstrating value. PloS one, 18(4), e0282295. Retrieved from https://doi.org/10.1371/journal.pone.0282295
[5]. Bornn, L., Fernández, J., Cervone, D., & Goldsberry, K. (2018). Soccer analytics: Unraveling the complexity of the beautiful game. INFORMS Journal on Applied Analytics, 48(4), 338-349. Retrieved from https://doi.org/10.1111/j.1740-9713.2018.01146.x
[6]. Roccetti, M., Berveglieri, F., & Cappiello, G. (2024). Football data analysis: The predictive power of expected goals (xG). https://doi.org/10.13140/RG.2.2.34493.27365/14
[7]. Spearman, W. (2018). Beyond expected goals. MIT Sloan Sports Analytics Conference. Retrieved from https://www.researchgate.net/publication/32713984_Beyond_Expected_Goals
[8]. Gieparda, M. (2023). Football Data Analytics — Let’s start. Medium. Retrieved from https://medium.com/@DataThinker/football-data-analytics-lets-start-4ad1a28ee357
[9]. Tiippana, T. (2020). How accurately does the expected goals model reflect goalscoring and success in football? Aaltodoc. Retrieved from https://aaltodoc.aalto.fi/server/api/core/bitstreams/43d75b97-553d-40eb-8aaf-79dadbe54514/content
[10]. Decroos, T., Bransen, L., Van Haaren, J., & Davis, J. (2019). Actions speak louder than goals: Valuing player actions in soccer. Proceedings of the 25th ACM SIGKDD International Conference on Knowledge Discovery & Data Mining, 1851-1861. Retrieved from https://doi.org/10.1145/3292500.3330758
[11]. Beatthebookie2017. (2024). Comparing the predictive power of different xG data providers. Retrieved from https://beatthebookie.blog/2024/01/06/comparing-the-predictive-power-of-different-xg-data-providers/
[12]. Orest. (2021, December 15). xG model comparison—Understat, StatsBomb & Opta. Retrieved from https://tacticsnotantics.org/statistical-models-and-analyses/xg-model-comparison/