


1. Introduction
Flight management system (FMS) is the core of large aircraft avionics system, which can help pilots realize the whole process of automatic flight from takeoff to landing, enhance the ability of aircraft to perform tasks and reduce the burden of pilots driving. As the “brain” of the aircraft, it is responsible for handling complex flight tasks, navigation calculations and route planning, and its performance is directly related to the safety, reliability and economy of the aircraft. The performance is directly related to the safety, reliability and economy of the aircraft. The on-board flight management integrated navigation display software has become an indispensable part of realizing the efficient, intelligent and safe flight of the aircraft.
In the field of airborne view technology, the conceptual prototype of synthetic view was proposed in the 1980s [1]. At that time, the name of the synthetic view system was not fully recognized, but the technologies such as terrain display screen and hazardous terrain warning had been widely studied. It was not until 1994 that the concepts of Enhanced View System (EVS) and Synthetic View System (SVS) were introduced at the International Conference on Synthetic Vision Systems for Civil Aviation organized by the Royal Aeronautical Society [2]. EVS usually refers to the presentation of sensor-based imagery systems and SVS usually refers to a computer-generated spatially integrated environment description, which is generally used for aircraft navigation.
Currently, foreign synthetic view solutions are mainly provided by Collins and Honeywell [3]. Honeywell's synthetic view system integrates certified Jeppesen aerial chart data, which is mainly displayed on downward looking displays, while Collins' main products are flat-screen displays, whose enhanced view and synthetic view images are both displayed on flat-screen displays. After nearly two decades of development, some mature technologies have moved from the laboratory to products.Comparatively speaking, the domestic research on airborne vision system started late and the technology is relatively backward. 2010, Tsinghua University, Beijing University of Aeronautics and Astronautics, and AVIC Sixty-Eight Research Institute cooperated in the research project “Basic Theoretical Research on Approach Visual Navigation of Aircraft under Complex Conditions” [4] is committed to breaking through the foreign technology blockade and solving the problem of safe approach and landing of aircraft under complex conditions, which lays the foundation of the research on airborne vision for China. In 2018, Northwestern Polytechnical University (NWPI) utilized short-wave infrared image sensors to improve the enhanced synthetic view system [5], while combining digital image processing technology to perform image enhancement as well as target detection on the captured images to further improve the reliability of the system.In 2016, a team from Beijing University of Aeronautics and Astronautics established the “Target-Background-Target-Background” model based on the theoretical model of infrared radiation based on the “Target-Background-Target-Background” model of the BUAA. established the model of “target-background-atmosphere-imaging system” [6], studied the real-time simulation of modern helicopter airborne forward-looking infrared sensors, and realized dynamic and efficient large-scale infrared scene simulation through computer graphics hardware according to different simulation parameters. In general, the research on synthetic vision system in China has achieved some remarkable results, but the gap with other countries is still large.
Based on the above status quo, this paper designs and realizes the integrated navigation display software of airborne flight management system, which plays an important role in testing and verifying the functions of FMS, intuitively analyzing the scene and situational awareness. This paper mainly elaborates on the large-scale real-time 3D terrain reconstruction technology as well as the information superposition and multi-view switching technology in the software.
2. Overall Architecture Design
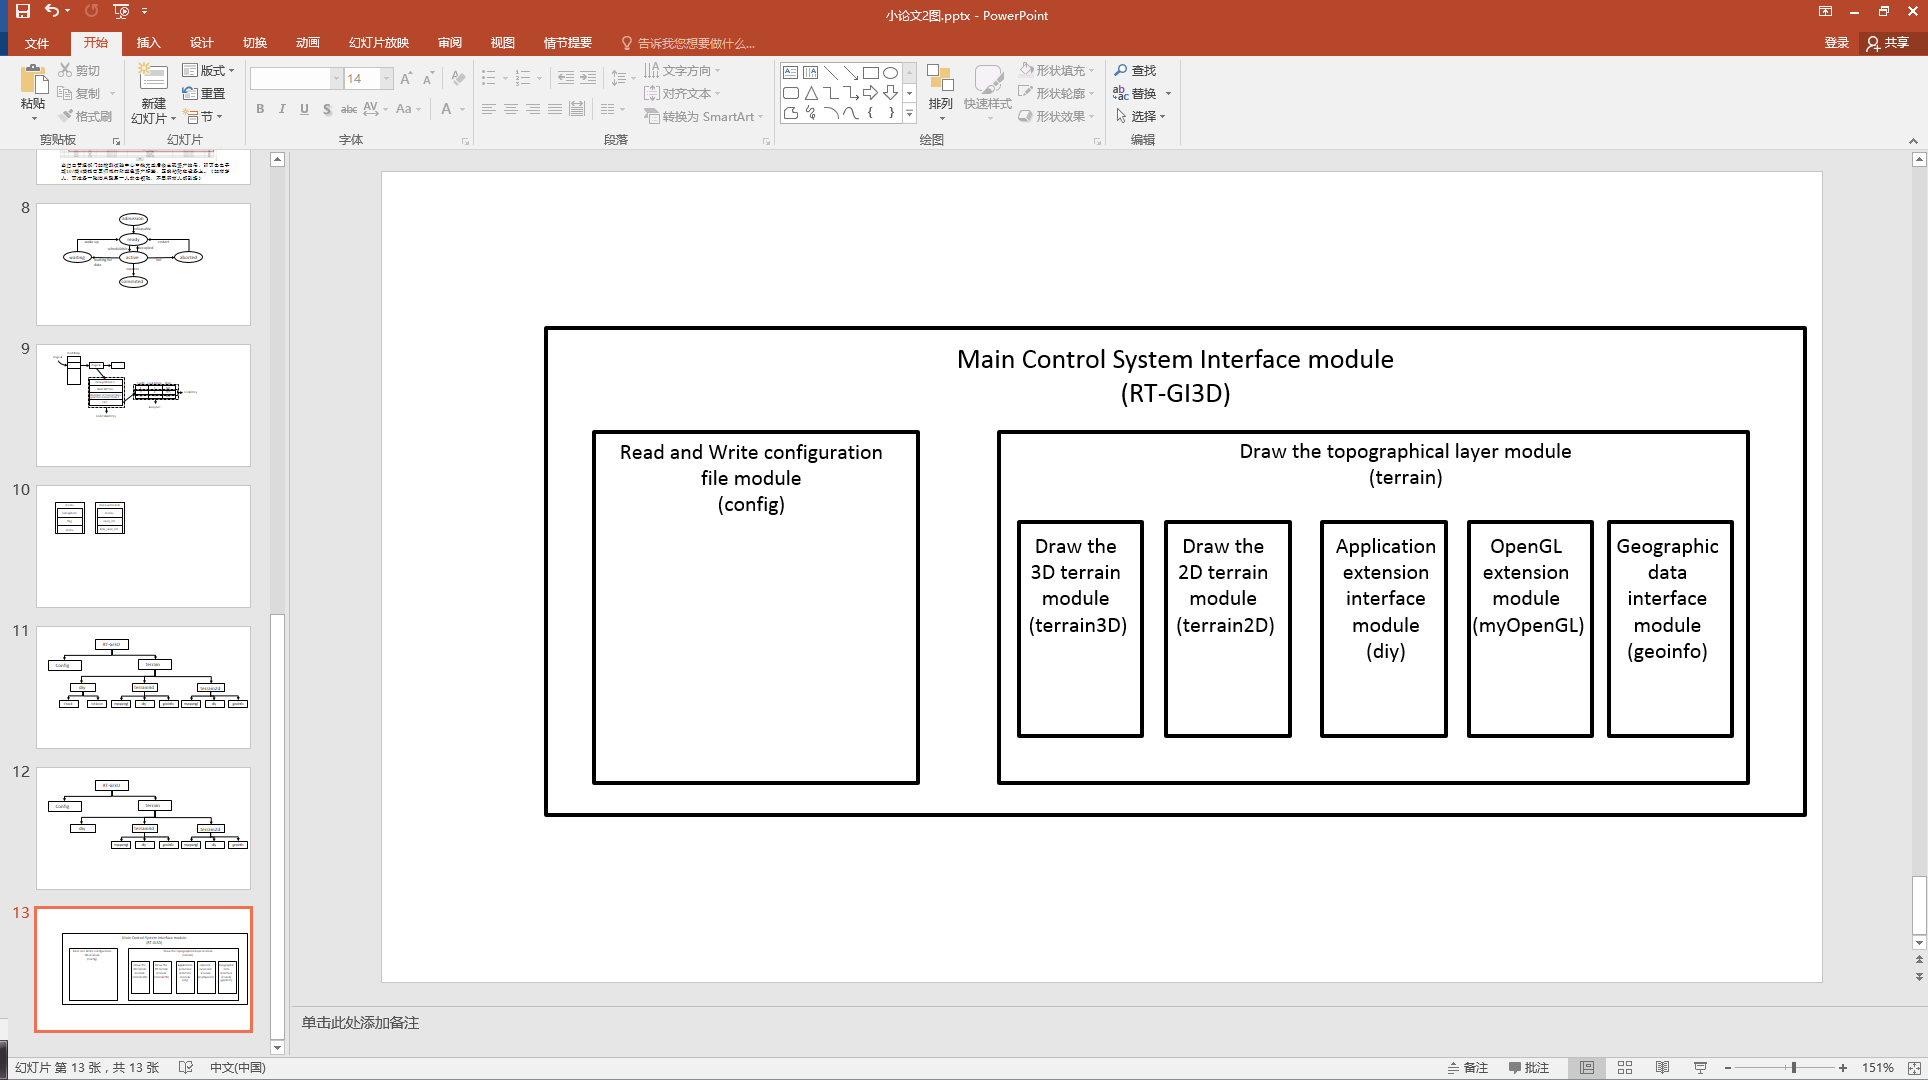
Comprehensive navigation terrain display software is divided according to modules as shown in Figure 1. The main control and system interface RT-GI3D mainly contains read/write configuration information module “config” and draw terrain top layer module “terrain”. Separate draw 2D terrain module “terrain2d” and draw 3D terrain module “terrain3d” as the next layer of draw terrain top layer module “terrain”. The data file buffer layer preload module “geoinfo” is used to avoid reading the same file repeatedly. Module “diy” summarizes the reserved callback functions.Module “myOpenGL” provides support for basic drawing of icons, Chinese and Western text, line segments and squares.
| |
Figure 1. Comprehensive navigation terrain display software module division diagram. | |
3. Key Technology Realization
3.1. Data storage
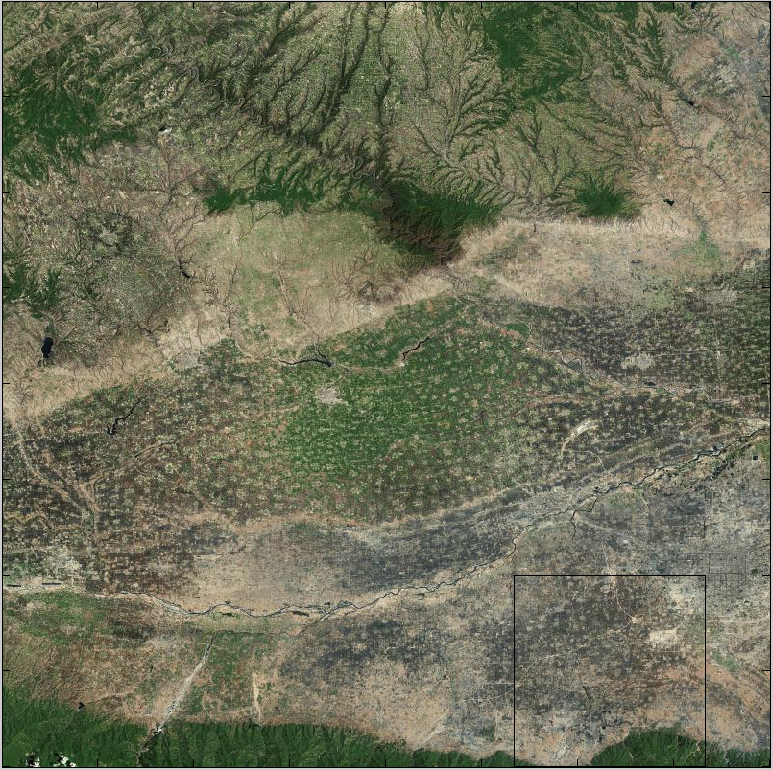
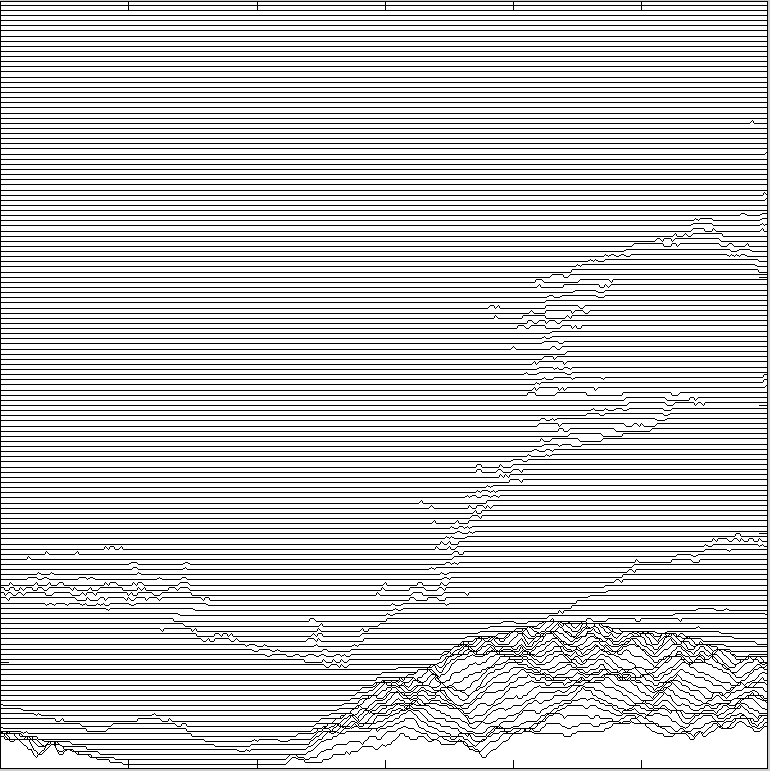
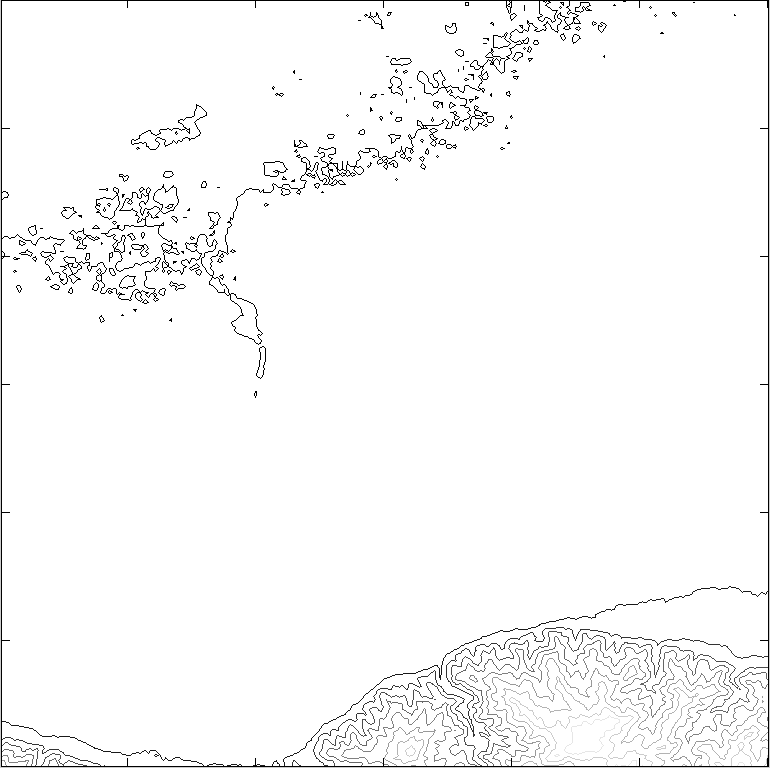
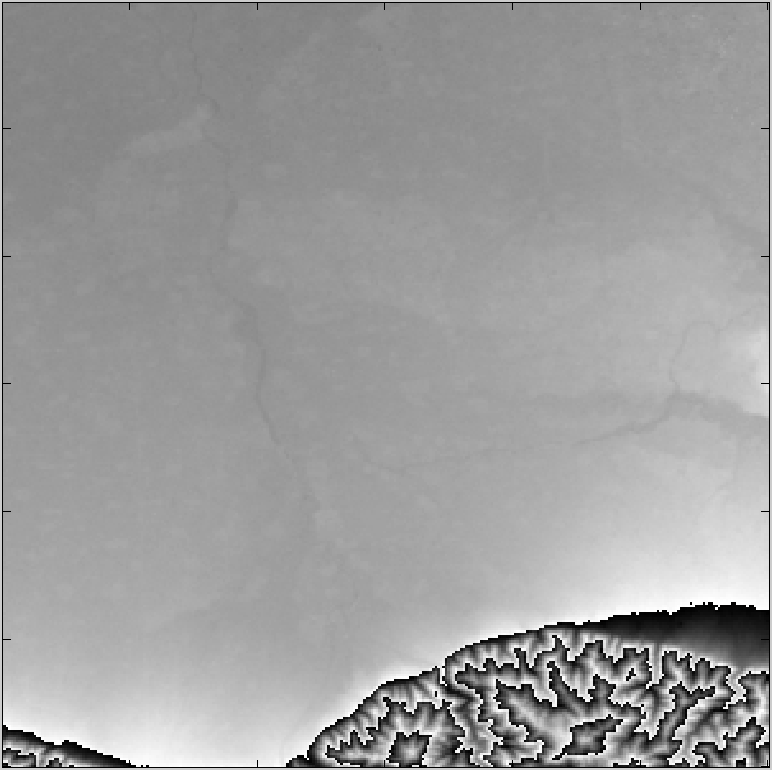
The airborne synthetic view system software takes the synthetic view as the main display element and overlays other navigation information on top of it. Synthetic View leverages a library of computerized 3D graphics functions to generate scenes similar to those seen in the real world using terrain and geomorphology data, as shown in Figure 2. Geomorphology data is usually a geometrically corrected satellite photo, as shown in Figure 3, and the black box area in the figure corresponds to the display area in Figure 2. Except for special terrain in local areas, such as caves and cliffs, the terrain in most areas can be viewed as a single-valued function of geographic location, as shown in Figure 4, where larger gray values represent higher ground heights. Due to the insensitivity of vision to changes in brightness in dark places, changes in terrain at low places in the figure are not visible. We can switch to use the contour lines shown in Figure 5, but the contour lines are not intuitive enough. In order to represent the terrain data more intuitively, we can first extract the large terrain change trend, as shown in Figure 6. Then the information from Figure 4 and Figure 6 is combined to present a more intuitive terrain detail as shown in Figure 7.
|
|
Figure 2. geomorphology. | Figure 3. Topographic Elevation. |
|
|
Figure 4. Topography. | Figure 5. Topographic contours. |
|
|
Figure 6. Topographic trends. | Figure 7. Topographic details. |


Therefore, the first problem to be solved for terrain display is how to store the required terrain and geomorphology data. This paper uses the publicly available U.S. Shuttle Radar Topography Mission (SRTM) for storing topographic data. This data provides topography at 3 arc-second resolution for areas of the world outside of North America, divided into 1200 equal parts per degree of latitude and longitude, with one file per degree of latitude and longitude, each file being slightly less than 2.8 MB, named after an integer portion of the degree of latitude and longitude, and with the data in the file organized in a north-to-south, west-to-east order. Geometrically corrected satellite photographs of geomorphic data are spliced and cropped into small blocks covering an area of 0.01° x 0.01° latitude and longitude, divided into 3 levels of resolution, low, medium and high, again with one folder per latitude and longitude, and named in integer parts of latitude and longitude.
The global terrain and geomorphology data is about 30 TB in size, so dynamically loading the required data into the memory according to the location of the vehicle can reduce the number of times of updating the data and the amount of data loaded each time, which is more efficient. The frame rate of the screen is an important indicator of the display performance. Appropriately reducing the display scene and lowering the texture resolution can effectively improve the frame rate.
3.2. Large-scale factual 3D terrain reconstruction
Large-scale 3D terrain visualization is one of the important basic technologies of synthetic vision system, and airborne FMS is able to construct a high-precision and large-scope flight environment model in real time through large-scale real-time 3D terrain reconstruction technology to provide realistic flight scene simulation.
Digital terrain model (DTM) is the main component of 3D geospatial database [6],and reconstructing 3D terrain surface model and realizing its lifelike restoration have a great demand for industry applications and a broad application prospect.
There are seven main processes for drawing 3D terrain: initialization, preparation process, model building, drawing process, observer moving to the specified position, model coordinates moving to the specified position, and end.
The initialization process is used to clear the internal data and establish the fixed-point index and texture coordinates. The preparation process assigns a texture object to each cell. The model building process chooses not to update, partially update, or completely update the model based on the amount of cheapness between the vehicle position and the position relative to the center of the current range. The drawing process makes a call to draw the 3D terrain for each cell, and the observer moving to the specified position process moves the observer to the specified position based on the entered The observer move to specified position process translates the observer coordinate system to the specified position based on the input vehicle position and the specified position. The model coordinate move to specified position process translates the model coordinate system to the specified position based on the specified position longitude, latitude, and elevation, and the end process releases the assigned texture objects.
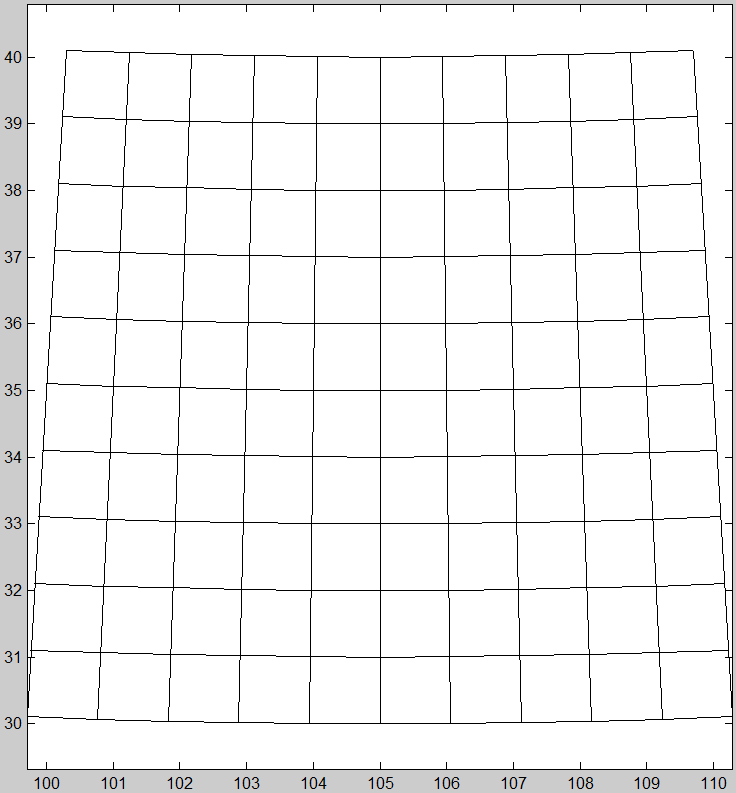
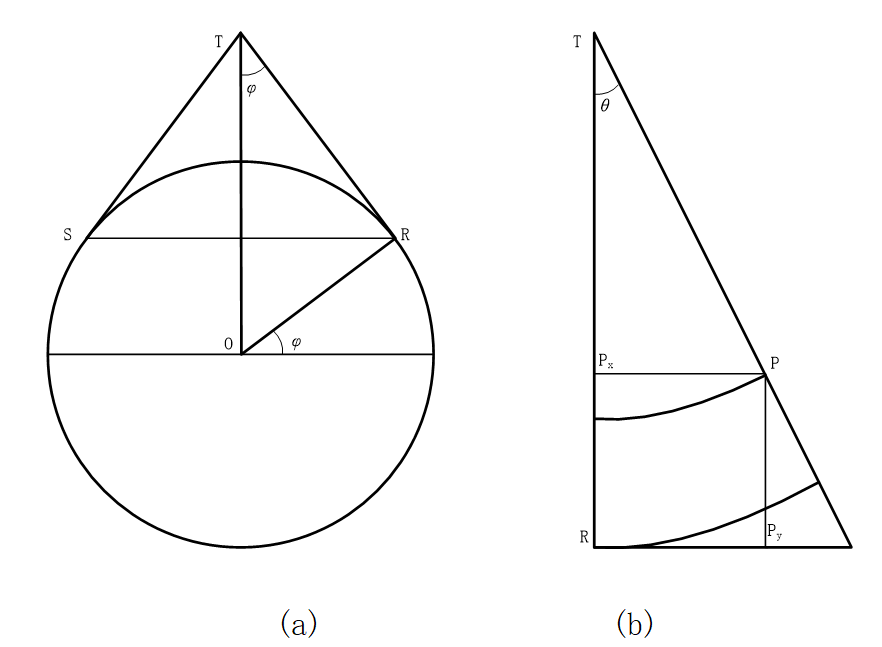
When drawing three-dimensional terrain, use the extraction of the specified location of the ground elevation function to specify the location of the latitude and longitude, extract the percent latitude and percent longitude integer, call the extraction cell terrain data function to get the relevant data, extract the elevation of which with the specified location adjacent to the four points, the designated position by the bilinear interpolation to get the specified location of the elevation. The conic projection is used to project the local rectangular area of the earth's surface to the fan-shaped area on the plane. The latitude/longitude grid for the region of 30°~ 40°N latitude and 100°~ 110°E longitude is shown in Figure 8. The latitude of the reference point R in the left panel of Figure 9 is φ, and the cone TRS is tangent to the iso-latitude line that passes through the reference point R. The cone TRS can be expanded into a rectangular region on the plane. The cone can be expanded into a sector in the plane, as shown in the right panel of Figure 9.
|
|
Figure 8. Conic projection effect. | Figure 9. Conic projection. |
3.3. Information Overlay and Multi-view Switching
The information overlay can support the simultaneous display of various key information in the navigation display software, such as vehicle attitude, altitude, heading and other information. Through the information overlay can visualize the data generated by the flight management system test process, such as flight trajectory, target position and so on. This intuition helps testers to quickly understand the test situation, identify problems and make adjustments in time. Multi-view switching means that the pilot can make a choice of viewpoints for the visual display, which are the first viewpoint, the third viewpoint and the helmet viewpoint. In the design of airborne synthetic view software, multi-view switching is one of its important functional components, the pilot can choose the view of the view display, respectively, the first view, the third view and helmet view.
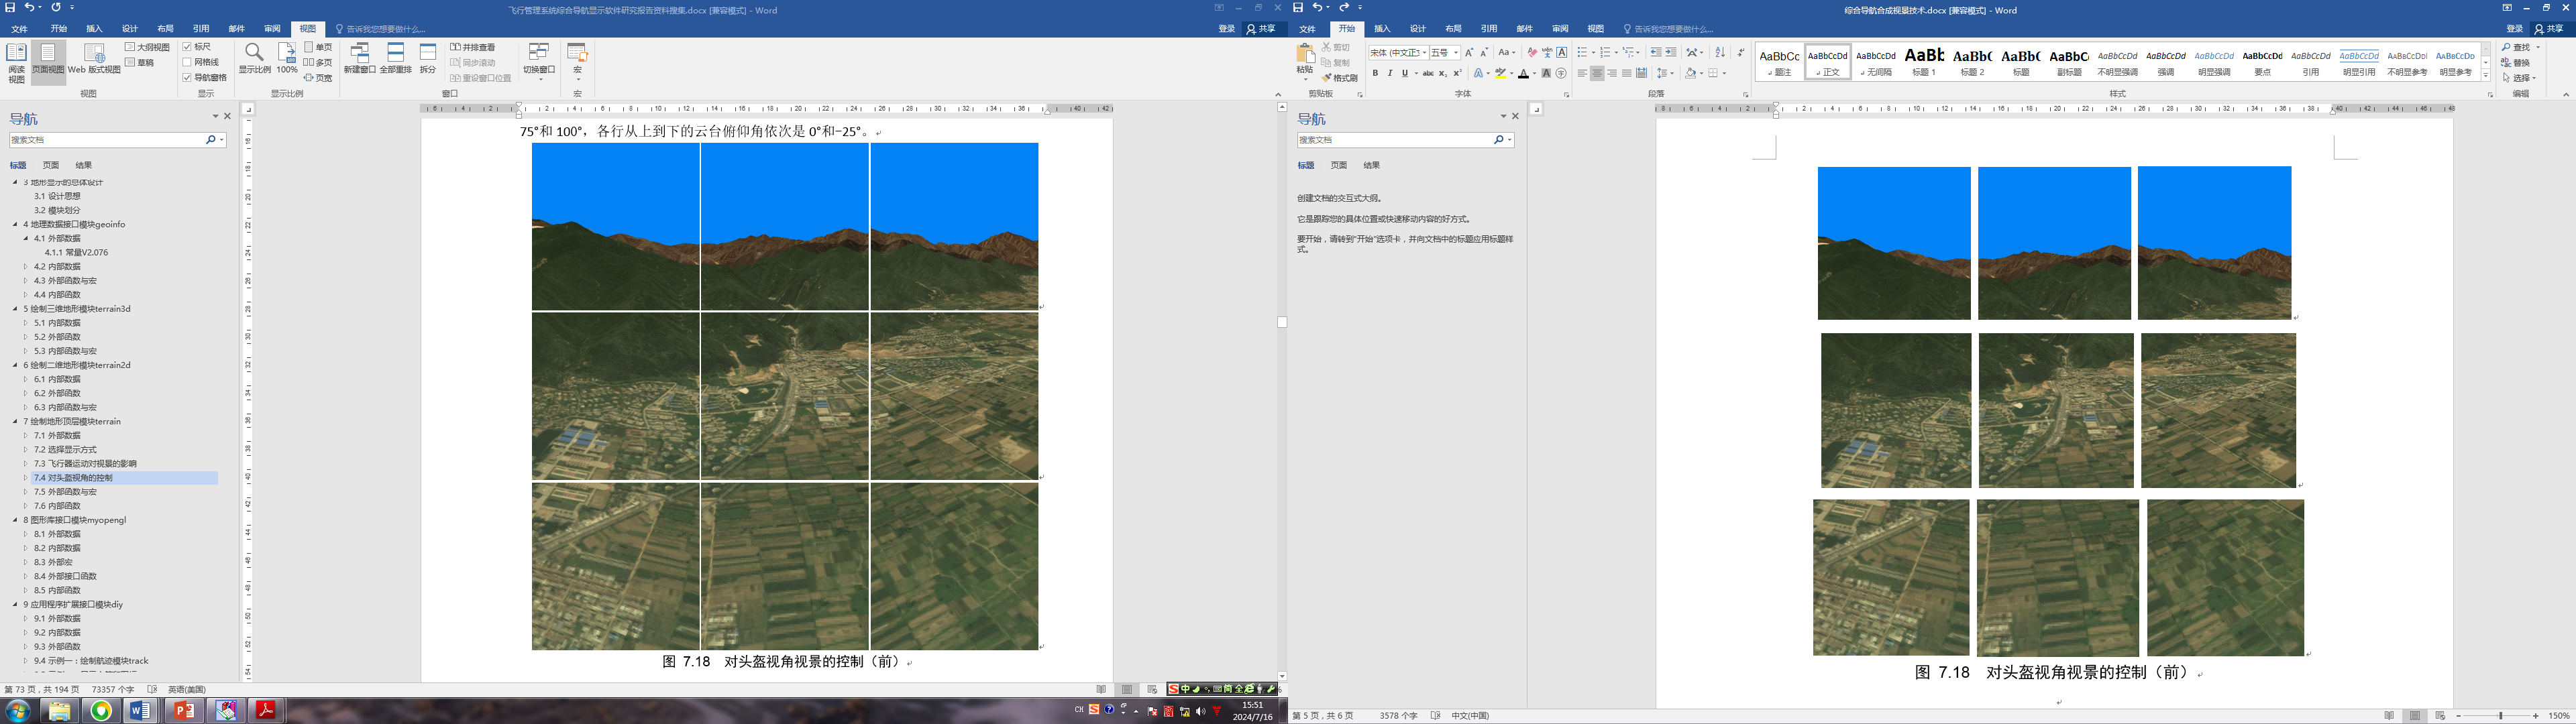
The first view is the forward view from the pilot's position, which is affected by the latitude, longitude, altitude, heading angle, pitch angle and roll angle of the vehicle position. The third view is divided into top view and top view, the top view observes the vehicle from the position directly above the vehicle downward, which can display a larger scene in a two-dimensional way. The top view observes the vehicle from the distance of 10km above the rear of the vehicle downward by 30°.The third view is affected by the latitude and longitude of the vehicle, altitude and heading angle, and is not affected by the pitch angle and the roll angle. The helmet view direction is determined by the helmet gimbal azimuth and pitch angle, and at the same time is affected by the vehicle location latitude, longitude, altitude, heading angle, pitch angle and roll angle. Looking forward through the helmet display, the gimbal azimuths of the columns in the figure are -25°, 0° and 25° from left to right, and the gimbal pitch angles of the rows are 0°, -25° and -50° from top to bottom. The focal length of the three viewpoints can be adjusted, the shorter the focal length, the larger the field of view, the smaller the scene, the longer the focal length, the smaller the field of view, the larger the scene.
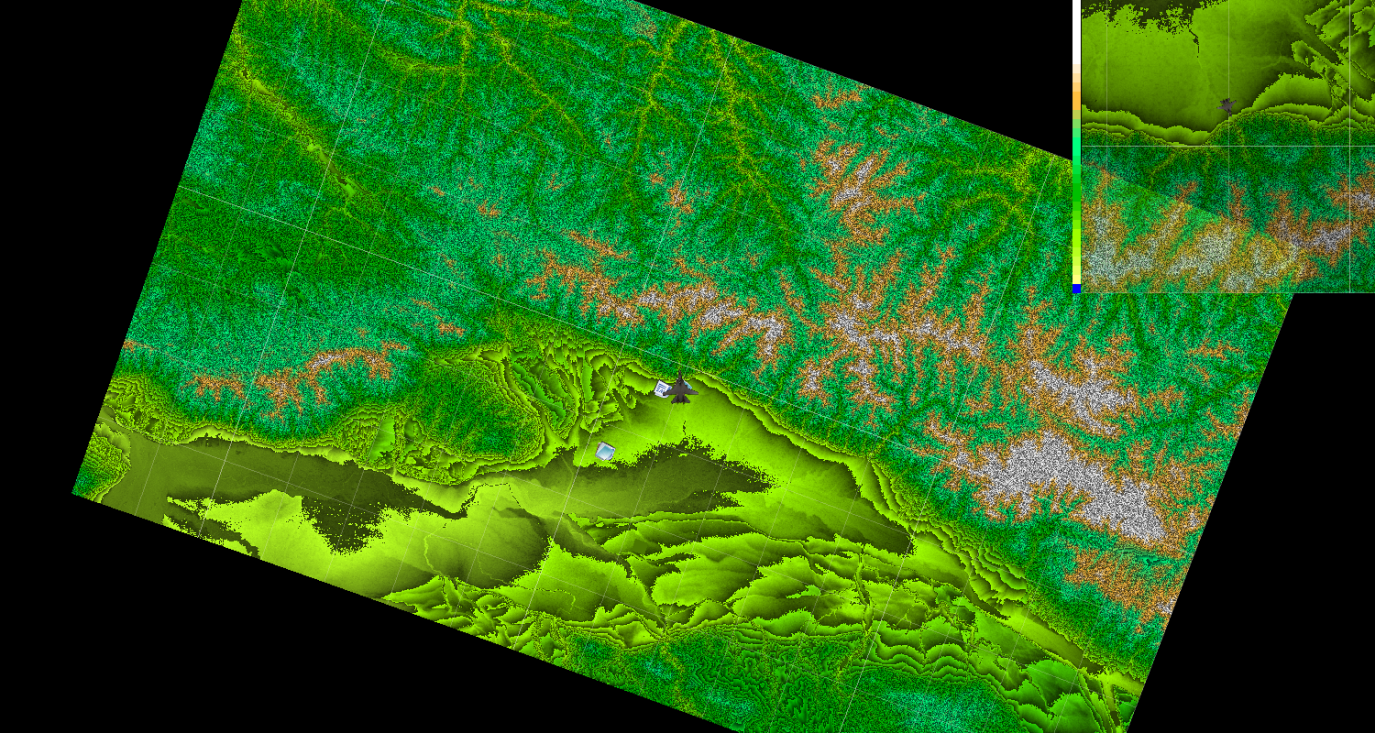
The first or third view can be overlaid with an overview image. The overview map is a square screen, displaying the same content as the top view of the third view, but the top of the screen always points to the geographic north pole, and you can choose to zoom in locally or display the whole picture.
4. Visualization effect display
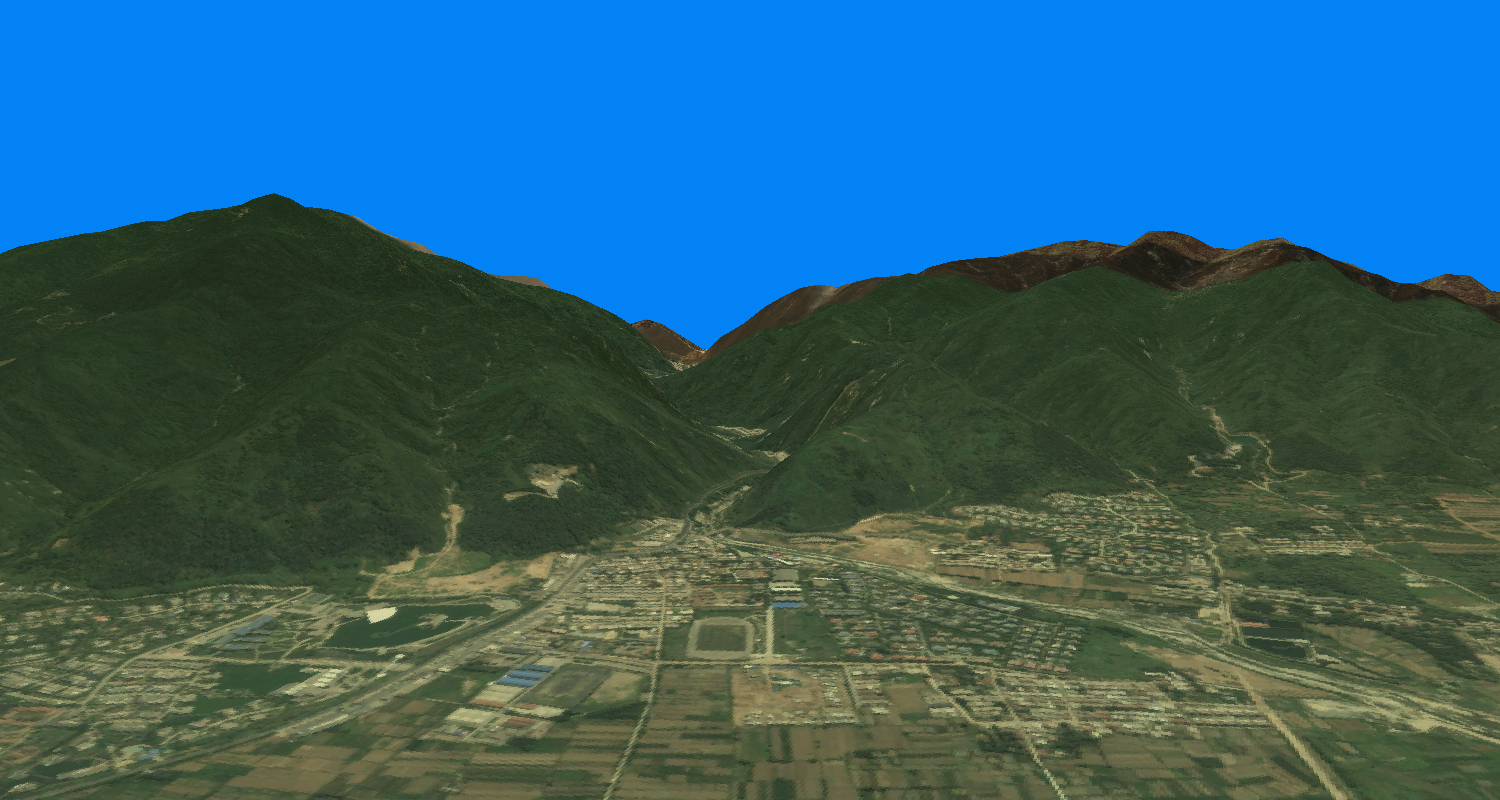
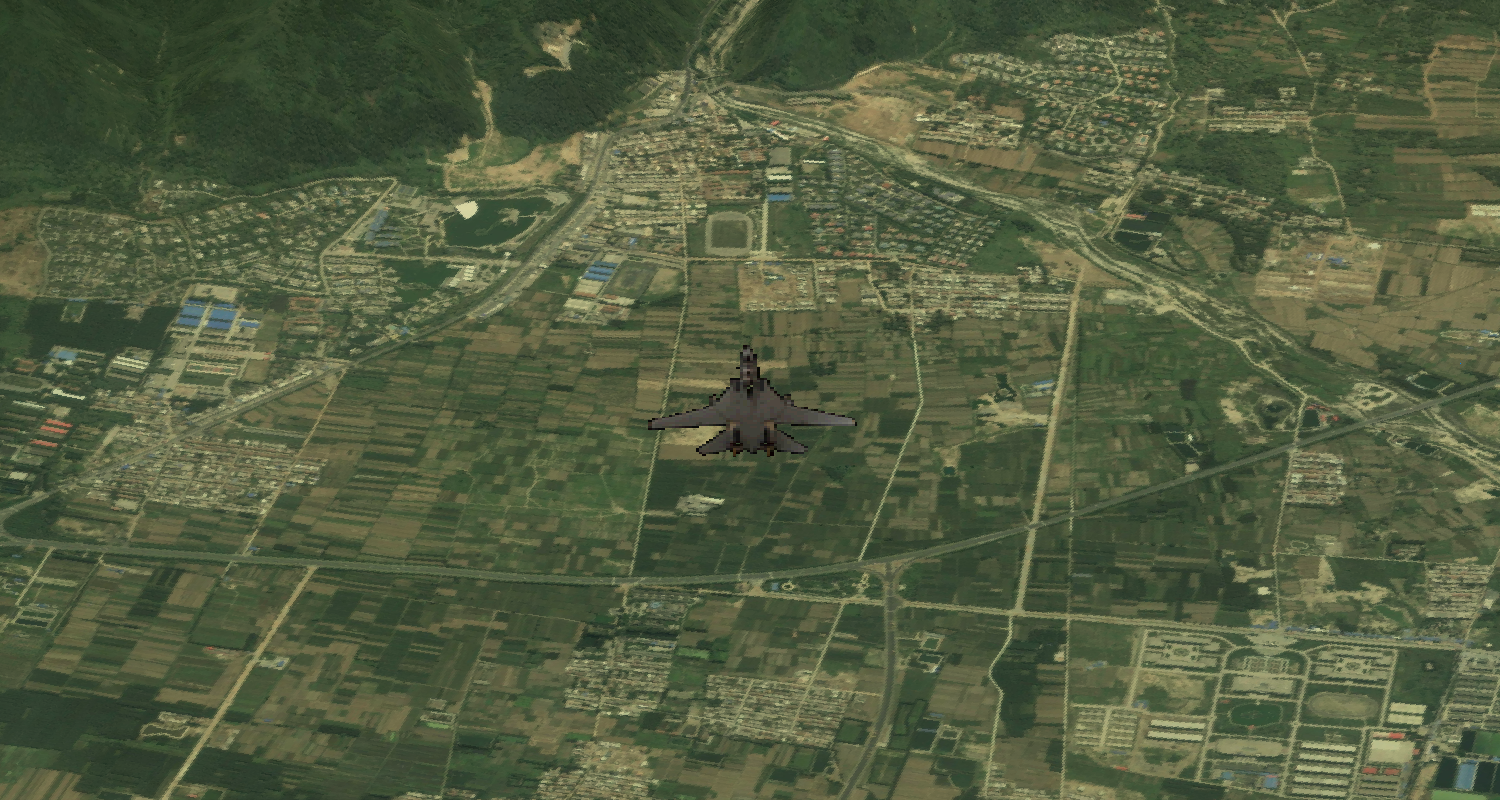
Figure 10 shows the scene: the vehicle position latitude n34.052°, longitude e108.800° and altitude 1000m, the vehicle heading angle 160°, pitch angle 3° and roll angle 0° of the first view. Figure 11 shows the scene of looking down from the third view. Figure 12 shows the scene of helmet view to the front. Figure 13 shows the third-view top view scene superimposed on the local zoomed-in overview map with elevation pseudo-colored lines.
|
Figure 10. First viewpoint view. |
|
Figure 11. Third viewpoint overhead viewpoint. |
|
Figure 12. Control of helmet view angle view (front). |
|
Figure 13. Top view third view with color bar superimposed on a partially enlarged overview image. |
5. Summary
Synthetic view is an avionics solution that integrates various advanced technologies and has become an important carrier for obstacle avoidance and near-earth guidance solutions. This paper analyzes the overall architecture of the terrain display of the integrated navigation display software of the flight management system, and focuses on the large-scale real-time 3D terrain reconstruction technology and the information superposition and multi-view switching technology involved. Firstly, according to the change of aircraft position, altitude, heading angle and attitude, etc., it realizes the drawing and switching of two-dimensional and three-dimensional scenes from different viewpoints, and displays different screens corresponding to the corresponding adaptations. Sencondly, a large-scale 3D terrain reconstruction technology function that satisfies real-time is realized, and the real-time reconstructed 3D terrain maps are used to provide pilots with realistic environment simulations.
The information in the integrated navigation display software is highly similar to the real flight environment, and the testers are able to feel close to the real flight status in the ground test, which helps to improve the simulation degree of the test. The view effect reflects the main characteristics of the real terrain, and can meet the system requirements in terms of terrain drawing effect and real-time. In order to further improve the system, the details of the terrain display will be enhanced and the display effect will be optimized under the premise of ensuring the real-time performance, so as to continuously improve the performance of the system.
References
[1]. Kruk R, Link N and Reid L. Enhanced/synthetic vision systems for search and rescueoperations. SAE transactions, 1999: 1494-1498.
[2]. Chang FY. Three-dimensional terrain reconstruction based on UAV aerial images. Tianjin University, 2014.
[3]. J. Shi. Development and application of synthetic view system. International Aviation,2009(4):51-52.
[4]. Qi Tiantian. Synthetic view and its embedded display processing technology. Xi'an University of Electronic Science and Technology, 2014.
[5]. Cheng Y, Niu W, Liu Z, et al. A prototype of Enhanced Synthetic Vision System using short-wave infrared. 2018 IEEE/AIAA 37th Digital Avionics Systems Conference (DASC). IEEE, 2018:1-7.
[6]. Dai Jiajing. Research on the theory and algorithm of three-dimensional reconstruction based on multiple images. Shanghai Jiao Tong University,2012.
Cite this article
Chang,X.;Ma,W. (2024). Research on Key Technology of Synthetic Vision in Airborne Integrated Navigation Display Software. Applied and Computational Engineering,113,128-134.
Data availability
The datasets used and/or analyzed during the current study will be available from the authors upon reasonable request.
Disclaimer/Publisher's Note
The statements, opinions and data contained in all publications are solely those of the individual author(s) and contributor(s) and not of EWA Publishing and/or the editor(s). EWA Publishing and/or the editor(s) disclaim responsibility for any injury to people or property resulting from any ideas, methods, instructions or products referred to in the content.
About volume
Volume title: Proceedings of the 2nd International Conference on Machine Learning and Automation
© 2024 by the author(s). Licensee EWA Publishing, Oxford, UK. This article is an open access article distributed under the terms and
conditions of the Creative Commons Attribution (CC BY) license. Authors who
publish this series agree to the following terms:
1. Authors retain copyright and grant the series right of first publication with the work simultaneously licensed under a Creative Commons
Attribution License that allows others to share the work with an acknowledgment of the work's authorship and initial publication in this
series.
2. Authors are able to enter into separate, additional contractual arrangements for the non-exclusive distribution of the series's published
version of the work (e.g., post it to an institutional repository or publish it in a book), with an acknowledgment of its initial
publication in this series.
3. Authors are permitted and encouraged to post their work online (e.g., in institutional repositories or on their website) prior to and
during the submission process, as it can lead to productive exchanges, as well as earlier and greater citation of published work (See
Open access policy for details).
References
[1]. Kruk R, Link N and Reid L. Enhanced/synthetic vision systems for search and rescueoperations. SAE transactions, 1999: 1494-1498.
[2]. Chang FY. Three-dimensional terrain reconstruction based on UAV aerial images. Tianjin University, 2014.
[3]. J. Shi. Development and application of synthetic view system. International Aviation,2009(4):51-52.
[4]. Qi Tiantian. Synthetic view and its embedded display processing technology. Xi'an University of Electronic Science and Technology, 2014.
[5]. Cheng Y, Niu W, Liu Z, et al. A prototype of Enhanced Synthetic Vision System using short-wave infrared. 2018 IEEE/AIAA 37th Digital Avionics Systems Conference (DASC). IEEE, 2018:1-7.
[6]. Dai Jiajing. Research on the theory and algorithm of three-dimensional reconstruction based on multiple images. Shanghai Jiao Tong University,2012.