


1. Introduction
The ongoing shortage of oil resources, coupled with the environmental pollution associated with the automotive industry, poses significant challenges for sustainable development. As global awareness of these issues grows, hybrid and electric vehicles emerge as a viable solution, offering unmatched advantages in energy efficiency and environmental protection[1].Therefore, research in this field is vital, as it provides insights into optimizing vehicle performance and energy consumption. The utilization of advanced tools such as AVL-CRUISE offers effective modeling of dynamic performance, allowing for accurate simulation of urban driving cycles and other operating conditions[2].In this paper, I focus on key performance indicators related to vehicle dynamics, including maximum speed, acceleration time, and maximum climbing ability. The simulation results demonstrate satisfactory performance, with a maximum speed of approximately 164 km/h, a 0 to 100 km acceleration time of 9 seconds, and a maximum climbing capacity of 74%.By utilizing both AVL-CRUISE and MATLAB, I illustrate and develop a mathematical equation to describe the relationships between these parameters and the overall performance of hybrid and electric vehicles. The study incorporates comprehensive data analysis and model-fitting techniques, offering a deeper understanding of the factors that influence electric vehicle performance.Through this research, I aim to provide valuable insights that can help optimize the design and development of more efficient and environmentally friendly hybrid and electric vehicles.
2. Dynamic simulation
2.1. Vehicle Motion Equation
The performance of an electric vehicle mainly depends on the external forces acting in the direction of its movement, specifically the driving force and the driving resistance[3].
The driving force of an electric vehicle is obtained by transmitting the torque output from the motor to the drive wheels through the transmission system. The relationship between the driving force of the electric vehicle and the motor output torque is as follows.
\( {F_{t}}=\frac{{T_{e}}{i_{t}}{η_{t}}}{r} \)
where \( {F_{t}} \) is the driving force of the electric vehicle, \( {T_{e}} \) is the motor output torque, \( {i_{t}} \) is the overall transmission ratio of the transmission system, \( {η_{t}} \) is the efficiency of the transmission system, and \( r \) is the rolling radius of the tires.
The relationship between motor output torque and speed is the primary basis for calculating vehicle performance. Electric motors have the characteristic of constant torque at low speeds and constant power at high speeds, so the motor torque can be calculated based on motor speed. The calculation formula is:
\( {T_{e}}=\begin{cases} \begin{array}{c} {T_{c}} n≤{n_{b}} \\ \frac{9550{P_{e}}}{n} n \gt {n_{b}} \end{array} \end{cases} \)
where \( {T_{c}} \) represents the motor's constant torque at low speed; \( {P_{e}} \) represents the motor's constant power at high speed; n is the motor speed, and \( {n_{b}} \) is the base speed of the motor.
The relationship between the vehicle speed and the motor speed for an electric vehicle is given by:
\( u=\frac{0.377rn}{{i_{t}}} \)
where \( u \) is the speed of the electric vehicle.
During the operation of an electric vehicle, the main resistive forces include rolling resistance, air resistance, gradient resistance, and acceleration resistance.
The rolling resistance of an electric vehicle refers to the energy loss per unit distance traveled by the tires, primarily caused by the deformation between the tires and the road surface. Its expression is given by:
\( {F_{f}}=mgfcosα \)
\( {F_{f}} \) represents the rolling resistance of the electric vehicle, m is the mass of the electric vehicle, f is the rolling resistance coefficient, and \( α \) is the slope angle.
The air resistance of an electric vehicle refers to the component of the force exerted by the air in the direction of travel when the vehicle is moving in a straight line. This force depends not only on the driving speed but also on the front area of the vehicle and the air resistance coefficient. Its formula is given by:
\( {F_{w}}=\frac{{C_{D}}A{u^{2}}}{22.15} \)
where \( {F_{w}} \) represents the air resistance of the electric vehicle, \( {C_{D}} \) is the air resistance coefficient, and A is the front area.
When an electric vehicle is climbing, the component of gravitational force along the slope is known as the gradient resistance of the electric vehicle. Its expression is given by:
\( {F_{i}}=mgsinα \)
where \( {F_{i}} \) represents the grade resistance of the electric vehicle.
The acceleration resistance of an electric vehicle refers to the inertial force that must be overcome due to the vehicle’s mass when it accelerates. The expression is as follows:
\( {F_{j}}=δm\frac{du}{dt} \)
where \( {F_{j}} \) represents the acceleration resistance of the electric vehicle, \( δ \) represents the rotational mass conversion factor, \( \frac{du}{dt} \) represents the acceleration of the electric vehicle.
Therefore, the overall driving equation for an electric vehicle is:
\( \frac{{T_{e}}{i_{t}}{η_{t}}}{r}= mgfcosα+\frac{{C_{D}}A{u^{2}}}{22.15}+mgsinα+δm\frac{du}{dt} \)
2.2. Select Hybrid and Electric Vehicle Parameters
The parameters of the Hybrid and Electric Vehicle which is selected in this article and the model of it that is built by AVL-Cruise are given below[4][5]:
Table 1: Driving Parameters and Motor Battery
Driving Parameters | |
Projects | Value |
Curb Weight kg | 1060 |
Gross Weight kg | 1400 |
Friction Coefficient of Tire η | 0.012 |
Air Resistance Coefficient μ | 0.292 |
Front Area (m^2) | 1.8 |
Wheel Base (mm) | 2500.0 |
Reference Wheel Load (N) | 3260.0 |
Static Rolling Radius (mm) | 285.0 |
Static Rolling Radius (mm) | 296.0 |
Motor Battery | |
Maximum Charge | 10.0 Ah |
Initial Charge | 95.0% |
Nominal Voltage(V) | 300.0 |
Maximum Voltage(V) | 400.0 |
Minimum Voltage(V) | 200.0 |
Running Temperature | 25.0℃ |
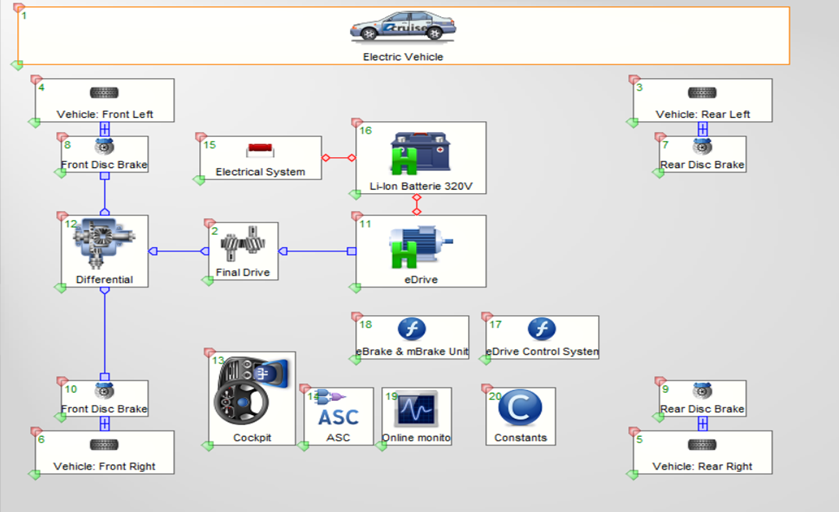
Figure 1: Urban Cycle Simulation of Distance, Velocity and Acceleration of Vehicle.
2.3. Simulation results and analysis
To enhance the understanding of vehicle performance, I conduct simulations of acceleration performance, maximum speed acceleration and incline under appropriate environment and vehicle conditions[6].
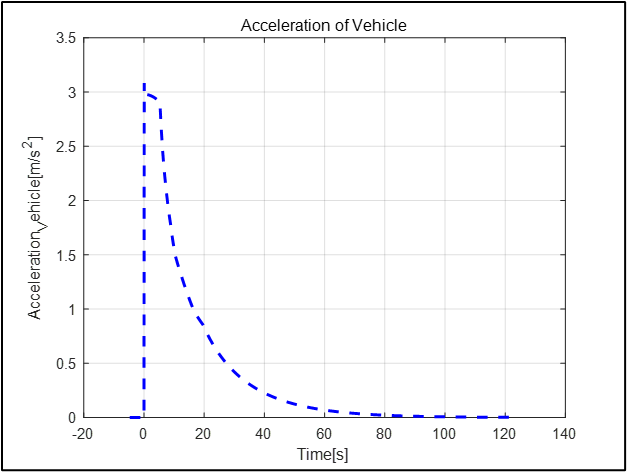
Figure 2: Simulation of Acceleration Performance.
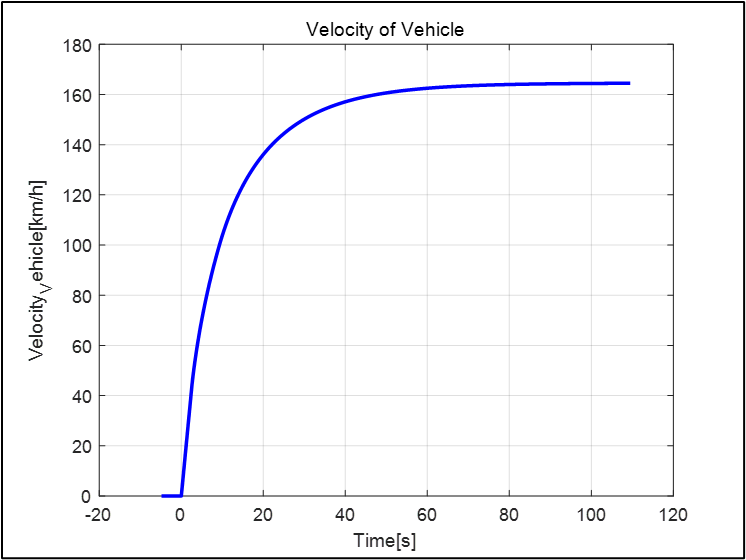
Figure 3: Maximum Speed Acceleration.
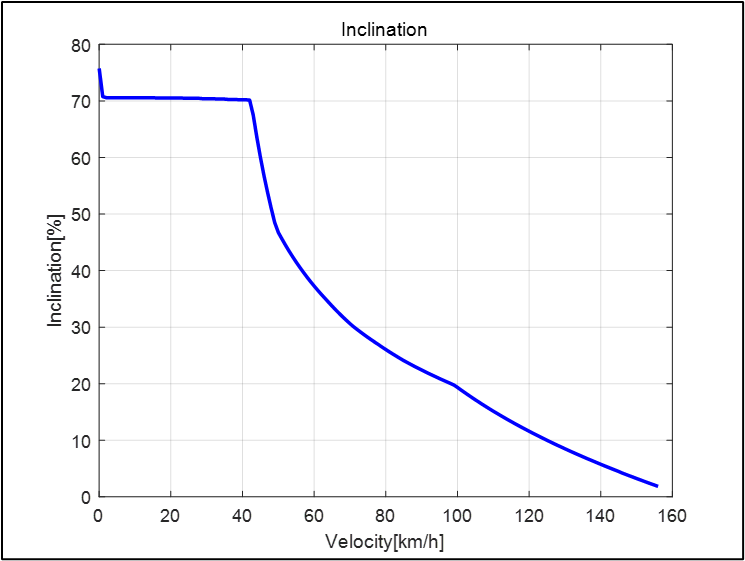
Figure 4: Simulation of Inclination Performance.
According to the Figure 2and 3,the maximum acceleration of the simulated hybrid and electric vehicle is about 3 m2/s, and the 100 km acceleration time is about 9s.The acceleration of the vehicle from standstill to 50 km/h is about 3s,and the static acceleration response time at 50 to 80km is about 3.2s.According to the Figure 3,the maximum speed of the vehicle is approximately 164km/h. In terms of Figure 4,the max climb slop is around 74%.The slop remains at approximately 70% in the range of 1km/h and 43 km/h, followed by a continuous decrease to 6% which the velocity raises to 140km/h. Therefore, the acceleration performance and maximum speed as well as climb performance of the model meet the design requirements.
3. FTP72 cycle performance simulation and optimization
3.1. FTP72 cycle simulation
In order to learn the consumption and process of the FTP72 cycle, I remain the above selected parameters and working conditions to conduct a simulation of the cycle. And the FTP72 cycle performance simulation is shown below:
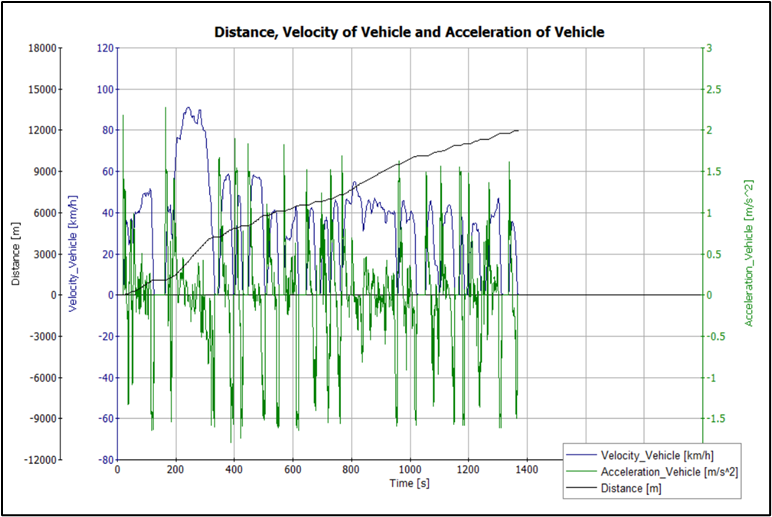
Figure 5: FTP-72 Cycle Simulation of Distance, Velocity and Acceleration.
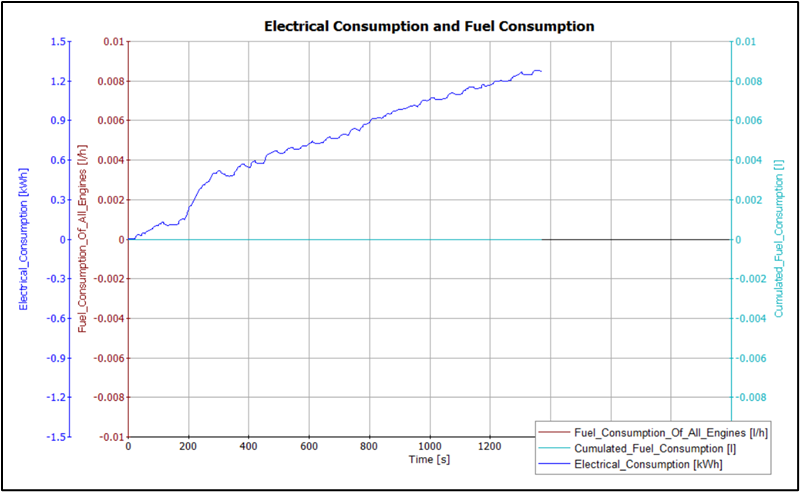
Figure 6: FTP72 Cycle Simulation of Electrical Consumption and Fuel Consumption.
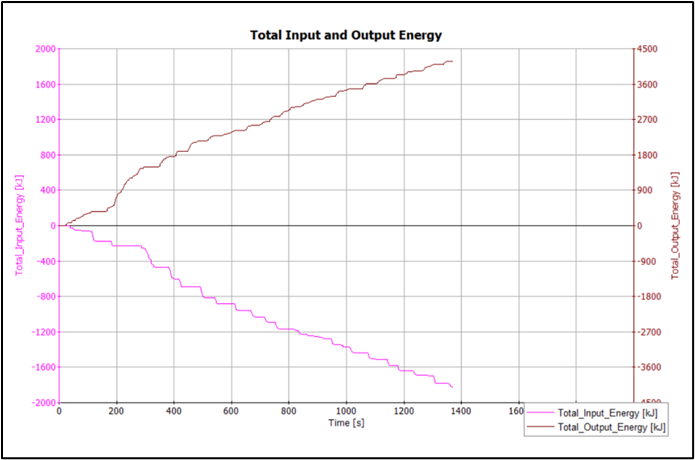
Figure 7: FTP72 Cycle Simulation of Electric Total Input and Output Energy.
The following presents the hybrid and electric vehicle cycle simulation data based on AVL-Cruise with Figures 5, 6 and 7 illustrating the Distance, Velocity and Acceleration of Vehicles, Electrical Consumption and Fuel Consumption and Electric Total Input and Output respectively. According to Figure 6,the Electrical Consumption at the end of the urban cycle is approximately 0.0082 kwh.
As shown in Figure 7, the final energy consumption of the hybrid and electric vehicle is almost 4200 KJ. To address the energy consumption issues in most vehicles which are prevalent on the market, it’s a must to learn the factors affecting the vehicle energy consumption.
3.2. Analysis on the influencing factors of energy consumption of hybrid and electric vehicle cycle condition
3.2.1. Mass and Energy Consumption
From the Figure 8,the energy relationship is obtained by changing the mass of the vehicle when simulation in the appropriate condition. We can draw mass and energy consumption has an approximate linear relevance. Matlab is used to conduct correlation analysis. And the equation of mass and energy consumption is:

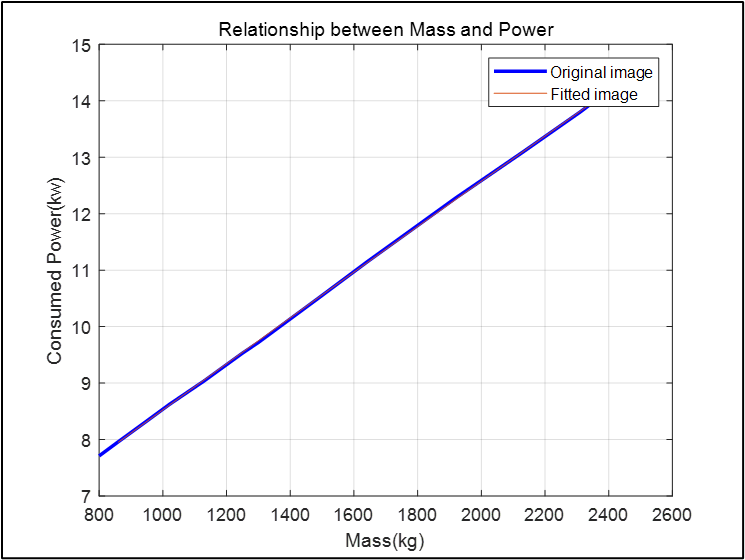
Figure 8: Relationship between Mass and Power.
In addition, in terms of Figure 9,the residual analysis is showed. All the data are in the confidence interval. As a result, the energy consumption could be decreased about 400 KJ when the mass if reduced by 100 kg. Therefore, we should try to deplete the mass of vehicle to cut down the consumption. For example, optimizing the design, structure and material or optimizing the battery’s mass or construction can reduce the electric consumption.
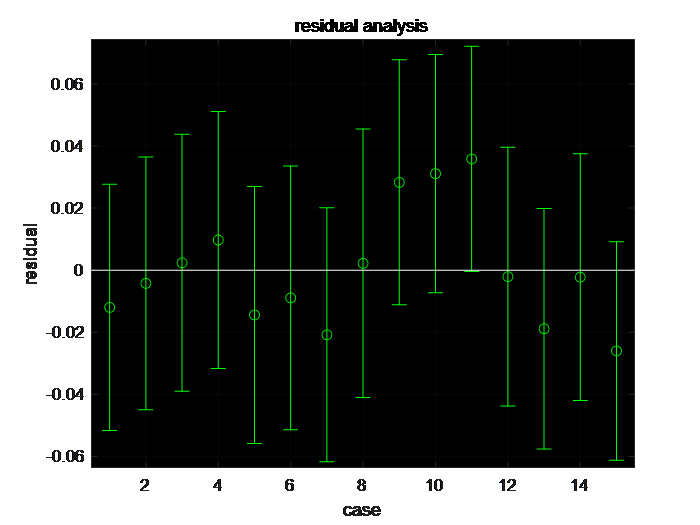
Figure 9: Residual analysis.
3.2.2. Drag Coefficient and Energy Consumption
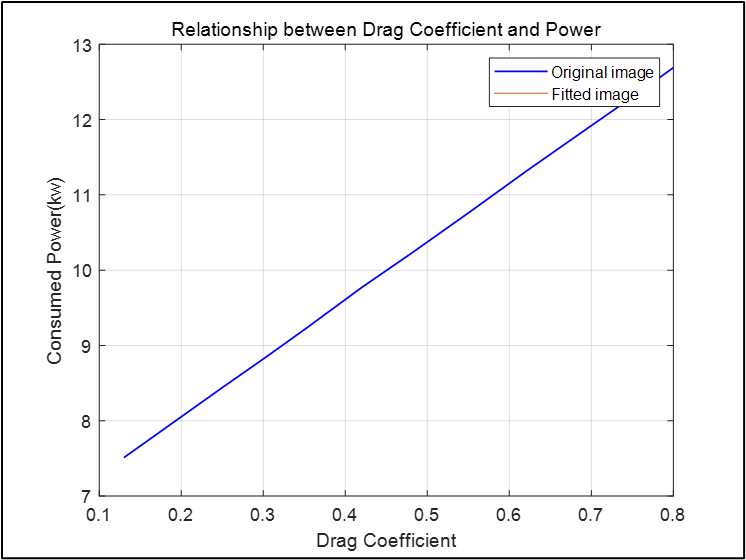
Figure 10: Relationship between Drag Coefficient and Power.
As the same, by changing the drag coefficient we can get the energy consumption when in appropriate environment. According to fitting results, the relationship between drag coefficient and consumed power is:

We can draw that the relationship is approximately quadratic function. And the residual analysis meets expectations in the cycle condition.
3.2.3. Motor Power and Energy Consumption
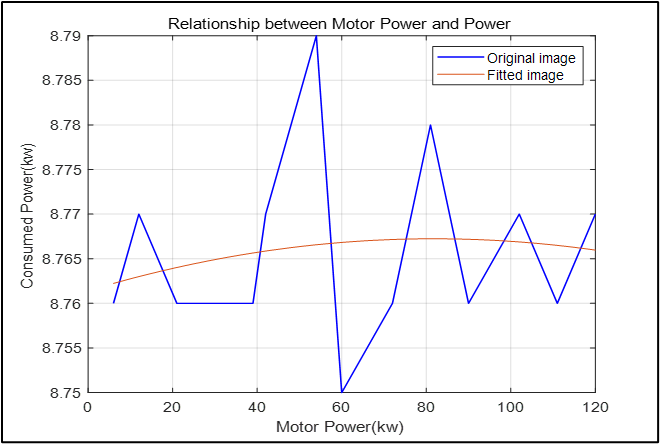
Figure 11: Relationship between Motor Power and Power.
Similarly, we can obtain the relationship between motor power and consumption by using the matlab. And the equation is showed below:

According to the relationship, we can learn the motor power has a little impact on the consumed power. And by changing the number of Cells per Cell-Row, the changing tendency remains the same as well. However, the number of the Cell-Rows and its arrangement will influence the structure of battery. Thus, optimizing the number and array of Cell-Rows may enhance the performance of vehicle[7][8].
4. Conclusion
In conclusion, this paper presents the development of a simulation model for hybrid and electric vehicles using AVL-Cruise software, providing a comprehensive assessment of their performance. Initially, I derived the equations of motion relevant to the dynamic behavior of these vehicles. Following this, I conducted simulations under appropriate conditions and environments to evaluate key performance metrics. The simulation results demonstrate that hybrid and electric vehicles meet essential performance requirements, including acceleration, maximum speed, and climbing capability. The vehicles achieved a top speed of 164 km/h, an acceleration rate of 3 m/s², and a maximum climbing ability of 70%. These outcomes highlight the vehicles' potential to perform effectively in real-world conditions. I further analyzed the factors influencing vehicle performance during the FTP72 cycle. The results indicated a power consumption of approximately 0.0082 kWh, with total energy consumption reaching nearly 4200 kJ. A notable linear relationship between vehicle mass and power consumption was observed; as mass increases, energy consumption rises correspondingly. Residual analysis confirmed that all data points fall within the confidence interval, validating the reliability of the simulation results. Additionally, I explored the relationship between the drag coefficient and power consumption, identifying an approximate quadratic correlation. As the drag coefficient decreases, energy consumption also decreases, underscoring the significance of aerodynamic efficiency. Furthermore, the relationship between motor power and energy consumption was investigated. The findings, as presented in Figure 10, suggest that motor power has a minimal impact on energy consumption, unlike factors such as the number of cells per cell-row and the number of cell-rows. However, modifying the battery connection method or its structural design could potentially reduce total energy consumption, thereby optimizing vehicle design. The model developed in this study offers valuable data and insights that can facilitate the optimization of hybrid and electric vehicles, broadening their development scope and enhancing their viability as sustainable transportation solutions.
References
[1]. Shu Hong.Research on Current Situation and Trend of Control Strategies for Hybrid Electric Vehicles.
[2]. Luo Xiaobin,Zhang Mingkai.Application of AVL-Cruise and Matlab/Simulink Co-simulation Methods in a Hybrid Vehicle Development.
[3]. Yu Zhisheng. Automobile Theory [M]. Beijing: Mechanical Industry Press,2009.
[4]. Chen Jiarui,Ma Tianfei.Automoblie Structure[M].Beijing:People’s Communications Press,2005.
[5]. Peng Tao, Chen Quanshi, Tian Guangyu, Li Haichen.Parameter Matching of the Power System for Parallel Hybrid Electric Vehicles.
[6]. Dong Xiangjun.Simulation Research on the hybrid electric bus based on Cruise software.
[7]. Ai Xinping,Yang Hanxi.Electric Vehicles and Power Batteries.
[8]. Yu Yongtao.Optimization of Design and Control for Power-split Hybrid Electric Vehicle.
Cite this article
Zhao,S. (2025). Based on AVL-CRUISE Hybrid and Electric Vehicle Simulation and FTP-72 Circle Power Consumption Factor Analysis. Applied and Computational Engineering,125,15-24.
Data availability
The datasets used and/or analyzed during the current study will be available from the authors upon reasonable request.
Disclaimer/Publisher's Note
The statements, opinions and data contained in all publications are solely those of the individual author(s) and contributor(s) and not of EWA Publishing and/or the editor(s). EWA Publishing and/or the editor(s) disclaim responsibility for any injury to people or property resulting from any ideas, methods, instructions or products referred to in the content.
About volume
Volume title: Proceedings of the 3rd International Conference on Mechatronics and Smart Systems
© 2024 by the author(s). Licensee EWA Publishing, Oxford, UK. This article is an open access article distributed under the terms and
conditions of the Creative Commons Attribution (CC BY) license. Authors who
publish this series agree to the following terms:
1. Authors retain copyright and grant the series right of first publication with the work simultaneously licensed under a Creative Commons
Attribution License that allows others to share the work with an acknowledgment of the work's authorship and initial publication in this
series.
2. Authors are able to enter into separate, additional contractual arrangements for the non-exclusive distribution of the series's published
version of the work (e.g., post it to an institutional repository or publish it in a book), with an acknowledgment of its initial
publication in this series.
3. Authors are permitted and encouraged to post their work online (e.g., in institutional repositories or on their website) prior to and
during the submission process, as it can lead to productive exchanges, as well as earlier and greater citation of published work (See
Open access policy for details).
References
[1]. Shu Hong.Research on Current Situation and Trend of Control Strategies for Hybrid Electric Vehicles.
[2]. Luo Xiaobin,Zhang Mingkai.Application of AVL-Cruise and Matlab/Simulink Co-simulation Methods in a Hybrid Vehicle Development.
[3]. Yu Zhisheng. Automobile Theory [M]. Beijing: Mechanical Industry Press,2009.
[4]. Chen Jiarui,Ma Tianfei.Automoblie Structure[M].Beijing:People’s Communications Press,2005.
[5]. Peng Tao, Chen Quanshi, Tian Guangyu, Li Haichen.Parameter Matching of the Power System for Parallel Hybrid Electric Vehicles.
[6]. Dong Xiangjun.Simulation Research on the hybrid electric bus based on Cruise software.
[7]. Ai Xinping,Yang Hanxi.Electric Vehicles and Power Batteries.
[8]. Yu Yongtao.Optimization of Design and Control for Power-split Hybrid Electric Vehicle.