


1. Introduction
The need for flying performance is growing as small, low-speed unmanned aerial vehicles (UAVs) continue to be developed. Improving the lift-to-drag ratio of wings through optimized aerofoil design is an effective way to enhance UAV flight efficiency, improve flight performance, and extend flight range. Generally, small UAVs, due to their compact size, typically operate in the Reynolds number range of 104<Re<106. Aerofoils that perform well at Re>106 often show poor performance under these conditions [1]. Therefore, aerofoils designed for low Reynolds numbers are the primary choice for designing UAVs.
The S series aerofoils are a special class of aerofoils with an S-shaped camber. One of the characteristics of these aerofoils is that the centre of pressure remains unchanged with changes in the angle of attack, which leads to stable moment characteristics. Therefore, this type of aerofoil can be used in UAVs with high stability requirements, such as those without horizontal tail surfaces. The S1223 aerofoil studied in this paper is a low Reynolds number high lift-to-drag ratio aerofoil designed by Selig [2]. Its maximum lift coefficient can reach 2 or more, and its drag coefficient is at a low level in the stall range, which has great advantages over many low-speed aerofoils.
Wael A. Mokhtar carried out numerical studies to investigate the effect of transition coefficients on the performance of high-lift aerofoils at low Reynolds numbers, focusing on four aerofoils (LNV109A, E423, S1223, and NACA 9315), under different Reynolds numbers. He proposed a methodology to consolidate various parameters influencing the performance of high-lift aerofoils into a singular performance indicator [3]. Lance W. Traub et al. investigated the effects of leading edge flaps and trailing edge flaps on thin flat-plate aerofoils by using a low-speed wind tunnel. Their findings demonstrated that the aerofoil's efficiency can be greatly increased by deploying the leading and trailing edge flaps at low Reynolds numbers [4]. Boughou S et al. investigated the computational accuracy of aerodynamic characteristics of high lift and low Reynolds number aerofoils using different turbulence models. Their results indicate SST K-ω and Transition SST models better capture unsteady flow behaviors near and beyond stall conditions, providing more accurate predictions. [5]. Zohary et al. used an Intermittency SST model (three-equation) in numerical studies to demonstrate that compared to XFOIL, non-steady state simulations can predict transition with relatively higher accuracy, and the S1223 aerofoil performs well in providing high lift coefficients [6]. Zu Hongya et al. studied the influence of relative flap chord length on the aerodynamic performance of aerofoils and found that aerofoils with flaps have lower lift coefficients and higher drag coefficients than the baseline aerofoil, but the maximum lift coefficient was higher than that of the baseline aerofoil [7].
Optimizing aerofoils is of great significance for the research and design of aircraft, wind turbines, racing cars, and other fields today. By optimizing the existing wing design, it can meet the needs of different working conditions. With advances in modern Computational Fluid Dynamics (CFD), low-cost numerical simulation methods have become a common approach for conducting thorough performance analyses of aerofoils during the design phase. This paper is based on ANSYS Fluent fluid simulation software to simulate the S1223 aerofoil and its modified versions, incorporating a deflected flap and a slotted flap. Based on the results of the simulation, the differences in lift and drag coefficient characteristic curves at different angles of attack are analysed to provide data reference for the optimization of this type of aerofoil.
2. Computational model and mesh generation
2.1. Two-Dimensional geometric model
This study uses the original S1223 aerofoil and the modified versions with a downward-deflected flap at 70% chord length (deflected 10°) and a slotted flap at 70% chord length (deflected 10°, with a slot width of 1.5% chord length). The two-dimensional aerofoil sections are generated by importing coordinate data points into ANSYS Fluent, creating the geometry for CFD simulation. The original and modified aerofoil geometries are shown in Figures 1, 2, and 3.
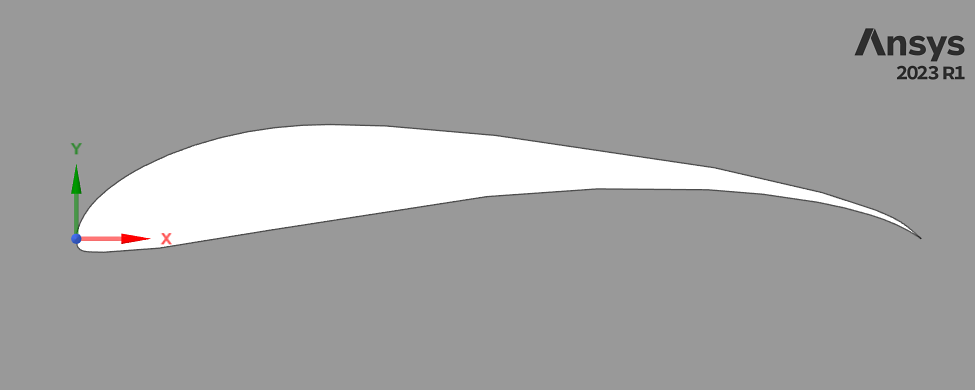
Figure 1: Geometry of the original S1223 aerofoil
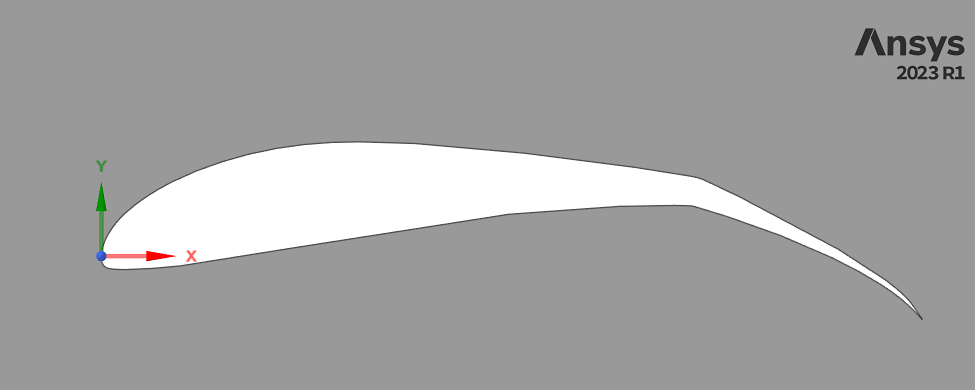
Figure 2: S1223 aerofoil with a 10° deflected flap (at 70% chord)
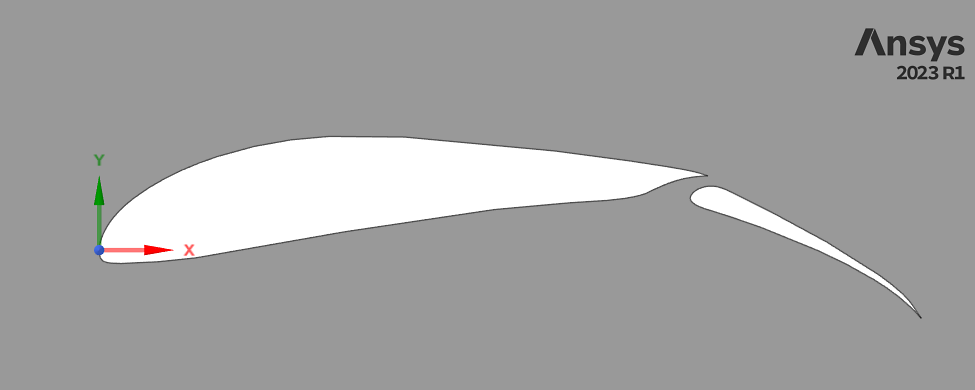
Figure 3: S1223 aerofoiled with a 10° deflected slotted flap (at 70% chord)
2.2. Domain partitioning and mesh generation
This paper adopts a C-H type computational domain, with the inlet boundary located at a distance of 15c from the trailing edge of the aerofoil. To fully develop the flow, the outlet boundary should be set for 30c away from the trailing edge. The computational domain's schematic diagram is depicted in Figure 4. The grid division adopts a two-dimensional structured grid, and boundary layer grids are used near the aerofoil surface [8]. This method has good quality and high computational efficiency. Taking the original S1223 aerofoil as an example, to ensure calculation accuracy, encryption processing was carried out near the aerofoil, with a total of 250,000 grid elements and a y+ value of 1.1. (shown in Figure 5)
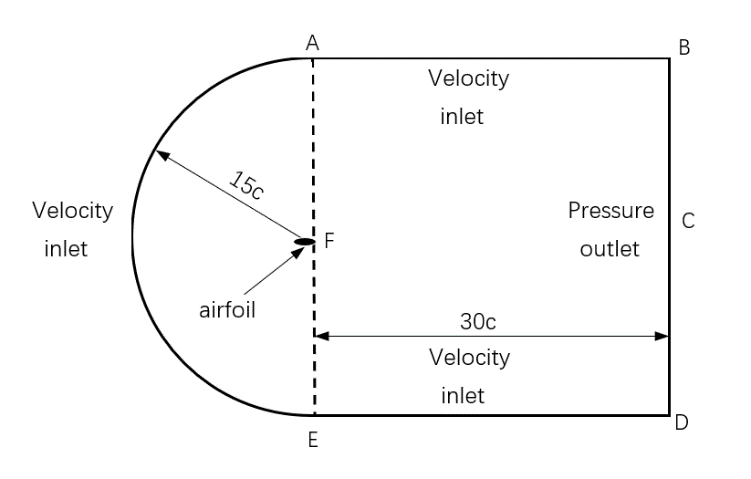
Figure 4: Computational domain schematic
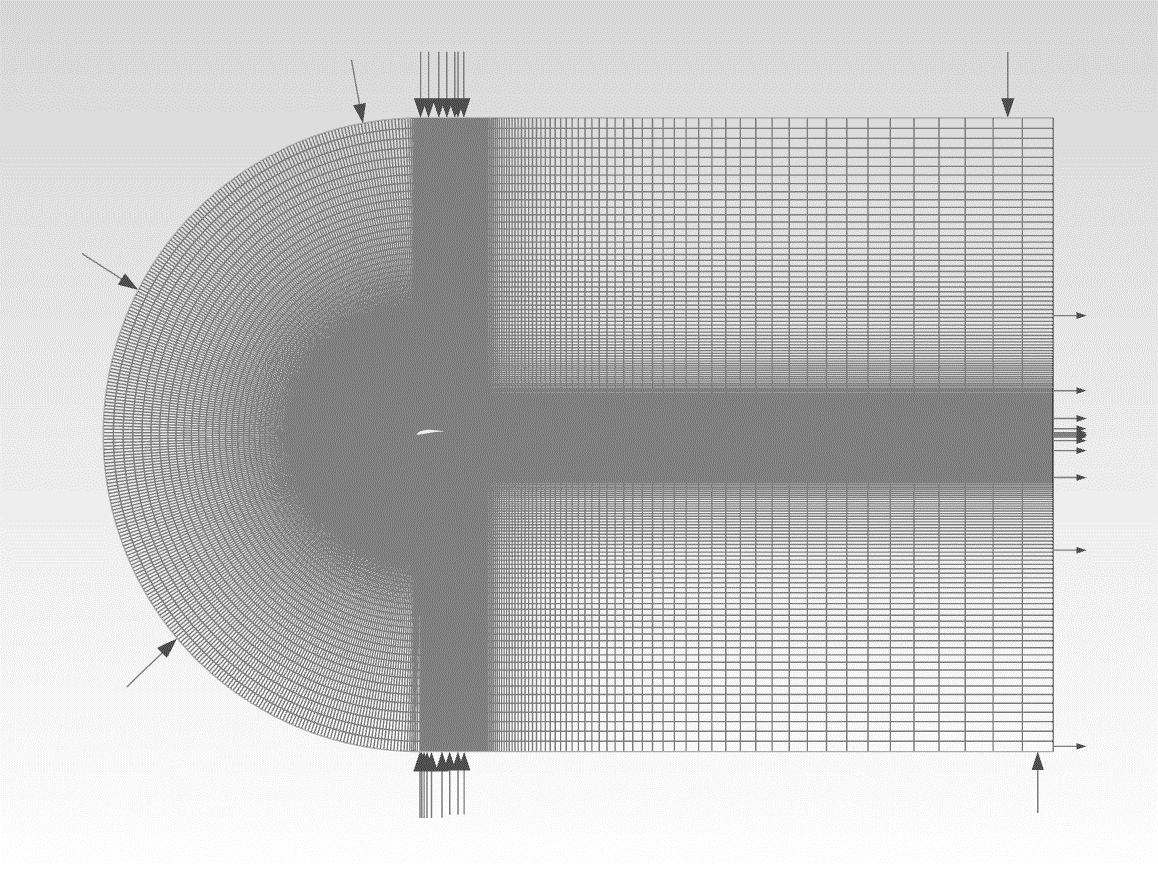
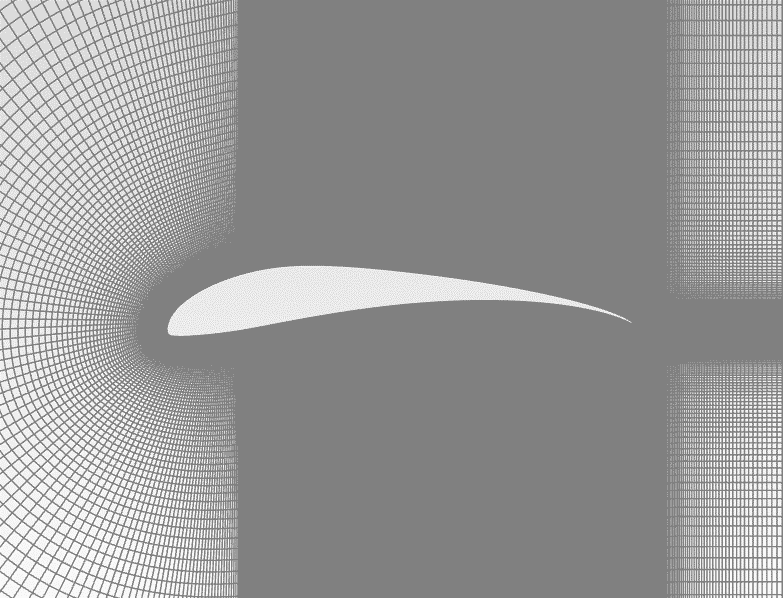
(a) Mesh generation (b) Mesh details near the aerofoil
Figure 5: Mesh and detailed grid around the aerofoil
2.3. Simulation parameters and governing equations
To simulate the working state of the wings of a small UAV during take-off and landing, the simulation parameters are set as follows: freestream velocity vi=15m/s, air density 1.225kg/m3, and Re=5.0×10⁵. The boundary conditions include a velocity inlet at AB, ED, and AE, and a pressure outlet at BD. The simulation uses a pressure-based solver. On this basis, the k-ω SST turbulence model is selected as the viscosity model. Initialization is performed using hybrid initialization. To ensure simulation accuracy, 1,000 iterations are set with a convergence criterion of 10-6. Table 1 summarizes the conditions of the simulation.
Table 1: Simulation Parameters
Input Parameters | Value |
Solver | Pressure-Based |
Viscous Model | k-ω SST Turbulence Model |
Wall Shear Condition | No-slip |
Pressure | Second order |
Gradient | Least-squares Cell-based |
Momentum | Second order upwind |
Turbulent Kinetic Energy | Second order upwind |
Viscosity | 1.7894×10⁵ kg/(m⋅s) |
Density | 1.225 kg/m3 |
Inlet Velocity | 15m/s |
Reynolds Number | 5.0×10⁵ |
Chord Length | 0.5m |
Solution Initialization | Hybrid Initialization |
The basic governing equations used in this paper are the two-dimensional incompressible fluid Navier Strokes equation, continuity equation, and shear stress transport k-ω SST turbulence model equations [9, 10].
The incompressible Navier-Stokes equations (two-dimensional) are as follows (1)(2):
\( ρ(\frac{∂u}{∂t}+u\frac{∂u}{∂x}+v\frac{∂u}{∂y})=-\frac{∂p}{∂x}+μ(\frac{{∂^{2}}u}{∂{x^{2}}}+\frac{{∂^{2}}u}{∂{y^{2}}}) \) (1)
\( ρ(\frac{∂v}{∂t}+u\frac{∂v}{∂x}+v\frac{∂v}{∂y})=-\frac{∂p}{∂y}+μ(\frac{{∂^{2}}v}{∂{x^{2}}}+\frac{{∂^{2}}v}{∂{y^{2}}}) \) (2)
The incompressible continuity equation (two-dimensional) is expressed as (3):
\( \frac{∂{u_{x}}}{∂x}+\frac{∂{u_{y}}}{∂y}=0 \) (3)
The k-ω SST turbulence model equations are as follows (4)(5):
\( \frac{D(ρk)}{Dt}={τ_{ij}}\frac{∂{u_{i}}}{∂{x_{j}}}-{β^{*}}ρωk+\frac{∂}{∂{x_{j}}}[(μ+{σ_{k}}{μ_{t}})\frac{∂k}{∂{x_{j}}}] \)
\( \frac{D(ρω)}{Dt}=\frac{γ}{{ν_{t}}}{τ_{ij}}\frac{∂{u_{i}}}{∂{x_{j}}}-{β^{*}}ρ{ω^{2}}+\frac{∂}{∂{x_{j}}}[(μ+{σ_{ω}}{μ_{t}})\frac{∂ω}{∂{x_{j}}}]+2(1-{F_{1}})\frac{ρ{σ_{ω2}}}{ω}\frac{∂k}{∂{x_{j}}}\frac{∂ω}{∂{x_{j}}} \) (4)
And the definition of turbulent eddy viscosity in k-ω is: (6):
\( {μ_{t}}=\frac{ρ{a_{1}}k}{max({a_{1}}ω,Ω{F_{2}})} \) (5)
3. Results and Discussion
Upon establishing the parameters and conditions, simulations were performed to determine the surface pressure, velocity distribution, and aerodynamic characteristics at various angles of attack for the original S1223 aerofoil, the aerofoil with a 10° downward deflected flap, and the slotted flap.
3.1. Comparison of lift and drag coefficients at different angles of attack
Figure 6 shows the lift and drag coefficients as a function of the angle of attack for the three aerofoils simulated at Re = 5.0 × 10⁵. The label "S1223" refers to the original aerofoil, "S1223-70-1" refers to the aerofoil with a downward deflected flap, and "S1223-70-2" refers to the slotted flap. Figure 7 shows the lift-to-drag ratio at different angles of attack.
The results indicate that, at low angles of attack between 0° and 12°, the lift coefficients of all three aerofoils increase almost linearly with increasing angle of attack. Both the downward deflected flap and the slotted flap significantly improve the lift coefficient, but they also increase the drag coefficient. The slotted flap provides the highest lift coefficient, while its drag coefficient lies between the other two configurations.
All three aerofoils begin to stall at AOA around 16°, as shown in the figure with a decrease in lift coefficient and an increase rapidly in drag coefficient. The stalled process of the original aerofoil is relatively mild.


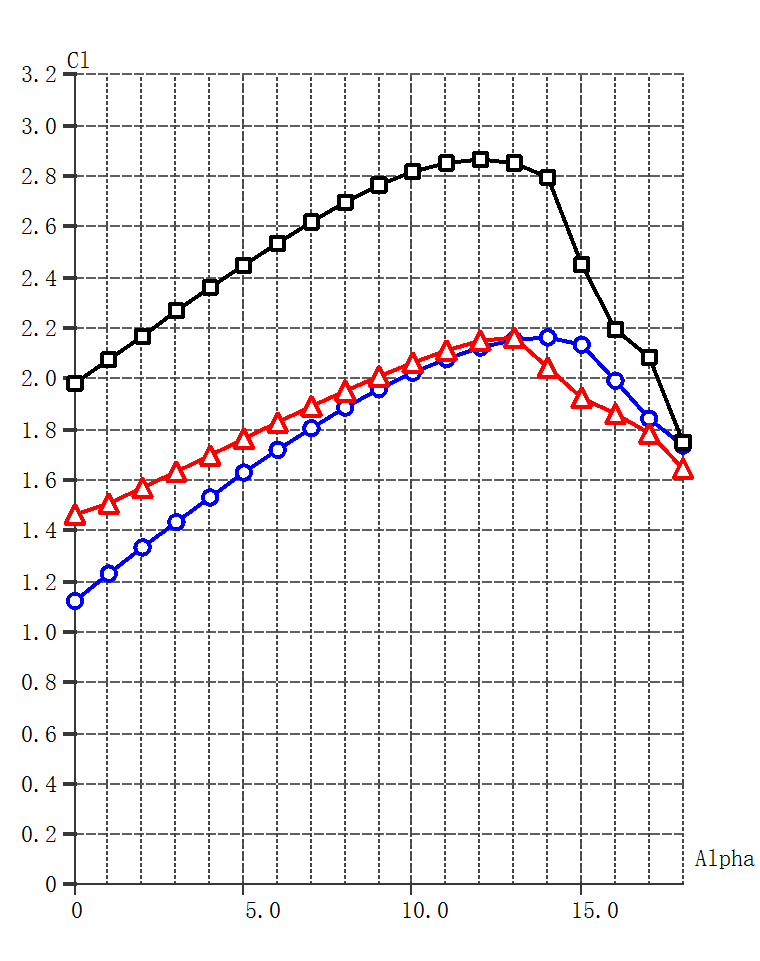
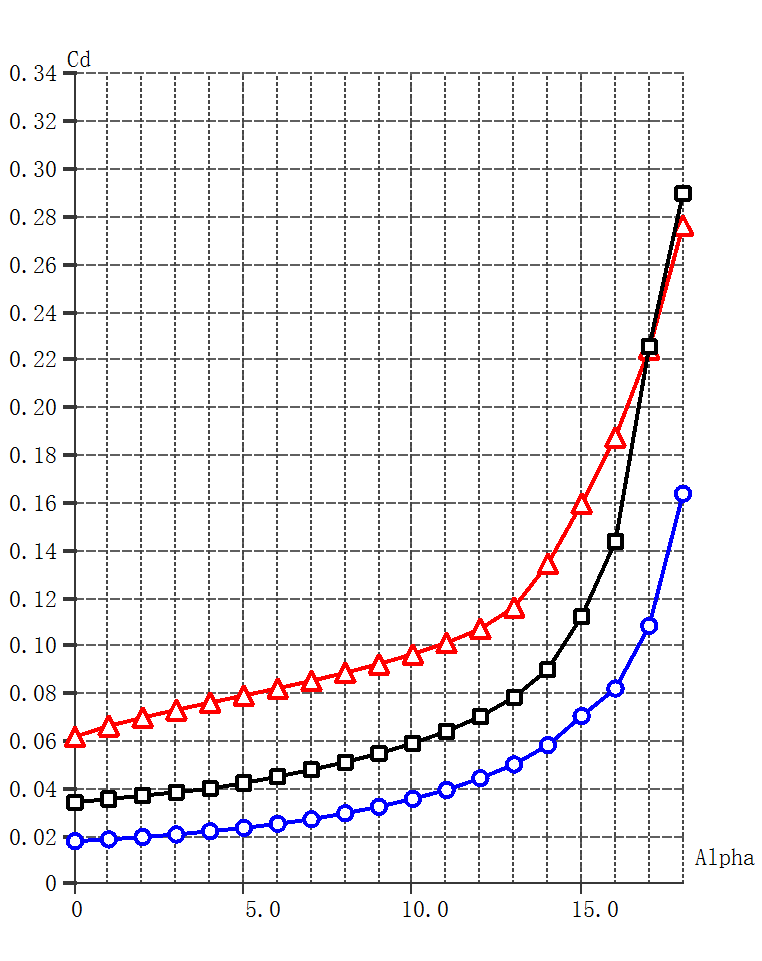
(a) Lift coefficient vs. AOA (alpha) (b) Drag coefficient vs. AOA (alpha)
Figure 6: Lift and drag coefficient characteristic curves
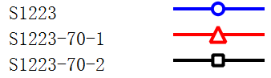
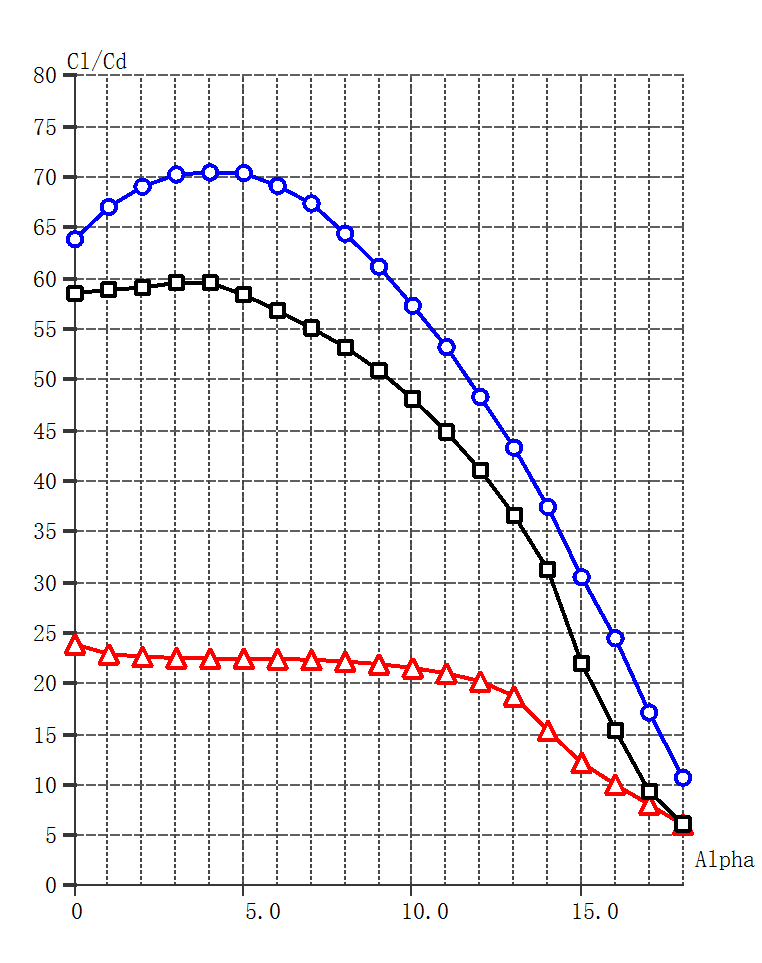
Figure 7: Lift-to-drag ratio characteristics curves
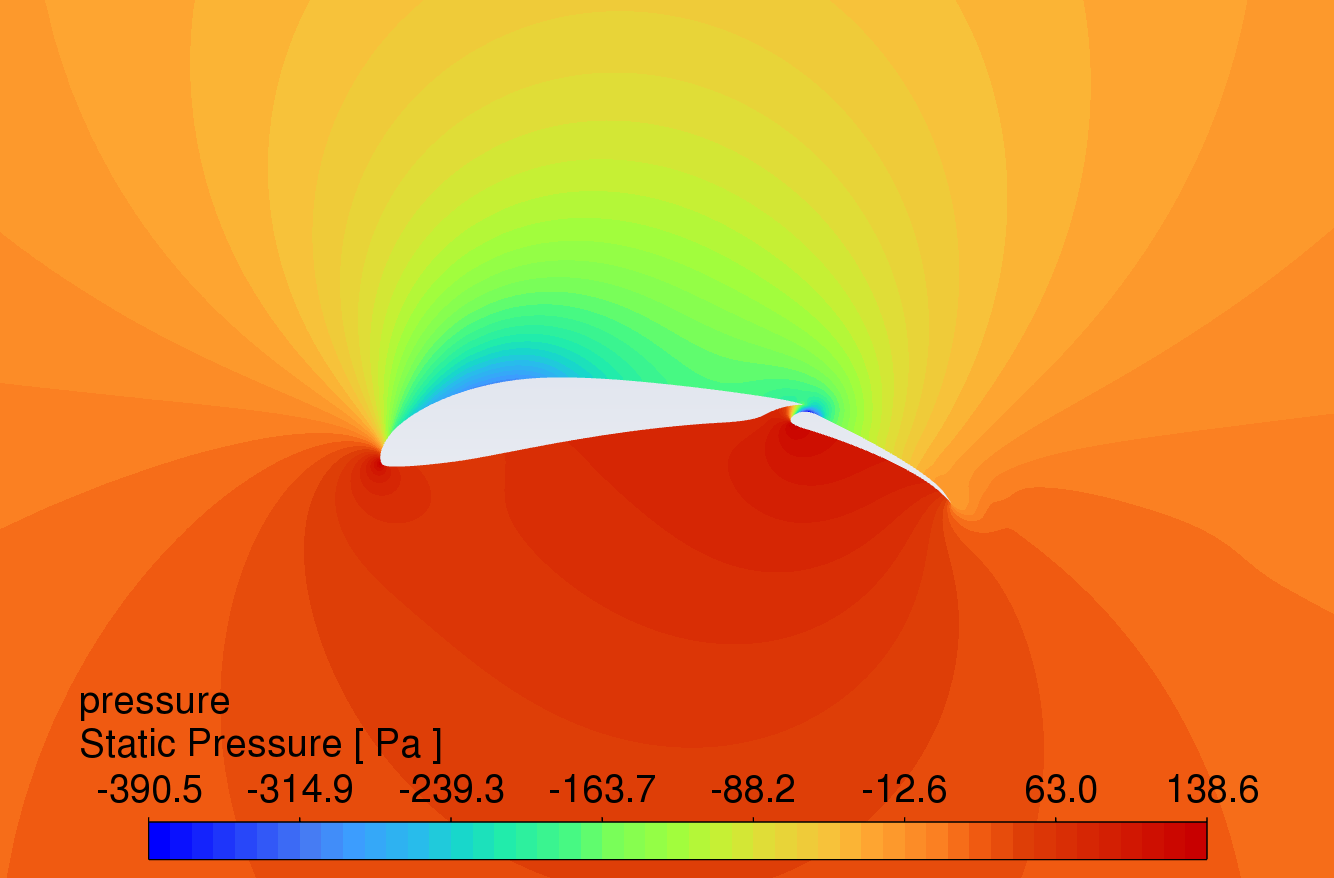
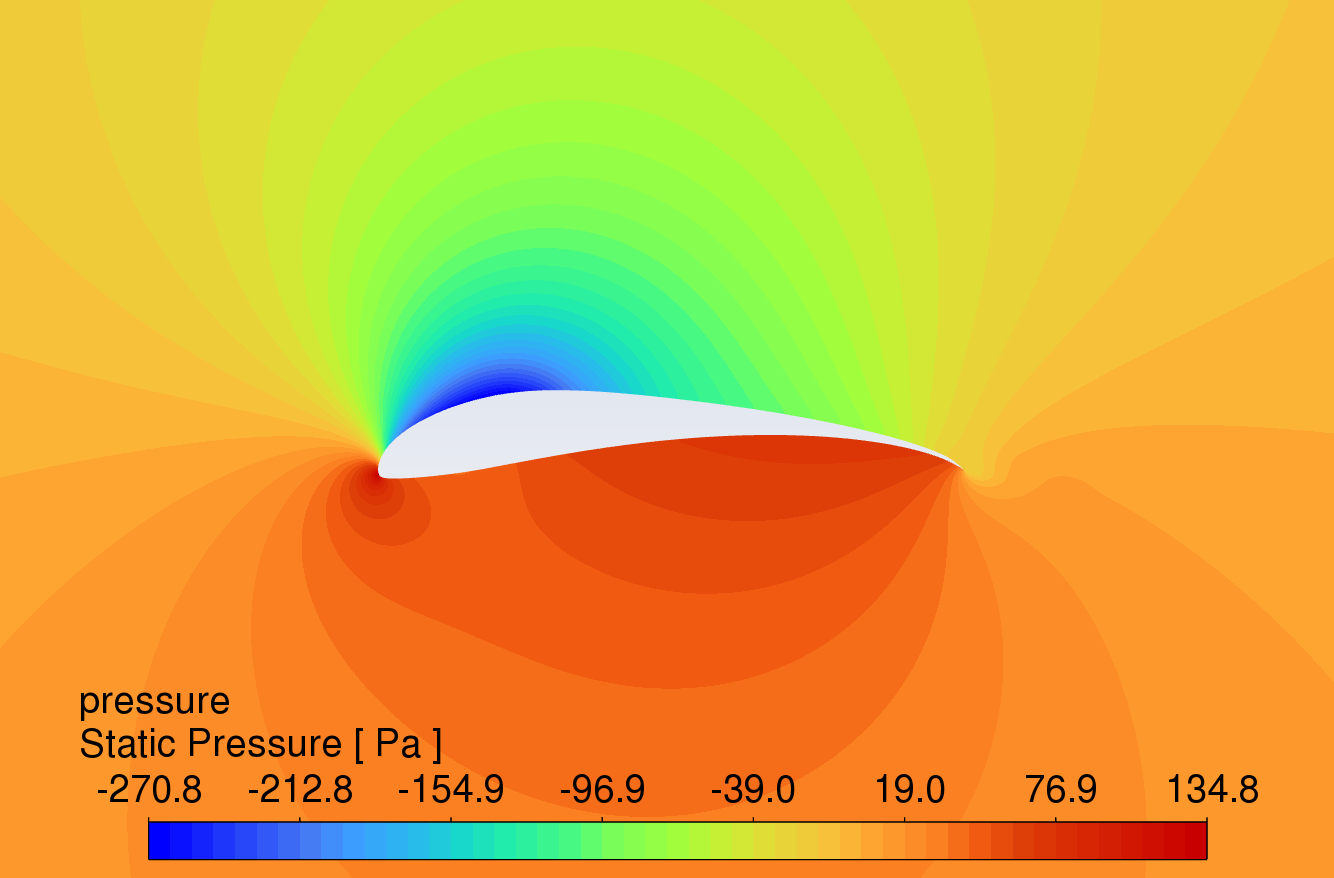
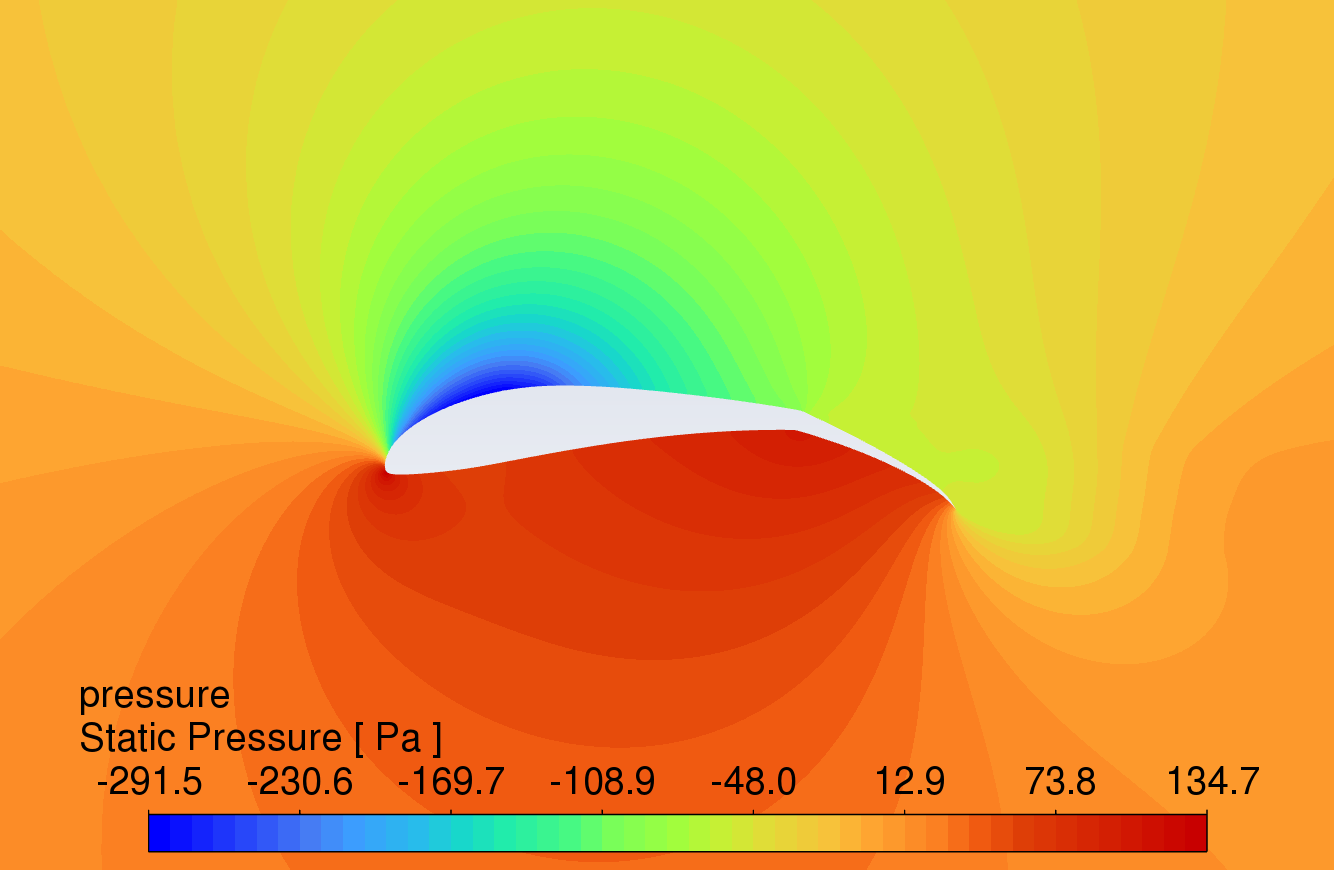
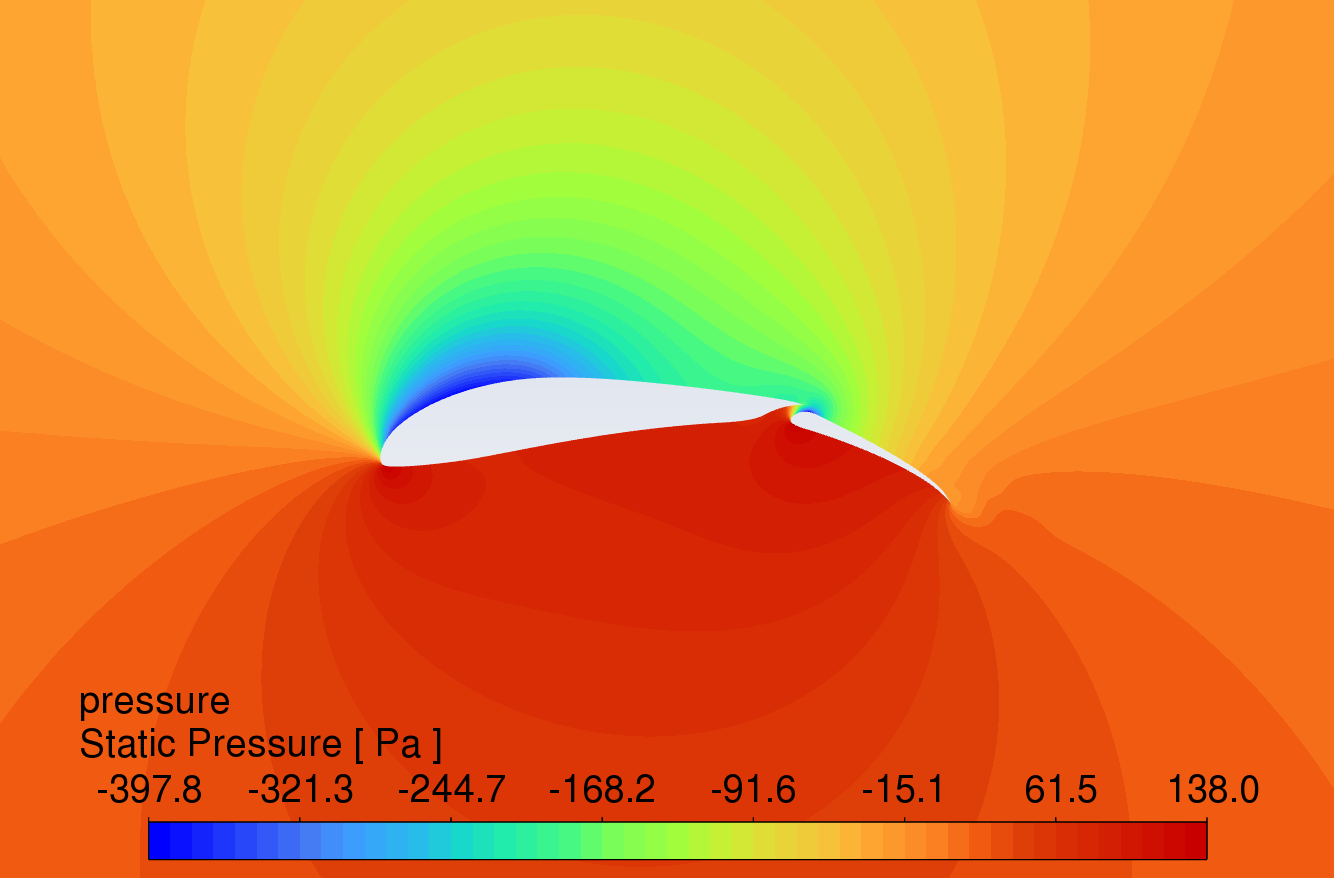
3.2. Pressure contour comparison at different angles of attack
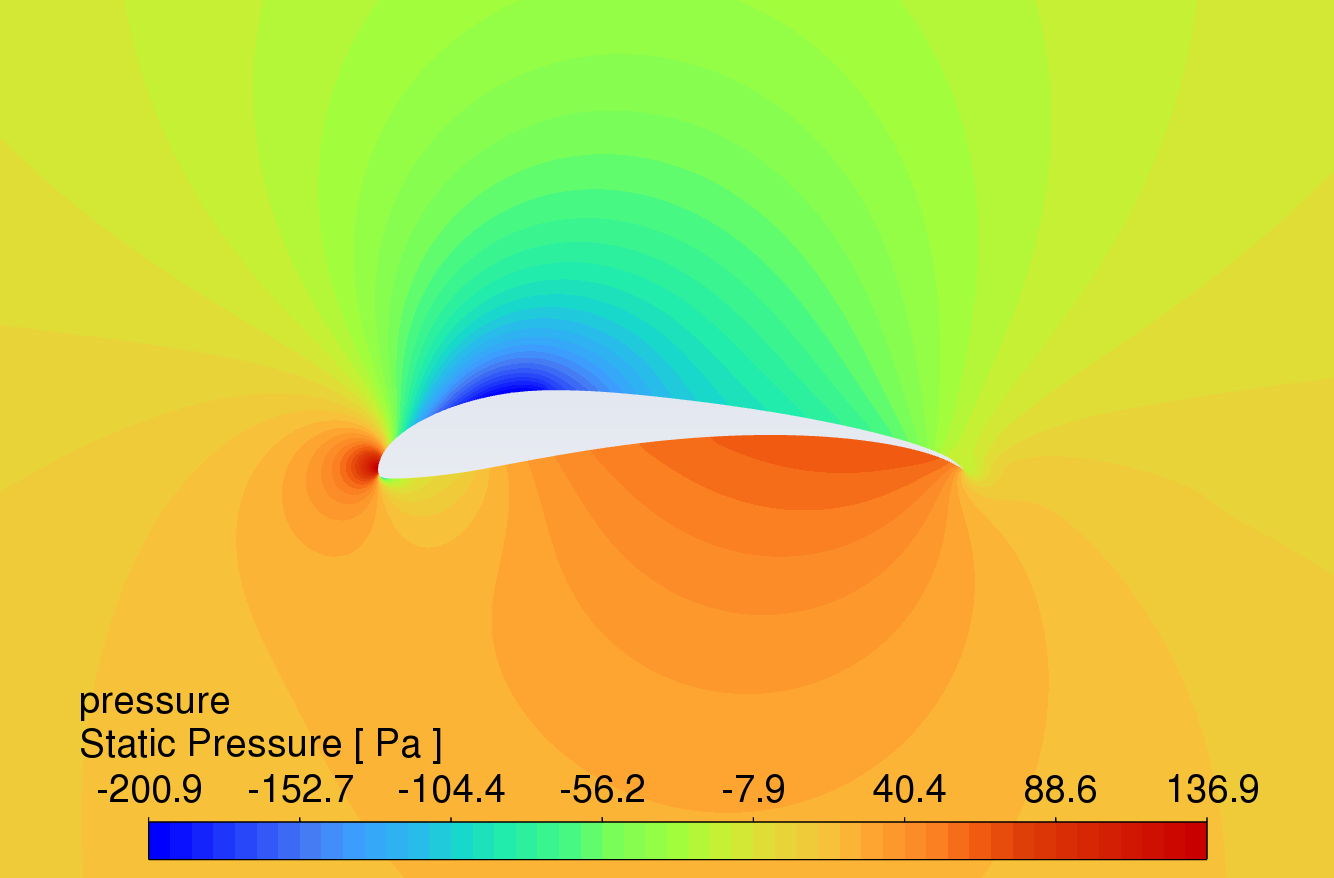
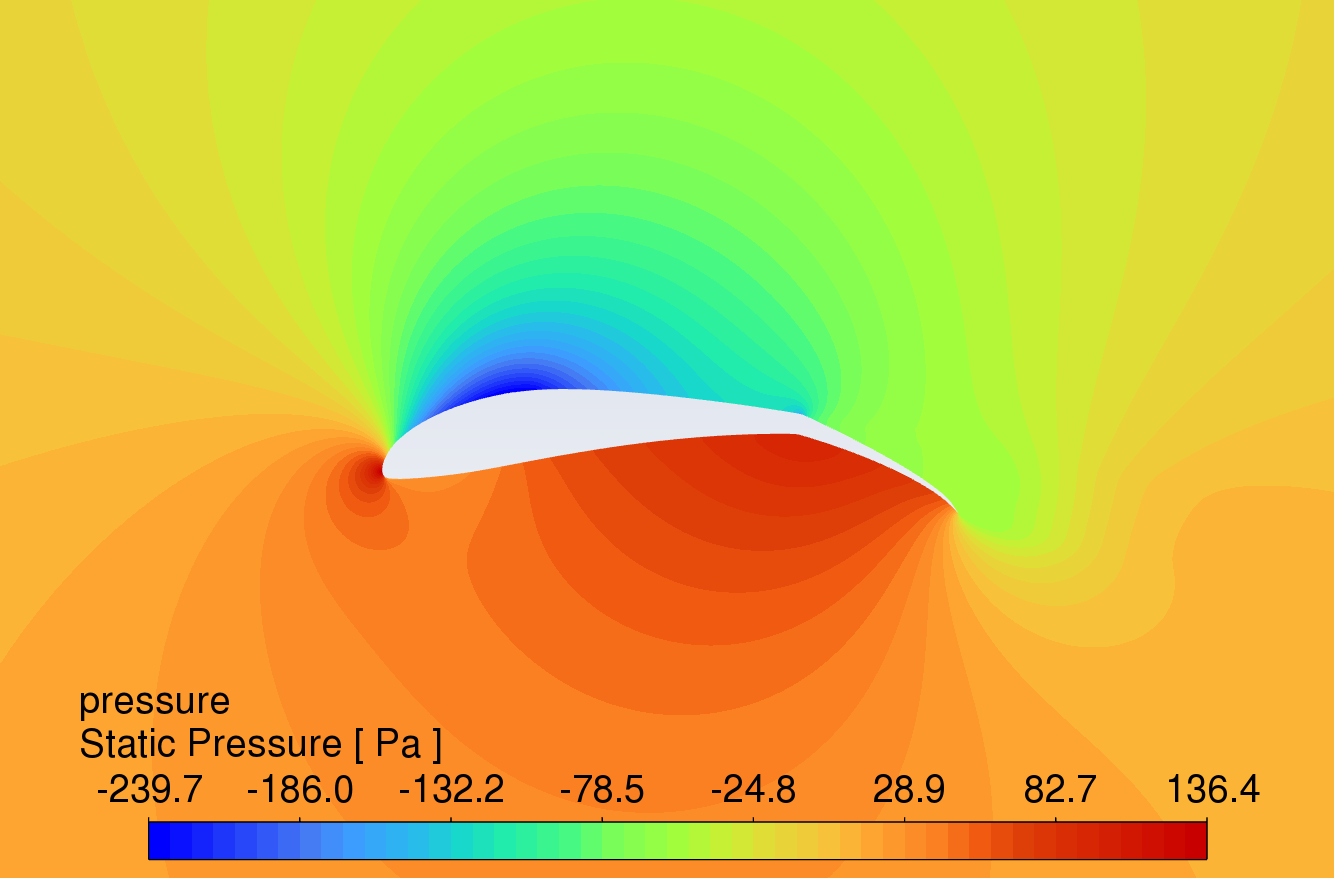
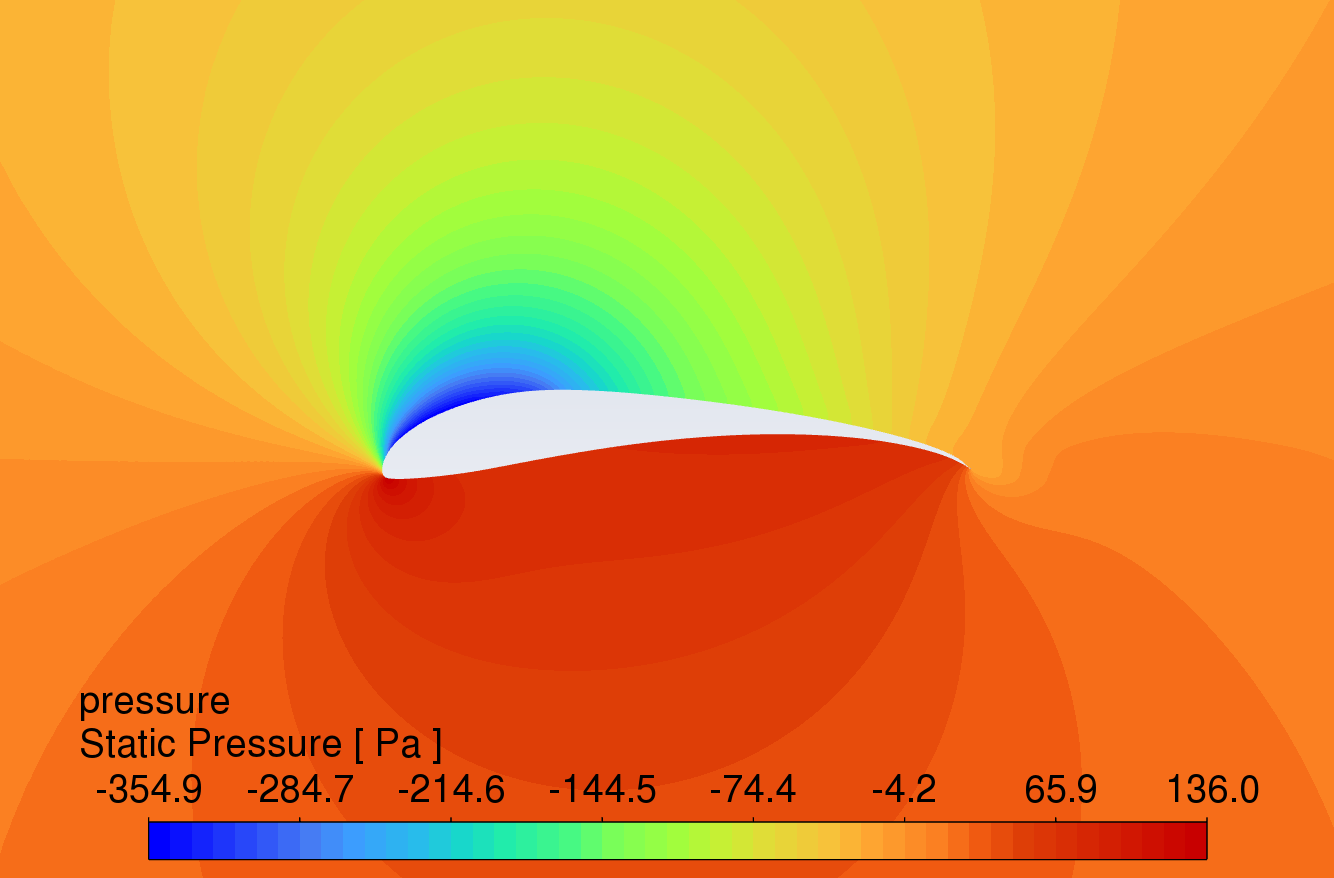
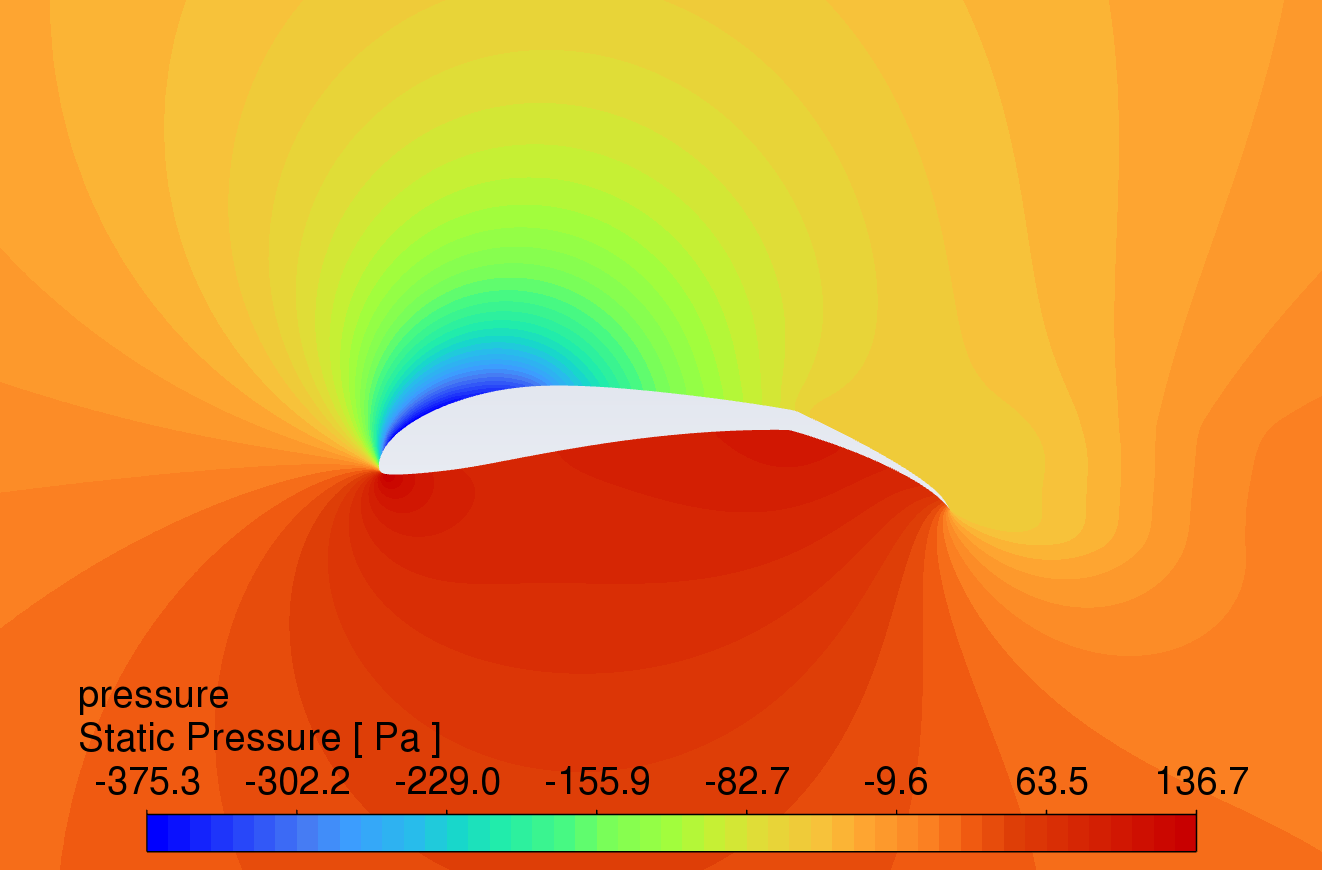
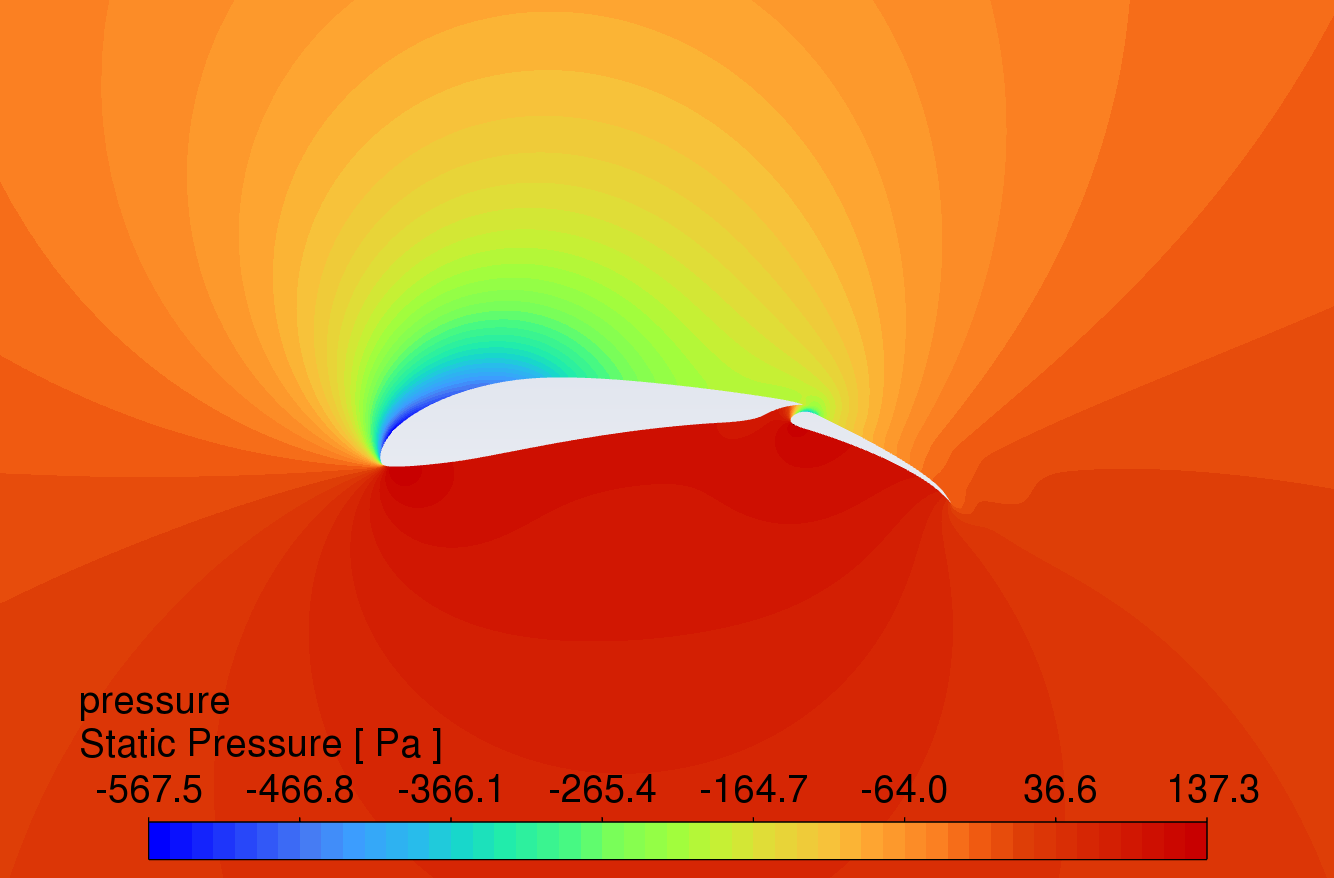
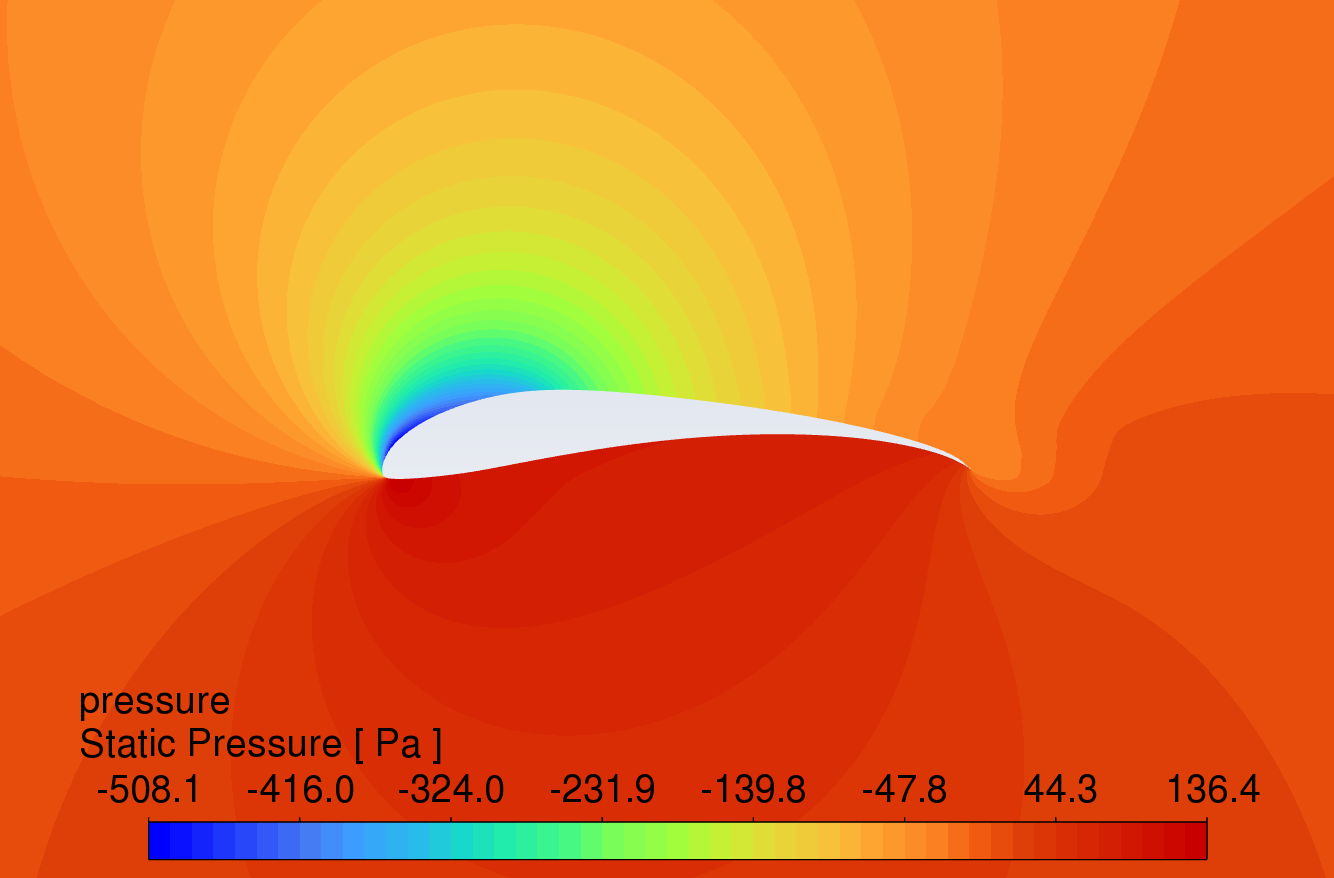
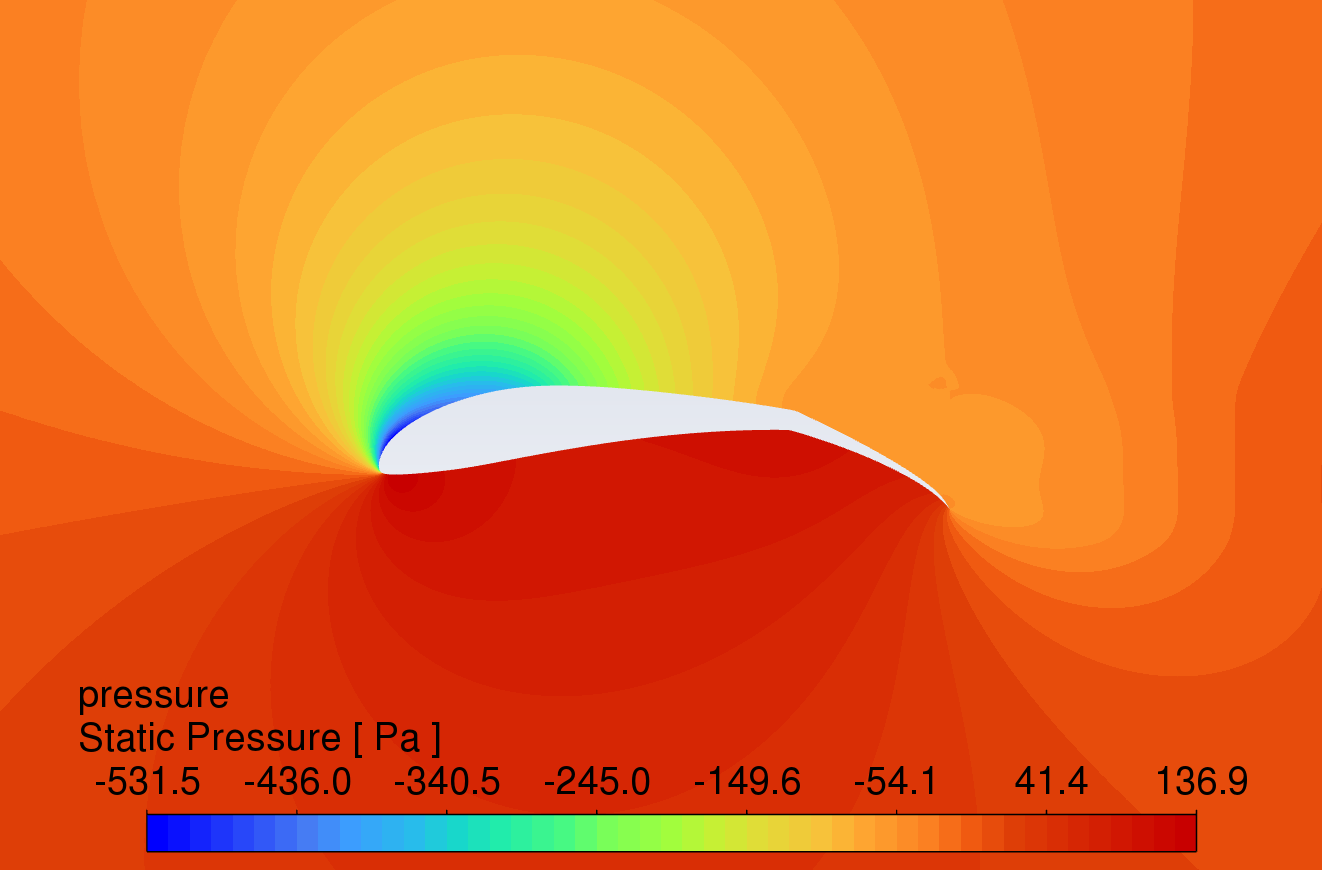
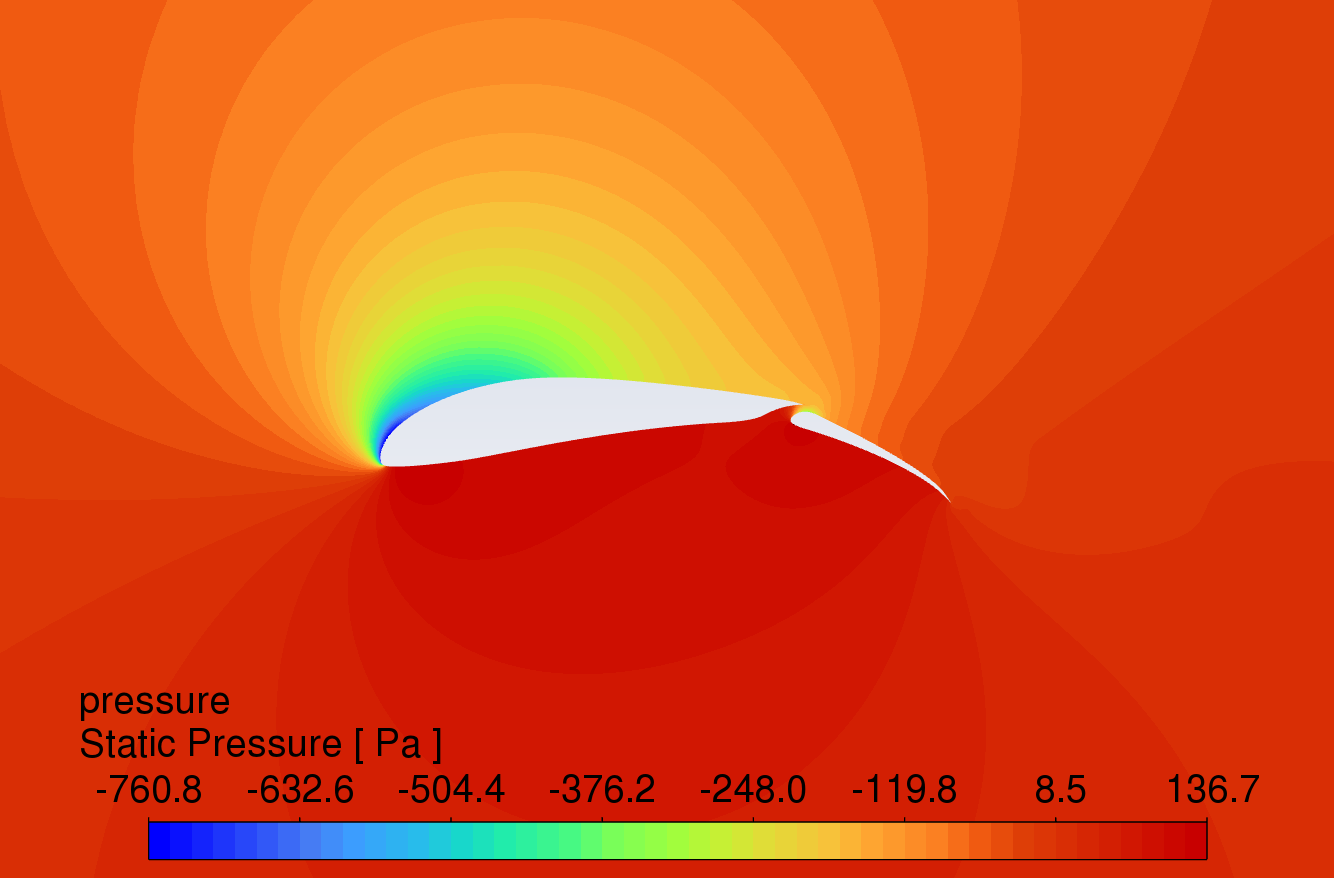
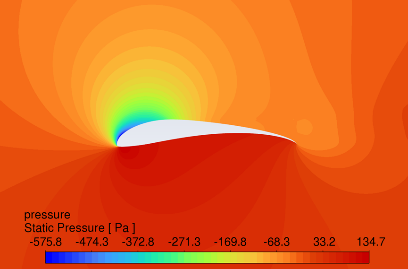
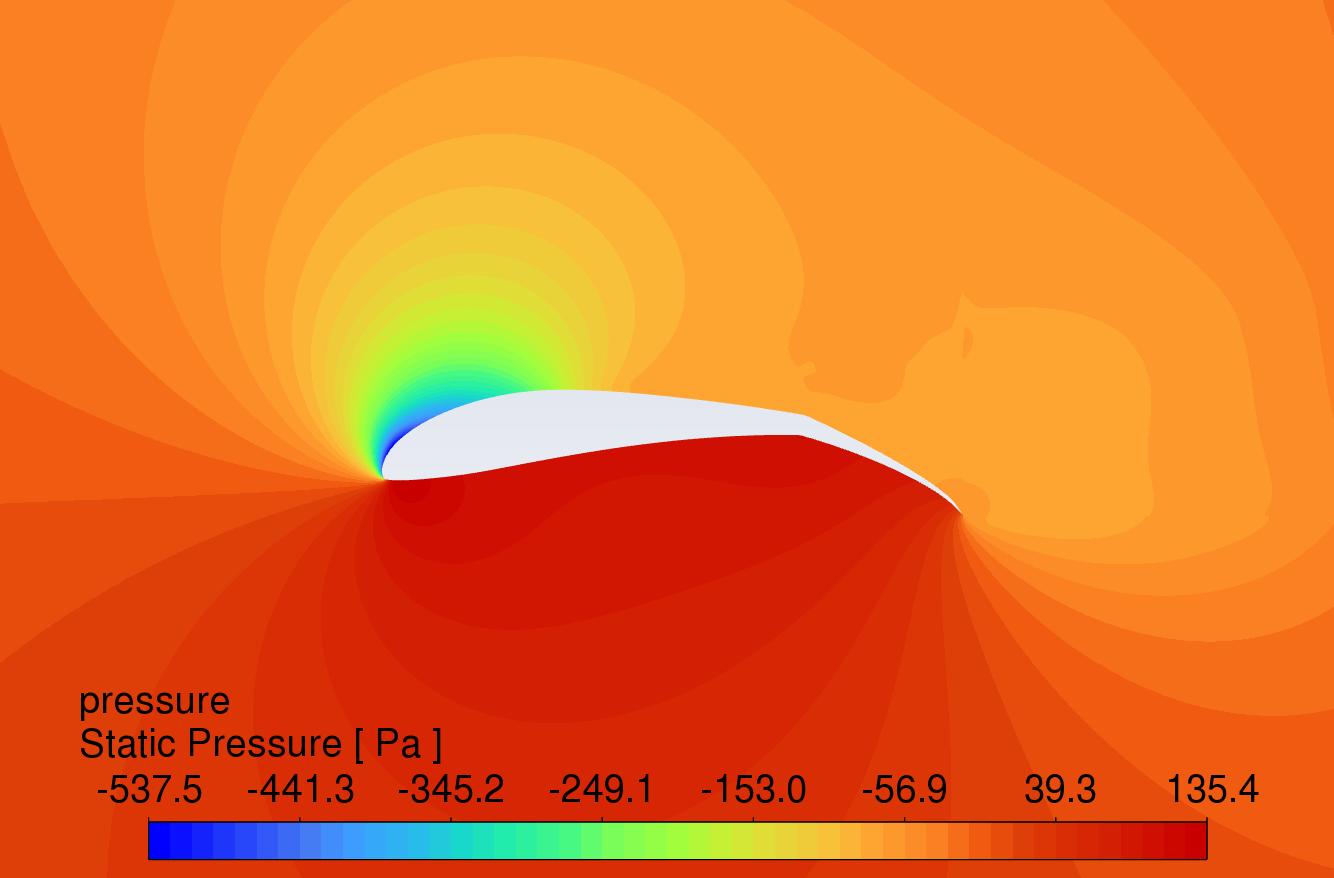
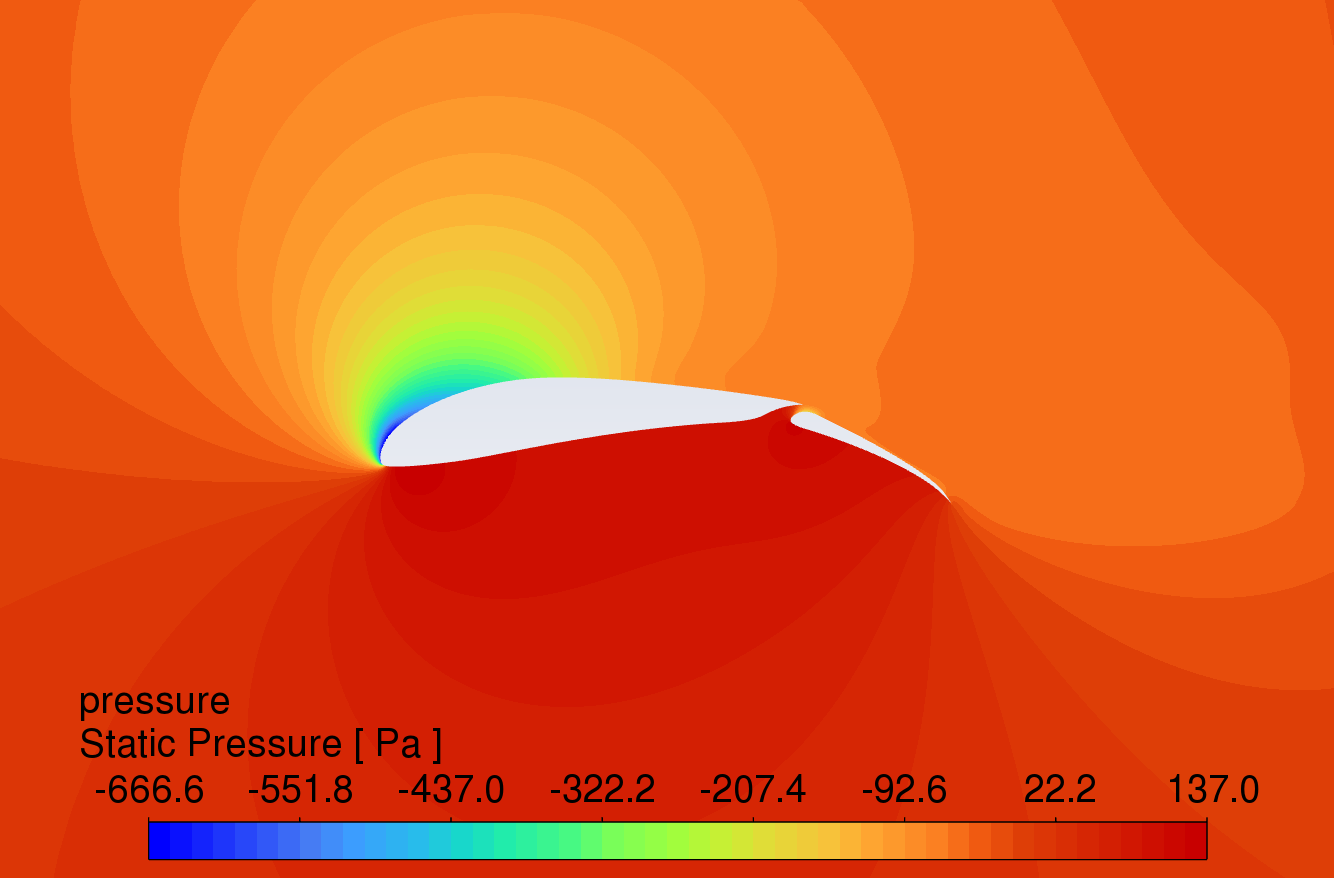
The pressure contour plots of the original S1223 aerofoil, the aerofoil with a 10° flap deflected downward, and the slotted flap at 0° to 16° AOA are shown in Figure 8. The results reveal that the aerofoil with flaps and slotted flaps has the highest static pressure at the leading-edge stagnation point and the lowest static pressure at the upper surface of the leading edge under the action of an incoming flow velocity of 15m/s. The overall static pressure on the upper surface is lower than that on the lower surface, which is in line with Bernoulli's principle.
Compared to the original aerofoil, the aerofoils with flaps generate a greater pressure difference on the lower surface, indicating that the flap increases the lift of the aerofoil. The slotted flap has the lowest static pressure at the leading edge of the flap's upper surface.
AOA 0°
AOA 4°
AOA 8°
AOA 12°
AOA 16°
Original Aerofoil Downward Deflected Flap Slotted Flap
Figure 8: Pressure contour plots at angles of attack from 0-16 degrees
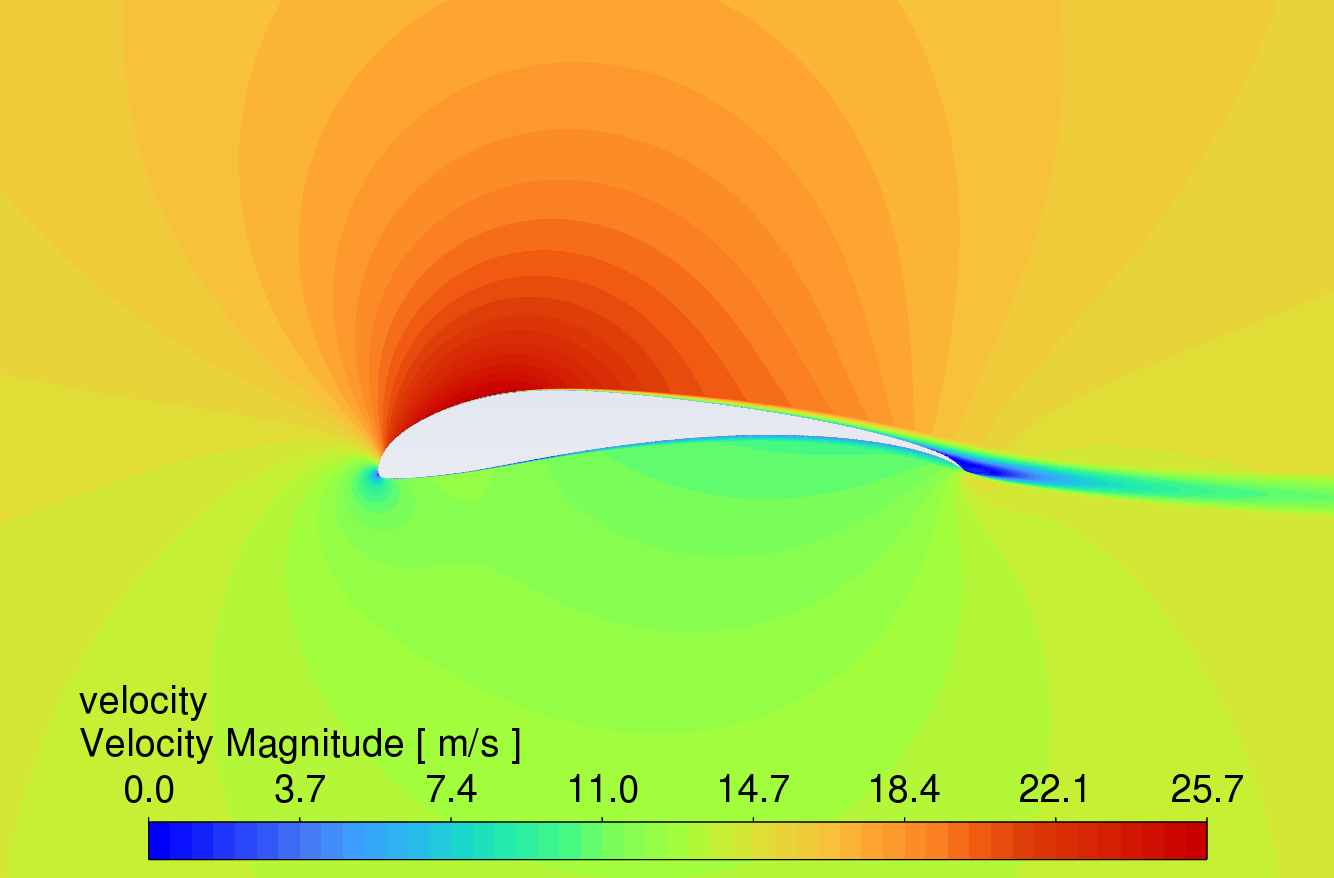
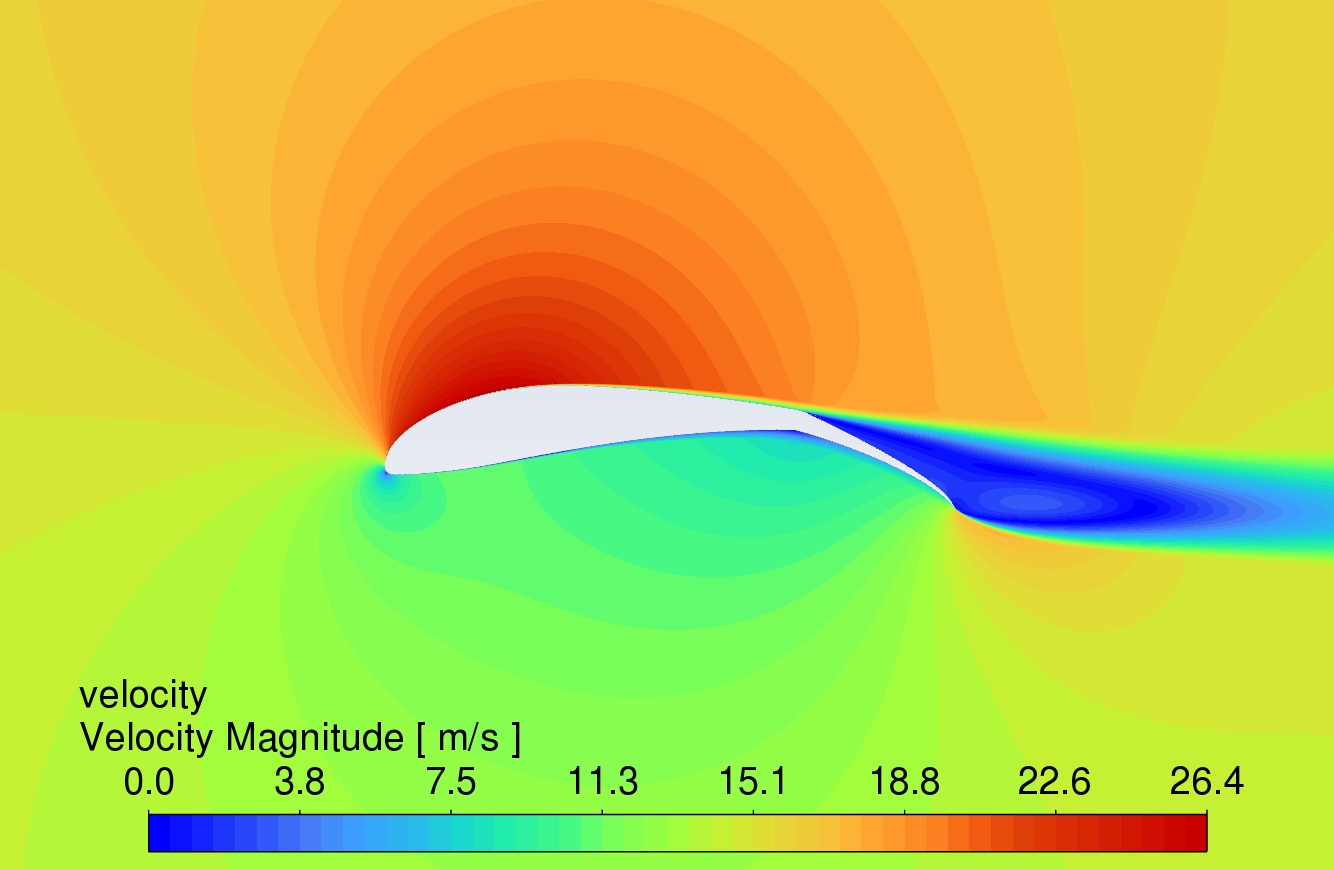
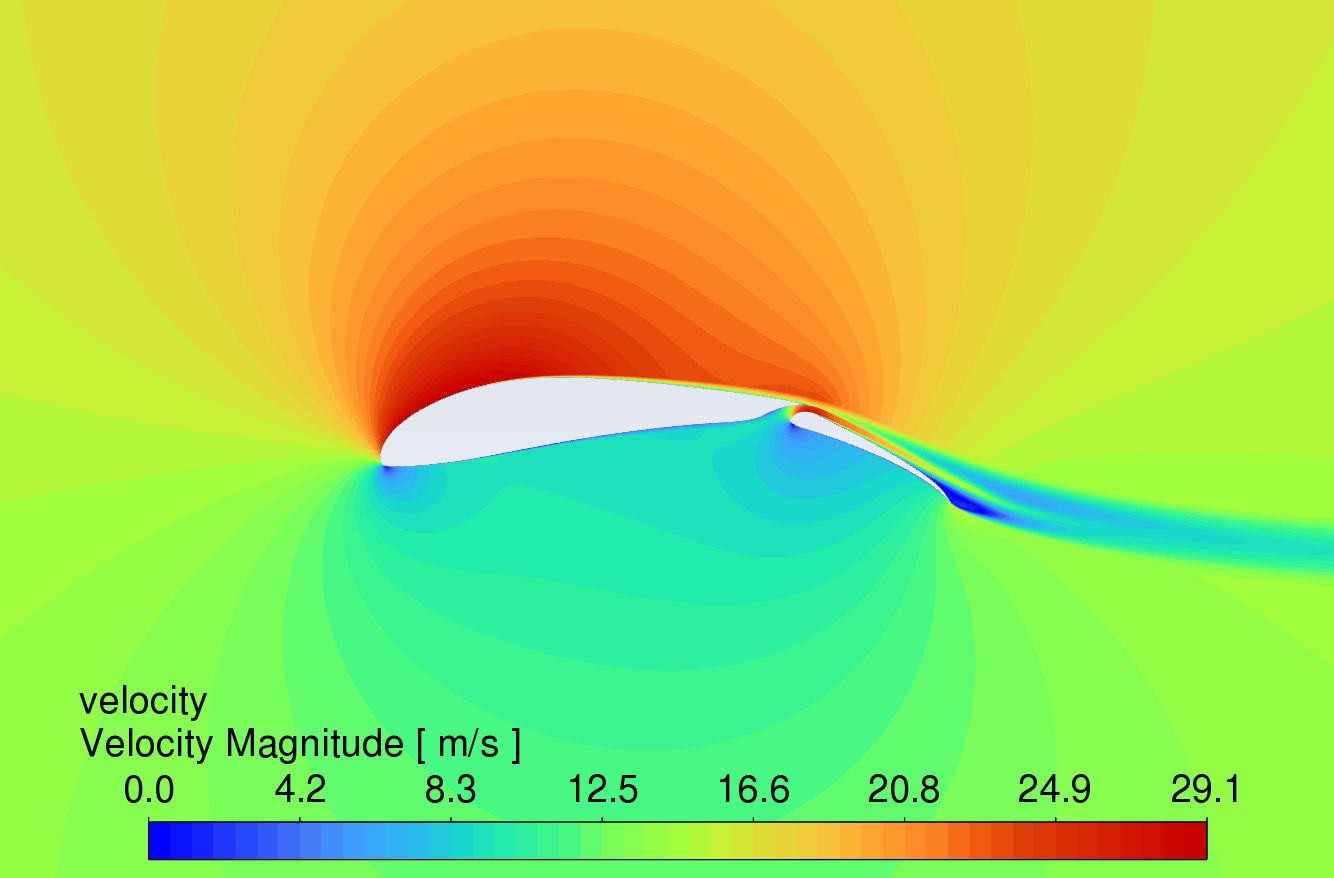
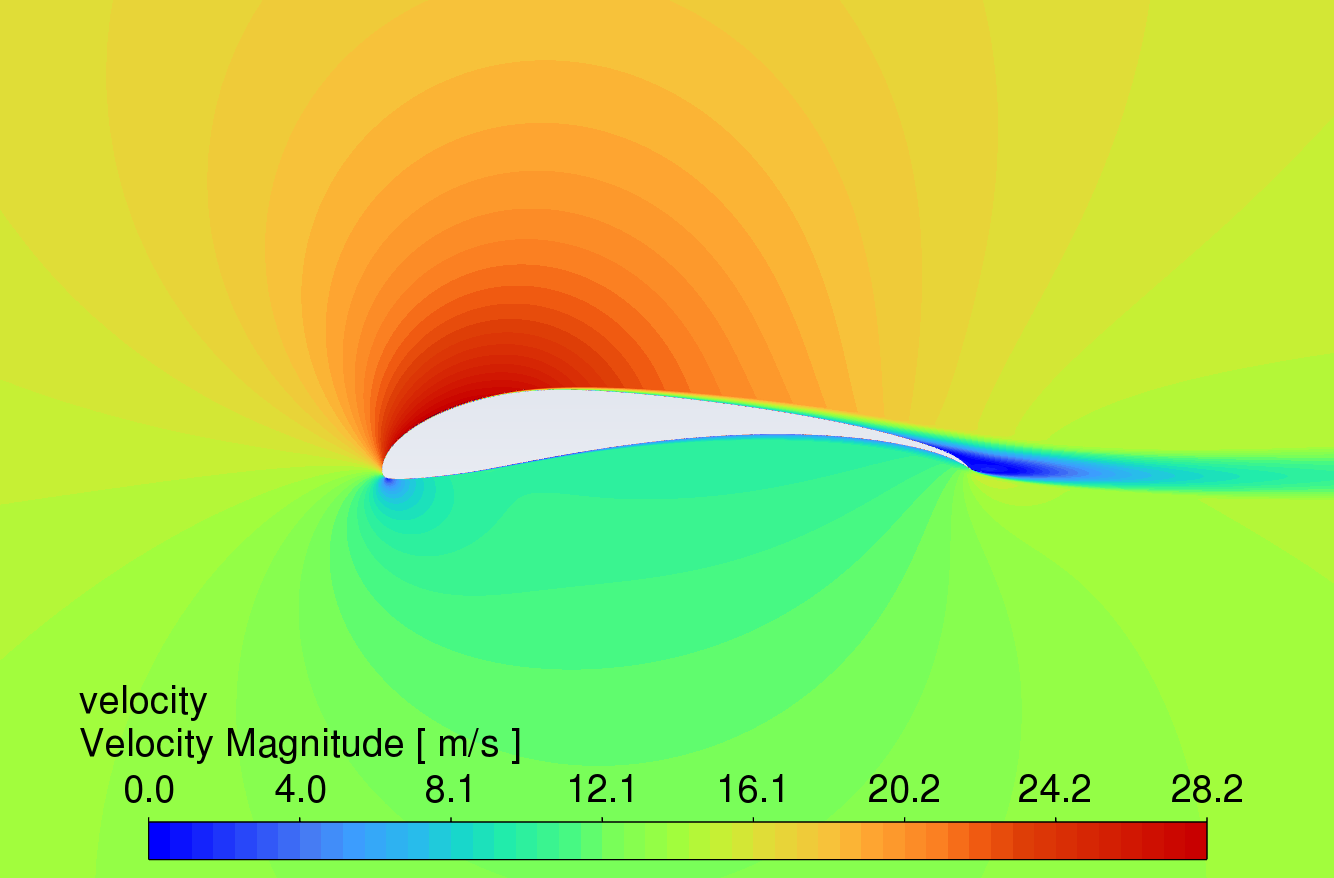
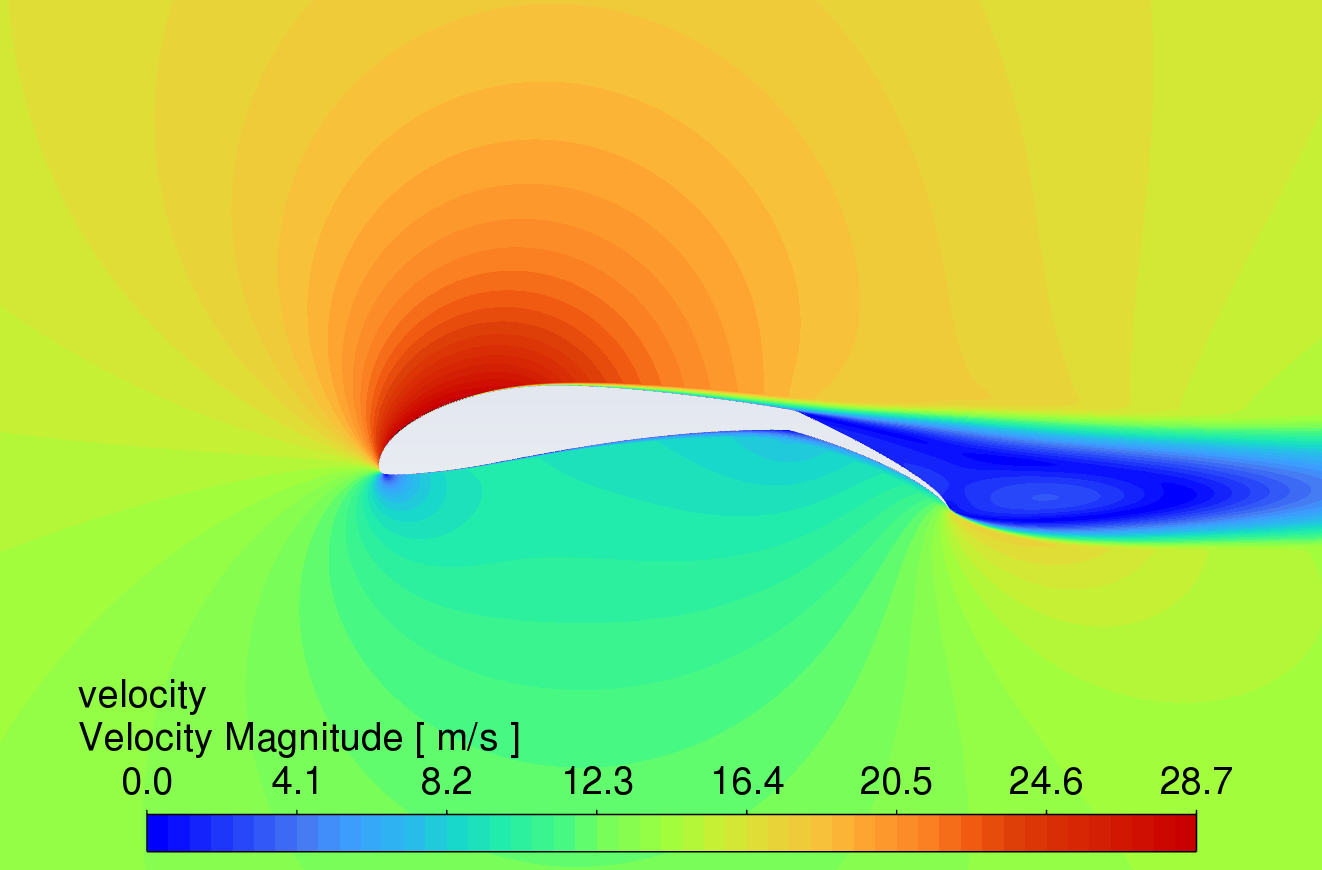
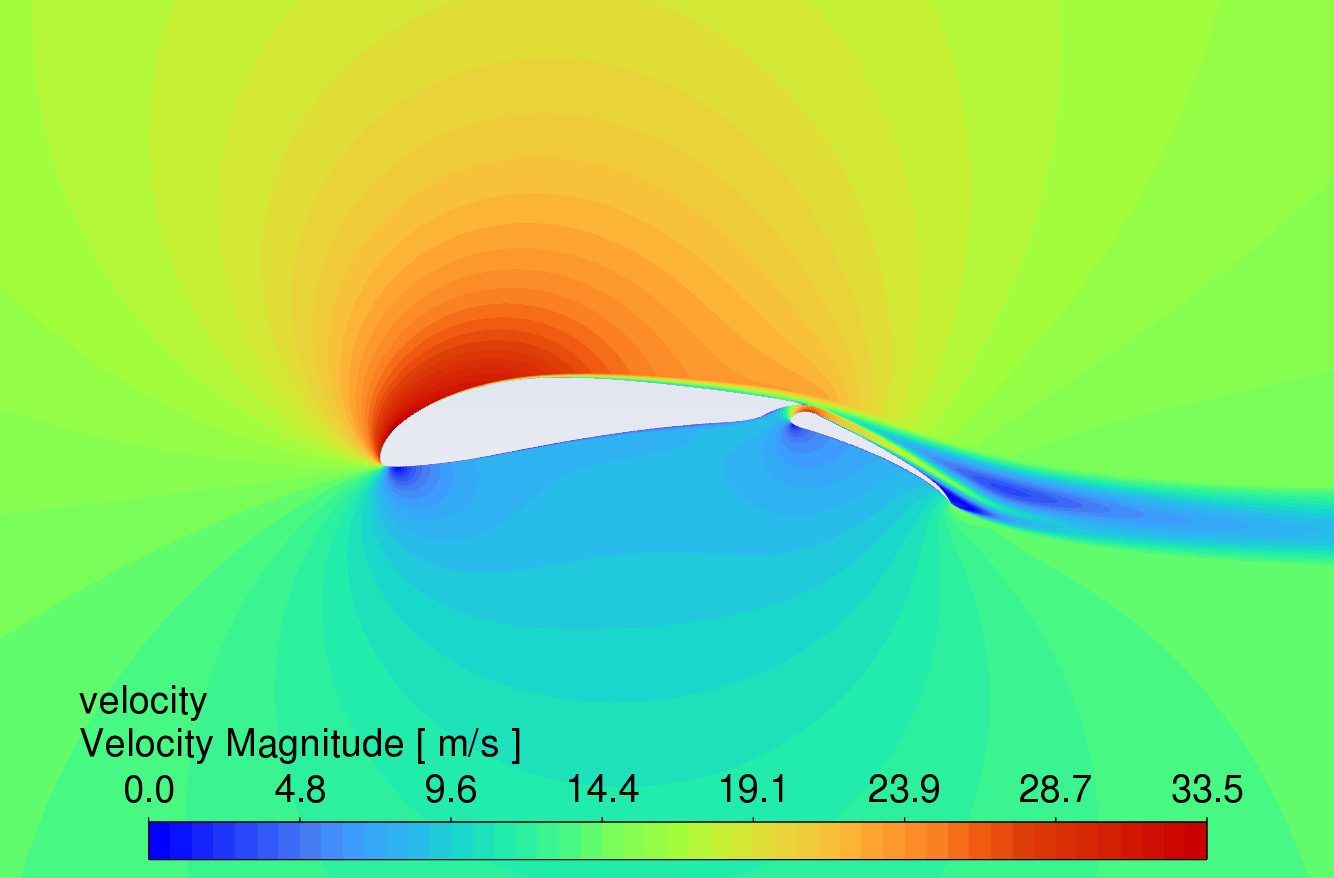
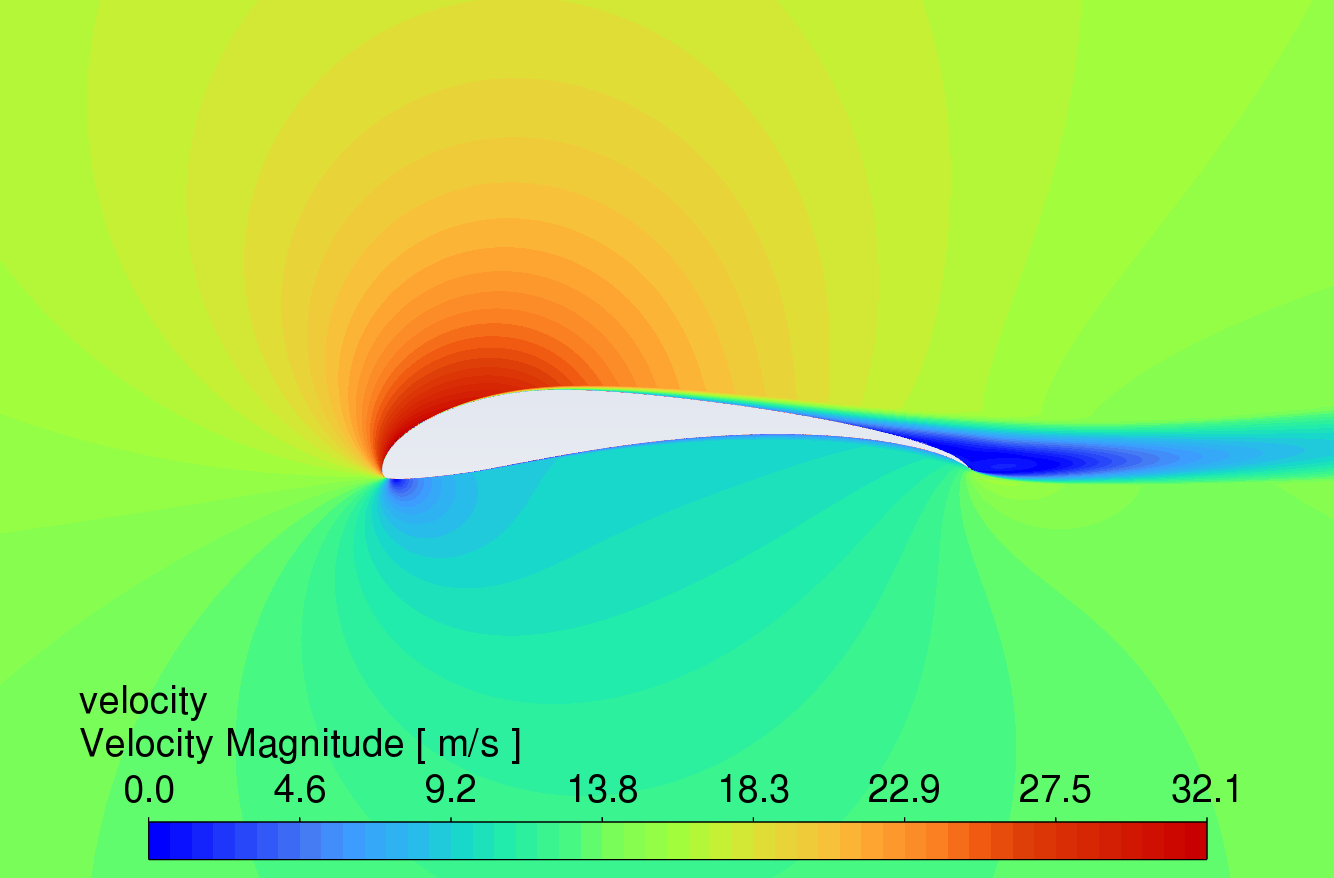
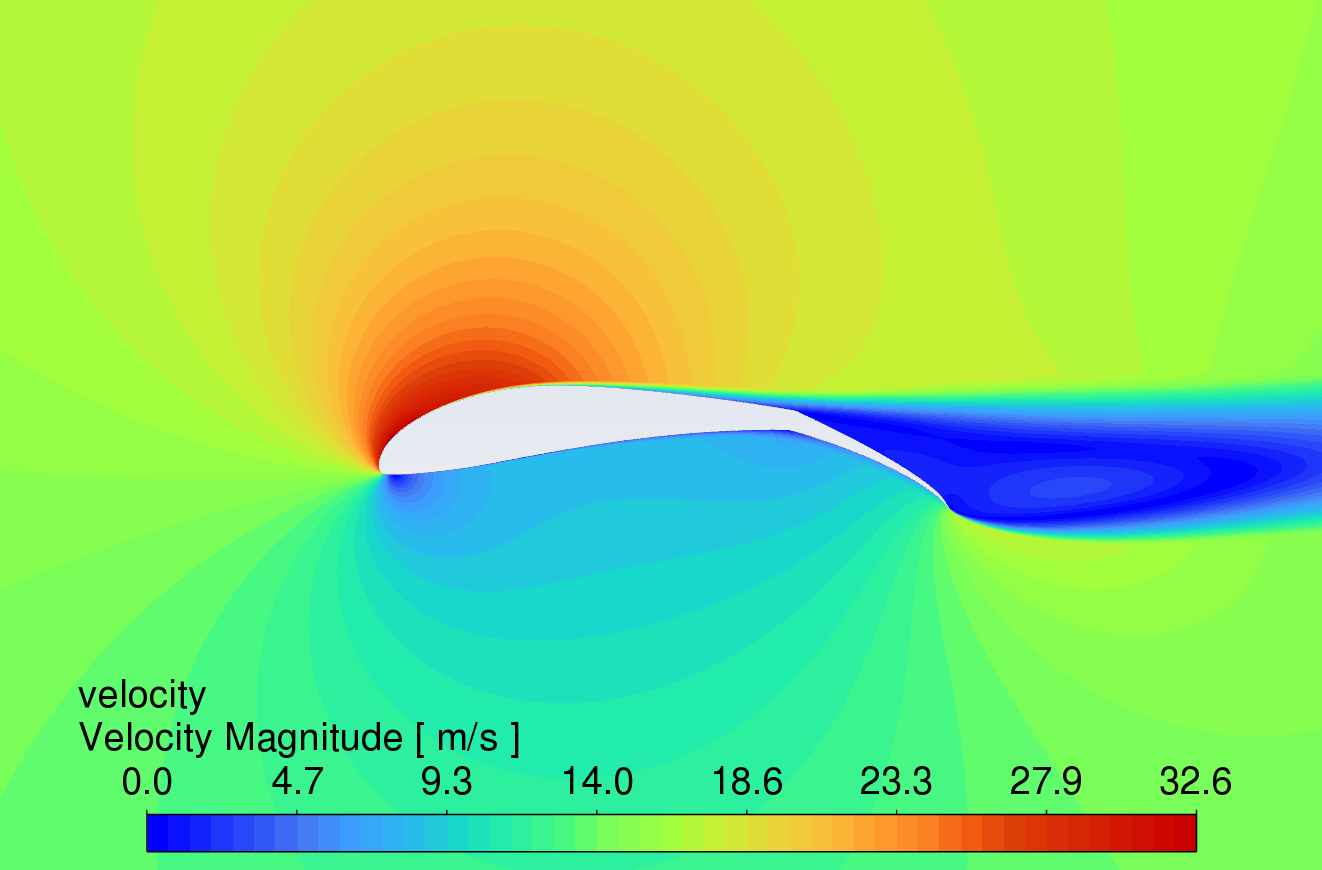
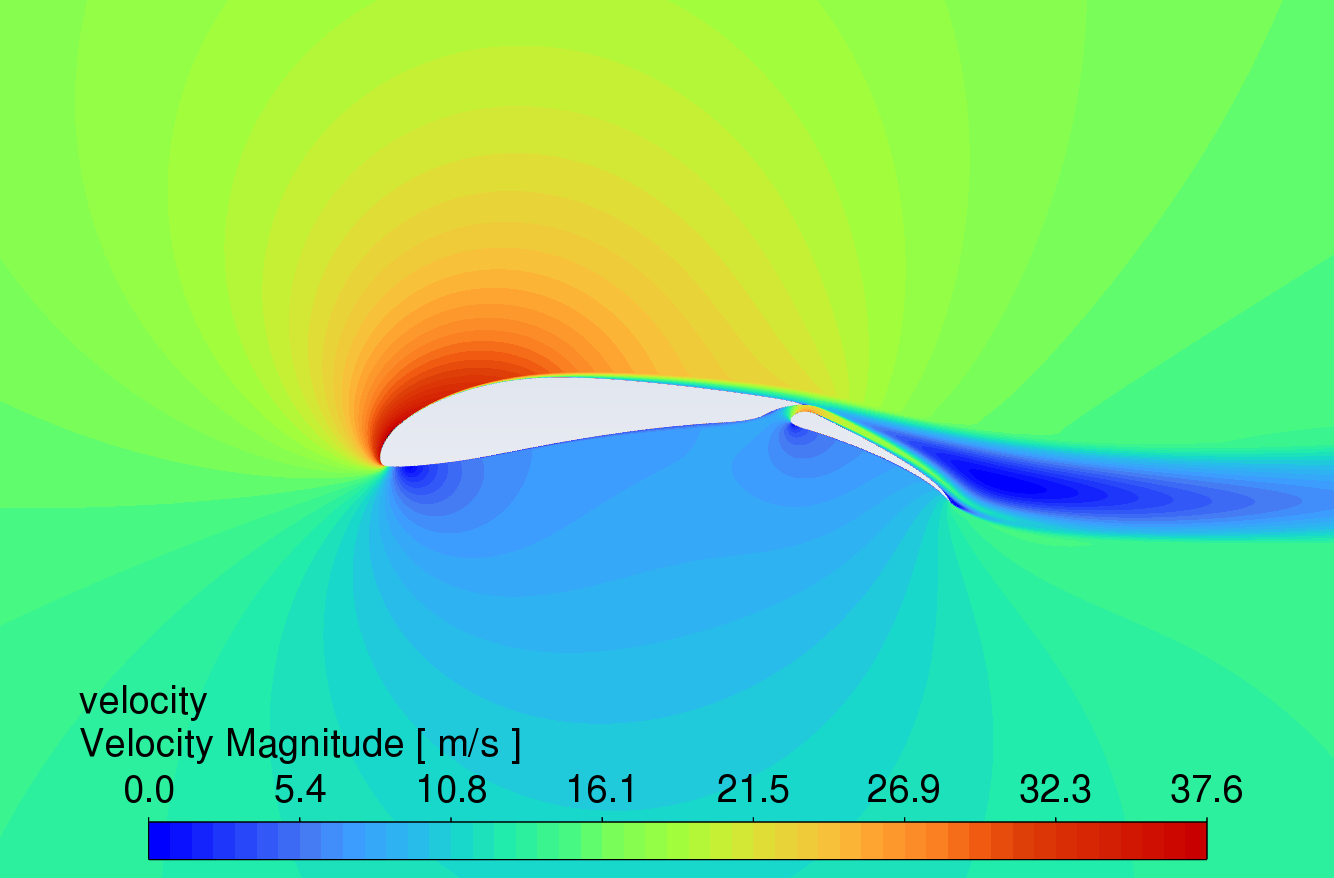
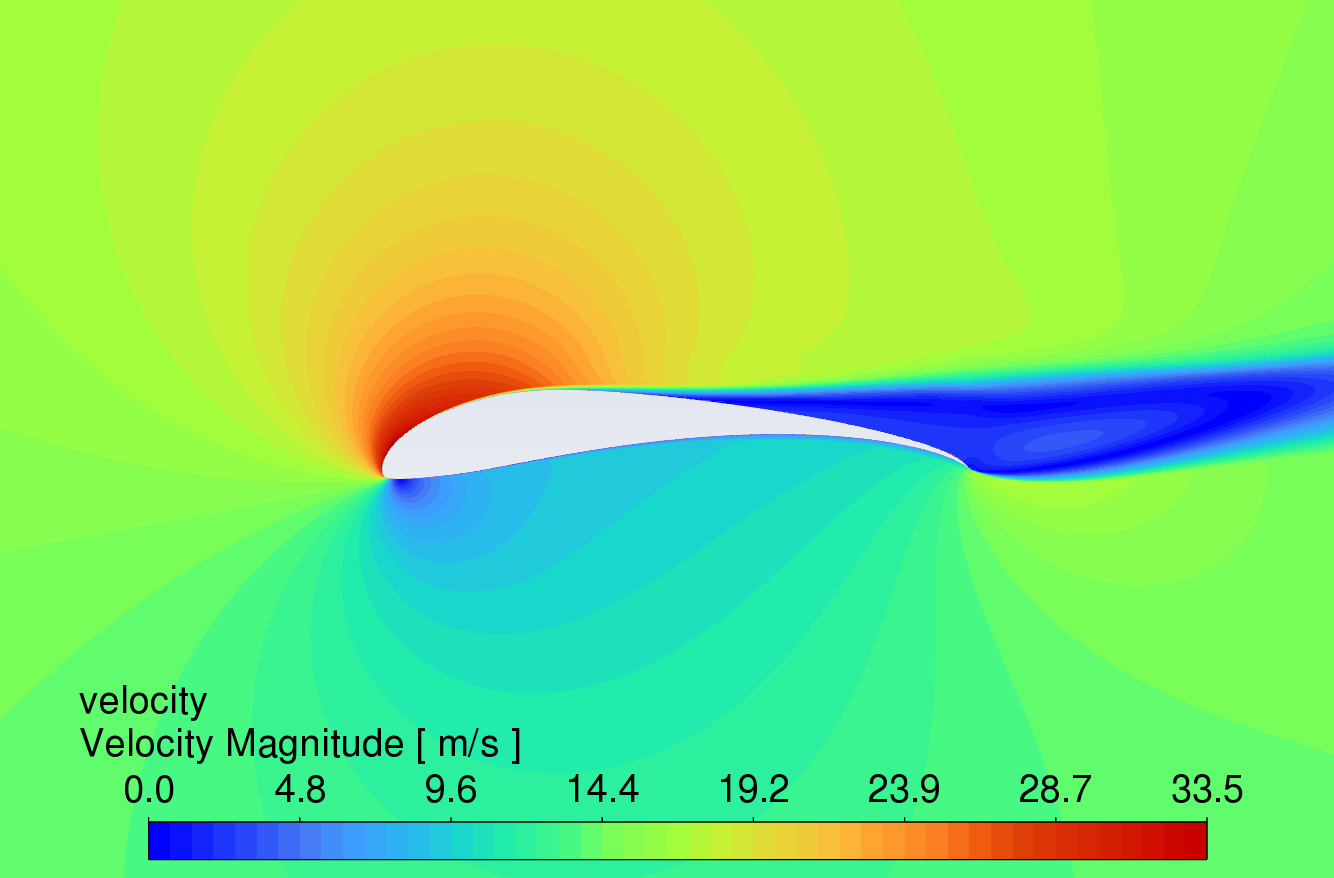
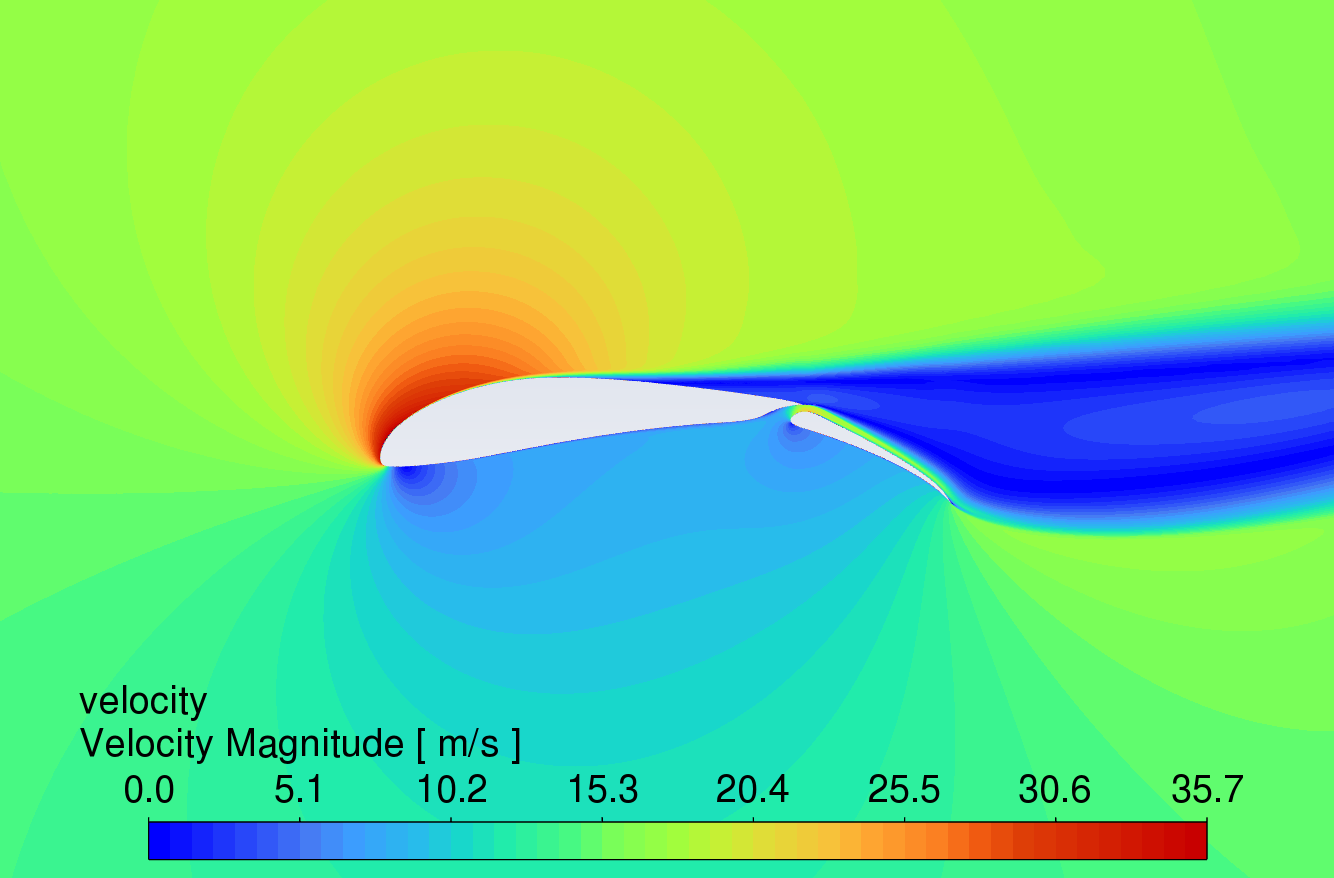
3.3. Velocity contour comparison at different angles of attack
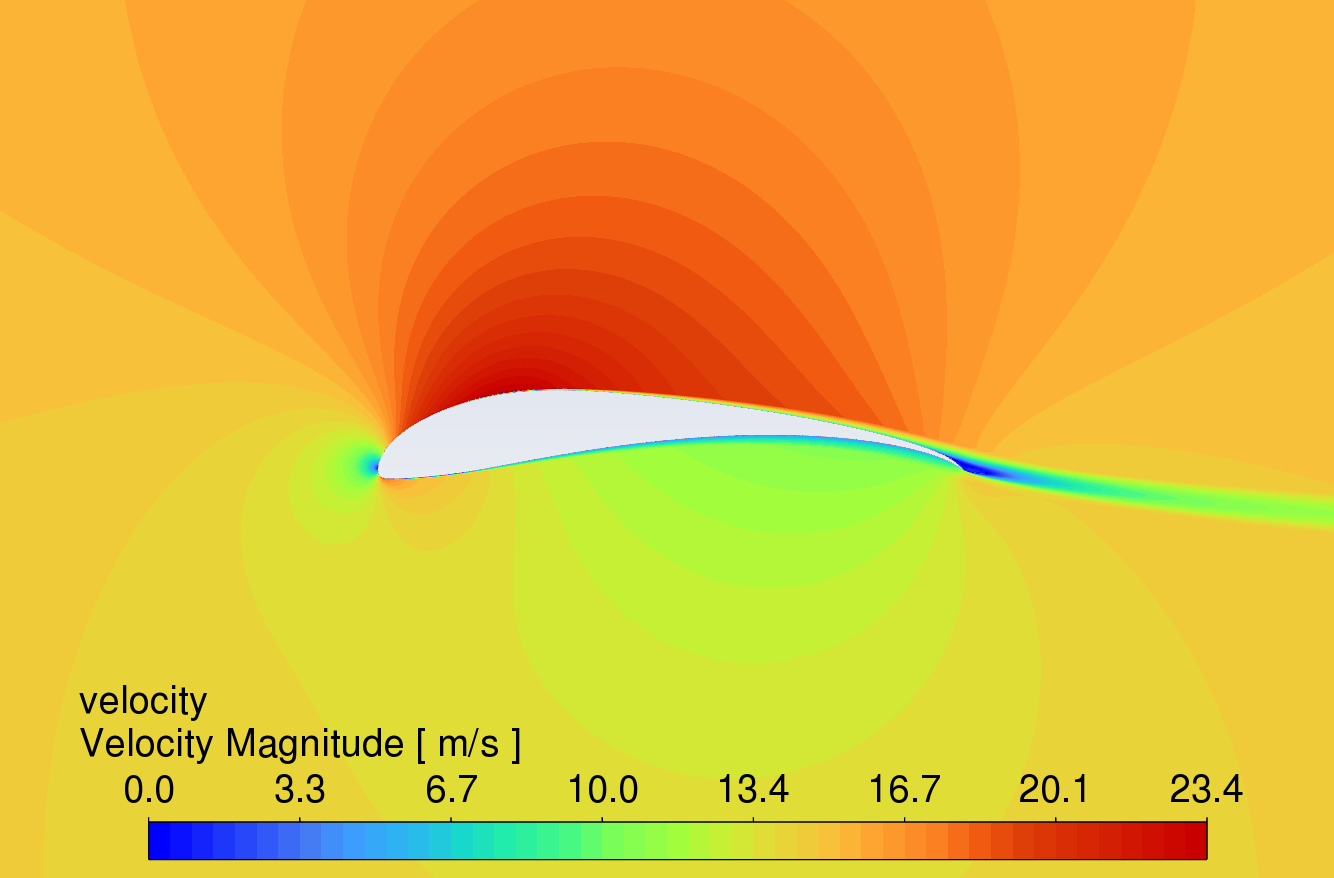
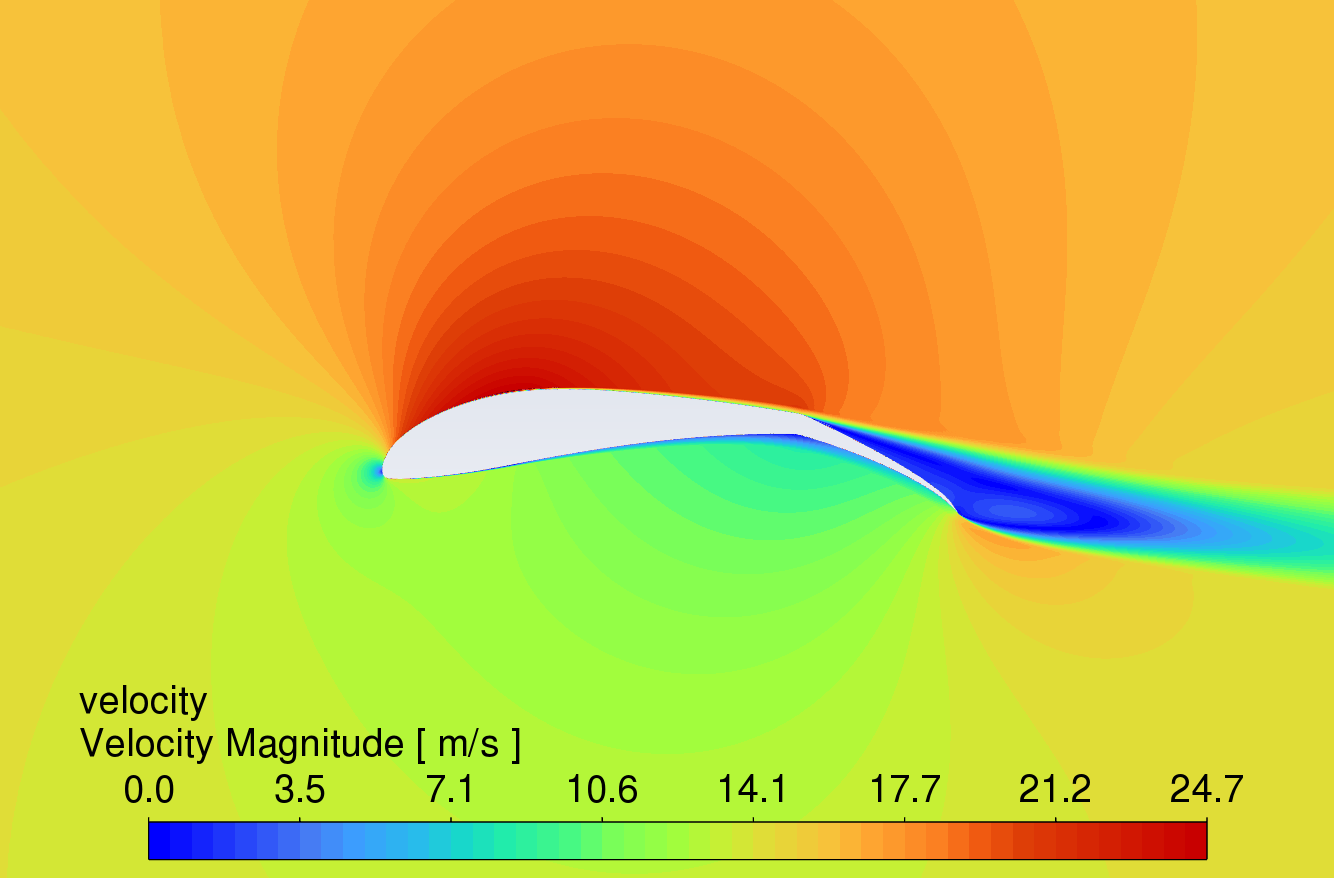
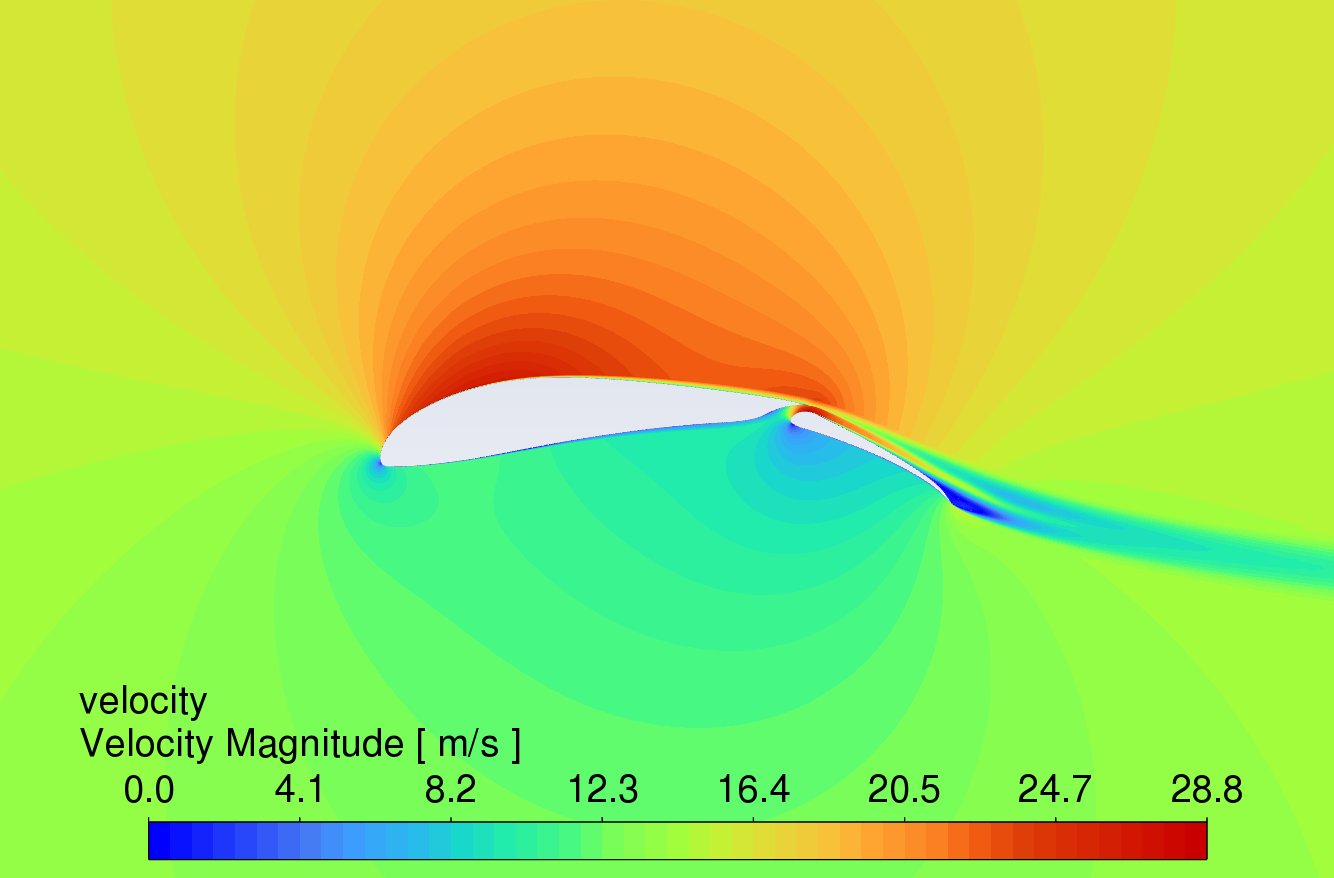
Figure 9 shows the velocity contour plots at AOA between 0° and 16°. The results reveal that the velocity of the airflow is greater on the upper surface compared to the lower surface. Due to the high lift characteristics of the S1223 aerofoil, the curved trailing edge reduces airflow velocity on the lower surface, thereby generating higher lift.
While the simple deflected flap can increase lift, flow separation occurs in the boundary layer on the upper surface near the trailing edge, causing drag to rise sharply. In contrast, the slotted flap redirects airflow from the lower surface to the upper surface of the flap, delaying flow separation [11]. This mechanism allows the slotted flap to generate more lift with less increase in drag. At an angle of attack of 16°, all three aerofoils show signs of stall, which correlates with the trends observed in the lift and drag coefficient characteristic curves in Figures 6 and 7.
AOA 0°
AOA 4°
AOA 8°
AOA 12°

AOA 16°
Original Aerofoil Downward Deflected Flap Slotted Flap
Figure 9: Velocity contour plots at AOA from 0-16 degrees
4. Conclusion
This paper simulates the S1223 aerofoil and aerofoils with added flaps and slotted flaps based on ANSYS Fluent. The aerodynamic properties of the aerofoil are analysed by comparing its lift and drag coefficients at various angles of attack, along with the pressure and velocity distribution within the flow field. The results of this investigation are described below:
(1) Increasing the downward deflection of flaps can improve the lift coefficient to a certain extent, but it will also increase the drag coefficient synchronously.
(2) The slotted flap has a higher lift coefficient than the flap that only deflects downwards, which may be because the airflow on the lower surface is guided to the upper surface of the flap through the slot, thereby delaying the separation of the boundary layer airflow on the upper surface of the flap.
(3) The downward deflection of flaps will increase the drag coefficient of the aerofoil, while the increase in drag of slotted flaps is relatively small.
(4) With an increasing angle of attack, the boundary layer on the upper surface of the S1223 aerofoil starts to separate from the trailing edge, leading to a gradual rise in the drag coefficient. In contrast, aerofoils with added flaps and slotted flaps show a more pronounced airflow separation at higher angles of attack, causing a quicker increase in the drag coefficient.
Therefore, based on the above investigation results, it is worth trying to adopt an increased lift structure based on the S1223 aerofoil, especially on smaller aircraft such as low-speed drones. Increasing the lift of the aerofoil can improve flight performance, including load capacity. For the shortcomings of current research, further research should consider:
(1) Conduct more simulations under different Reynolds number conditions to refine the research findings.
(2) Compare laterally with other similar high-lift aerofoils and validate the results concerning wind tunnel experiments.
References
[1]. Winslow, J., Otsuka, H., Govindarajan, B., & Chopra, I. (2017). Basic understanding of Airfoil characteristics at Low Reynolds numbers (104–105). Journal of Aircraft, 55(3), 1050–1061. https://doi.org/10.2514/1.c034415
[2]. Selig, M. S., & Guglielmo, J. J. (1997). High-lift low Reynolds number airfoil design. Journal of aircraft, 34(1), 72-79. https://doi.org/10.2514/2.2137
[3]. Mokhtar, W. (2005). A numerical parametric study of High-Lift Low Reynolds number airfoils. 43rd AIAA Aerospace Sciences Meeting and Exhibit. https://doi.org/10.2514/6.2005-1355
[4]. Traub, L. W., & Coffman, C. (2019). Efficient Low-Reynolds-Number airfoils. Journal of Aircraft, 56(5), 1987–2003. https://doi.org/10.2514/1.c035515
[5]. Boughou, N. S., Omar, N. a. A., Elsyed, N. O. A., & Aldheeb, N. M. (2022). Numerical investigations of aerodynamic characteristics Prediction of high-lift low Reynolds number Airfoil. CFD Letters, 14(2), 111–121. https://doi.org/10.37934/cfdl.14.2.111121
[6]. Zohary, A. C., Asrar, W., & Aldheeb, M. (2021). Numerical investigation on the pressure drag of some Low-Speed airfoils for UAV application. CFD Letters, 13(2), 29–48. https://doi.org/10.37934/cfdl.13.2.2948
[7]. Zu Hongya, Li Chun, Li Runjie, et al. (2015). Influence of relative length of flaps on aerodynamic performance of airfoils. Journal of Power Engineering, 35 (08): 666-673+692
[8]. Han Zhanzhong, Wang Jing, Lan Xiaoping. (2004). FLUENT Fluid Engineering Simulation Calculation Example and Application. Beijing Institute of Technology Press
[9]. Duque, E., Van Dam, C., & Hughes, S. (1999). Navier-Stokes simulations of the NREL Combined Experiment Phase II rotor. 37th Aerospace Sciences Meeting and Exhibit. https://doi.org/10.2514/6.1999-37
[10]. Wu Ziniu. (2001). Basic Principles of Computational Fluid Dynamics. Beijing Science Press.
[11]. Mueller, Thomas J. (1985). The influence of laminar separation and transition on low Reynolds number airfoil hysteresis. Journal of aircraft, 763-770.
Cite this article
Tang,C. (2025). The Influence of Trailing Edge Flaps on the Aerodynamic Characteristics of S1223 Aerofoil. Applied and Computational Engineering,130,93-101.
Data availability
The datasets used and/or analyzed during the current study will be available from the authors upon reasonable request.
Disclaimer/Publisher's Note
The statements, opinions and data contained in all publications are solely those of the individual author(s) and contributor(s) and not of EWA Publishing and/or the editor(s). EWA Publishing and/or the editor(s) disclaim responsibility for any injury to people or property resulting from any ideas, methods, instructions or products referred to in the content.
About volume
Volume title: Proceedings of the 5th International Conference on Materials Chemistry and Environmental Engineering
© 2024 by the author(s). Licensee EWA Publishing, Oxford, UK. This article is an open access article distributed under the terms and
conditions of the Creative Commons Attribution (CC BY) license. Authors who
publish this series agree to the following terms:
1. Authors retain copyright and grant the series right of first publication with the work simultaneously licensed under a Creative Commons
Attribution License that allows others to share the work with an acknowledgment of the work's authorship and initial publication in this
series.
2. Authors are able to enter into separate, additional contractual arrangements for the non-exclusive distribution of the series's published
version of the work (e.g., post it to an institutional repository or publish it in a book), with an acknowledgment of its initial
publication in this series.
3. Authors are permitted and encouraged to post their work online (e.g., in institutional repositories or on their website) prior to and
during the submission process, as it can lead to productive exchanges, as well as earlier and greater citation of published work (See
Open access policy for details).
References
[1]. Winslow, J., Otsuka, H., Govindarajan, B., & Chopra, I. (2017). Basic understanding of Airfoil characteristics at Low Reynolds numbers (104–105). Journal of Aircraft, 55(3), 1050–1061. https://doi.org/10.2514/1.c034415
[2]. Selig, M. S., & Guglielmo, J. J. (1997). High-lift low Reynolds number airfoil design. Journal of aircraft, 34(1), 72-79. https://doi.org/10.2514/2.2137
[3]. Mokhtar, W. (2005). A numerical parametric study of High-Lift Low Reynolds number airfoils. 43rd AIAA Aerospace Sciences Meeting and Exhibit. https://doi.org/10.2514/6.2005-1355
[4]. Traub, L. W., & Coffman, C. (2019). Efficient Low-Reynolds-Number airfoils. Journal of Aircraft, 56(5), 1987–2003. https://doi.org/10.2514/1.c035515
[5]. Boughou, N. S., Omar, N. a. A., Elsyed, N. O. A., & Aldheeb, N. M. (2022). Numerical investigations of aerodynamic characteristics Prediction of high-lift low Reynolds number Airfoil. CFD Letters, 14(2), 111–121. https://doi.org/10.37934/cfdl.14.2.111121
[6]. Zohary, A. C., Asrar, W., & Aldheeb, M. (2021). Numerical investigation on the pressure drag of some Low-Speed airfoils for UAV application. CFD Letters, 13(2), 29–48. https://doi.org/10.37934/cfdl.13.2.2948
[7]. Zu Hongya, Li Chun, Li Runjie, et al. (2015). Influence of relative length of flaps on aerodynamic performance of airfoils. Journal of Power Engineering, 35 (08): 666-673+692
[8]. Han Zhanzhong, Wang Jing, Lan Xiaoping. (2004). FLUENT Fluid Engineering Simulation Calculation Example and Application. Beijing Institute of Technology Press
[9]. Duque, E., Van Dam, C., & Hughes, S. (1999). Navier-Stokes simulations of the NREL Combined Experiment Phase II rotor. 37th Aerospace Sciences Meeting and Exhibit. https://doi.org/10.2514/6.1999-37
[10]. Wu Ziniu. (2001). Basic Principles of Computational Fluid Dynamics. Beijing Science Press.
[11]. Mueller, Thomas J. (1985). The influence of laminar separation and transition on low Reynolds number airfoil hysteresis. Journal of aircraft, 763-770.