


1. Introduction
The aerofoil is a key concept in aeronautical engineering, which is defined as the geometric shape and curvature of the aeroplane wing section under specific conditions. The aerofoil is an important factor affecting the aerodynamic performance of an aircraft, as it has been found through previous studies that the lift and drag on the aerofoil will change with the change of the aerofoil shape and angle of attack. The shape of the cross-section of the wing determines the relationship between these aerodynamic forces and the angle of attack, thereby determining the performance of the wing. This means that aerofoil sections with various cross-section shapes have various aerodynamic performance characteristics. An effective aerofoil design enhances aircraft lift and efficiency while reducing flight resistance, thus boosting overall performance. Therefore, the optimization and selection of aerofoils have important significance in aeronautical engineering. The NACA aerofoil is a series of classic aerofoils proposed by the National Advisory Committee for Aeronautics (NACA) in the mid-20th century, which is widely used in academic research and engineering practice due to its clear design concept, concise parameter expression [1]. The four-digit aerofoil is defined by a series of four-digit numbers after the word "NACA" to memorize the cross-sectional profile. In this type of aerofoil, the first digit indicates the percentage of the maximum curvature about the chord length; the second digit specifies the relative distance from the leading edge to the point of maximum curvature, measured in tenths of the chord length; and the last two digits represent the maximum thickness of the aerofoil as a fraction of the chord length. The swift advancement of computational fluid dynamics (CFD) has enabled detailed numerical analysis of aerofoil aerodynamic characteristics via numerical simulation, allowing for a comprehensive performance evaluation of the aerofoil during the design stage [2].
Pritam Saha et al. conducted a comparative study of the aerodynamic characteristics of NACA 2312 and NACA 2412 aerofoils at Re = 2.74×10⁶ [3]. Vishal Nizama et al. conducted a numerical simulation to compare the aerodynamic performance of NACA 0012 and NACA 2412 at low Reynolds number [4]. Maria et al. numerically simulated the wing flow characteristics of NACA 0012 and NACA 4412 under Re = 170000 [5]. Subash Dhakal et al. numerically studied the aerodynamic performance of NACA 4412 and NACA 23012 [6].
Aerofoil design is not only the choice of geometric shape but also the result of comprehensive consideration of aerodynamic performance. Aerodynamic characteristics, such as lift coefficient, drag coefficient and stall characteristics, will significantly affect the performance of aircraft during flight [7]. The study of aerodynamic characteristics of different aerofoils, especially combined with numerical simulation and experimental methods, can provide a scientific basis and data support for aerofoil optimization. Based on ANSYS Fluent fluid simulation software, this paper systematically compares the aerodynamic characteristics of NACA 2412 and NACA 4412 aerofoils at low Reynolds numbers (Re = 4×10⁶) and analyses the specific performance of the two aerofoils from 0° to 20° Angle of attack. This analysis can provide references for different types of aircraft in wing optimization design, new aerofoil development and testing, and other aerodynamic modelling fields related to these aerofoils.
2. Numerical Model
2.1. Geometric Models and Computational Domains
The NACA 2412 and NACA 4412 aerofoils serve as the primary objects of study in this paper. Set the chord length of each aerofoil to 1m. By obtaining the aerofoil geometric coordinates (200 coordinate nodes) from the aerofoil database and importing them into Fluent, the geometric shapes for CFD simulation are created, as displayed in Figure 1.
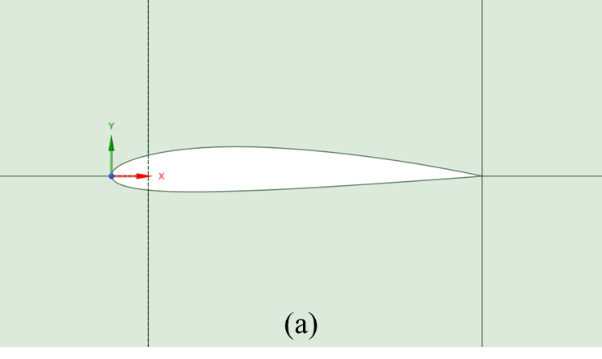
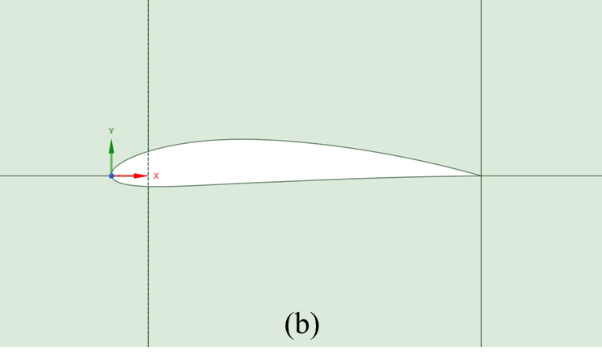
Figure 1: Geometric model: (a) NACA 2412, (b) NACA 4412
Figure 2 illustrates the computational domains used for simulation. Since the computational domains are the same, this article only shows the computational domains for the NACA 2412 aerofoil. The aerofoil with a chord length of 1m is placed in this area, the diameter of the semi-circular section is 10 m, and the rectangular section has a side length of 10 m as well. The aerofoil chord line overlaps with the horizontal axis of the region, and the centre of the circle of the semicircular region of the computational domain is located at the 16.5% chord distance from the leading edge. Both the inlet and outlet segments are open boundaries, which are set as a velocity inlet and a pressure outlet, respectively. With the initial angle of attack set at α = 0°, the inlet flow velocity reaches 58.429 m/s.
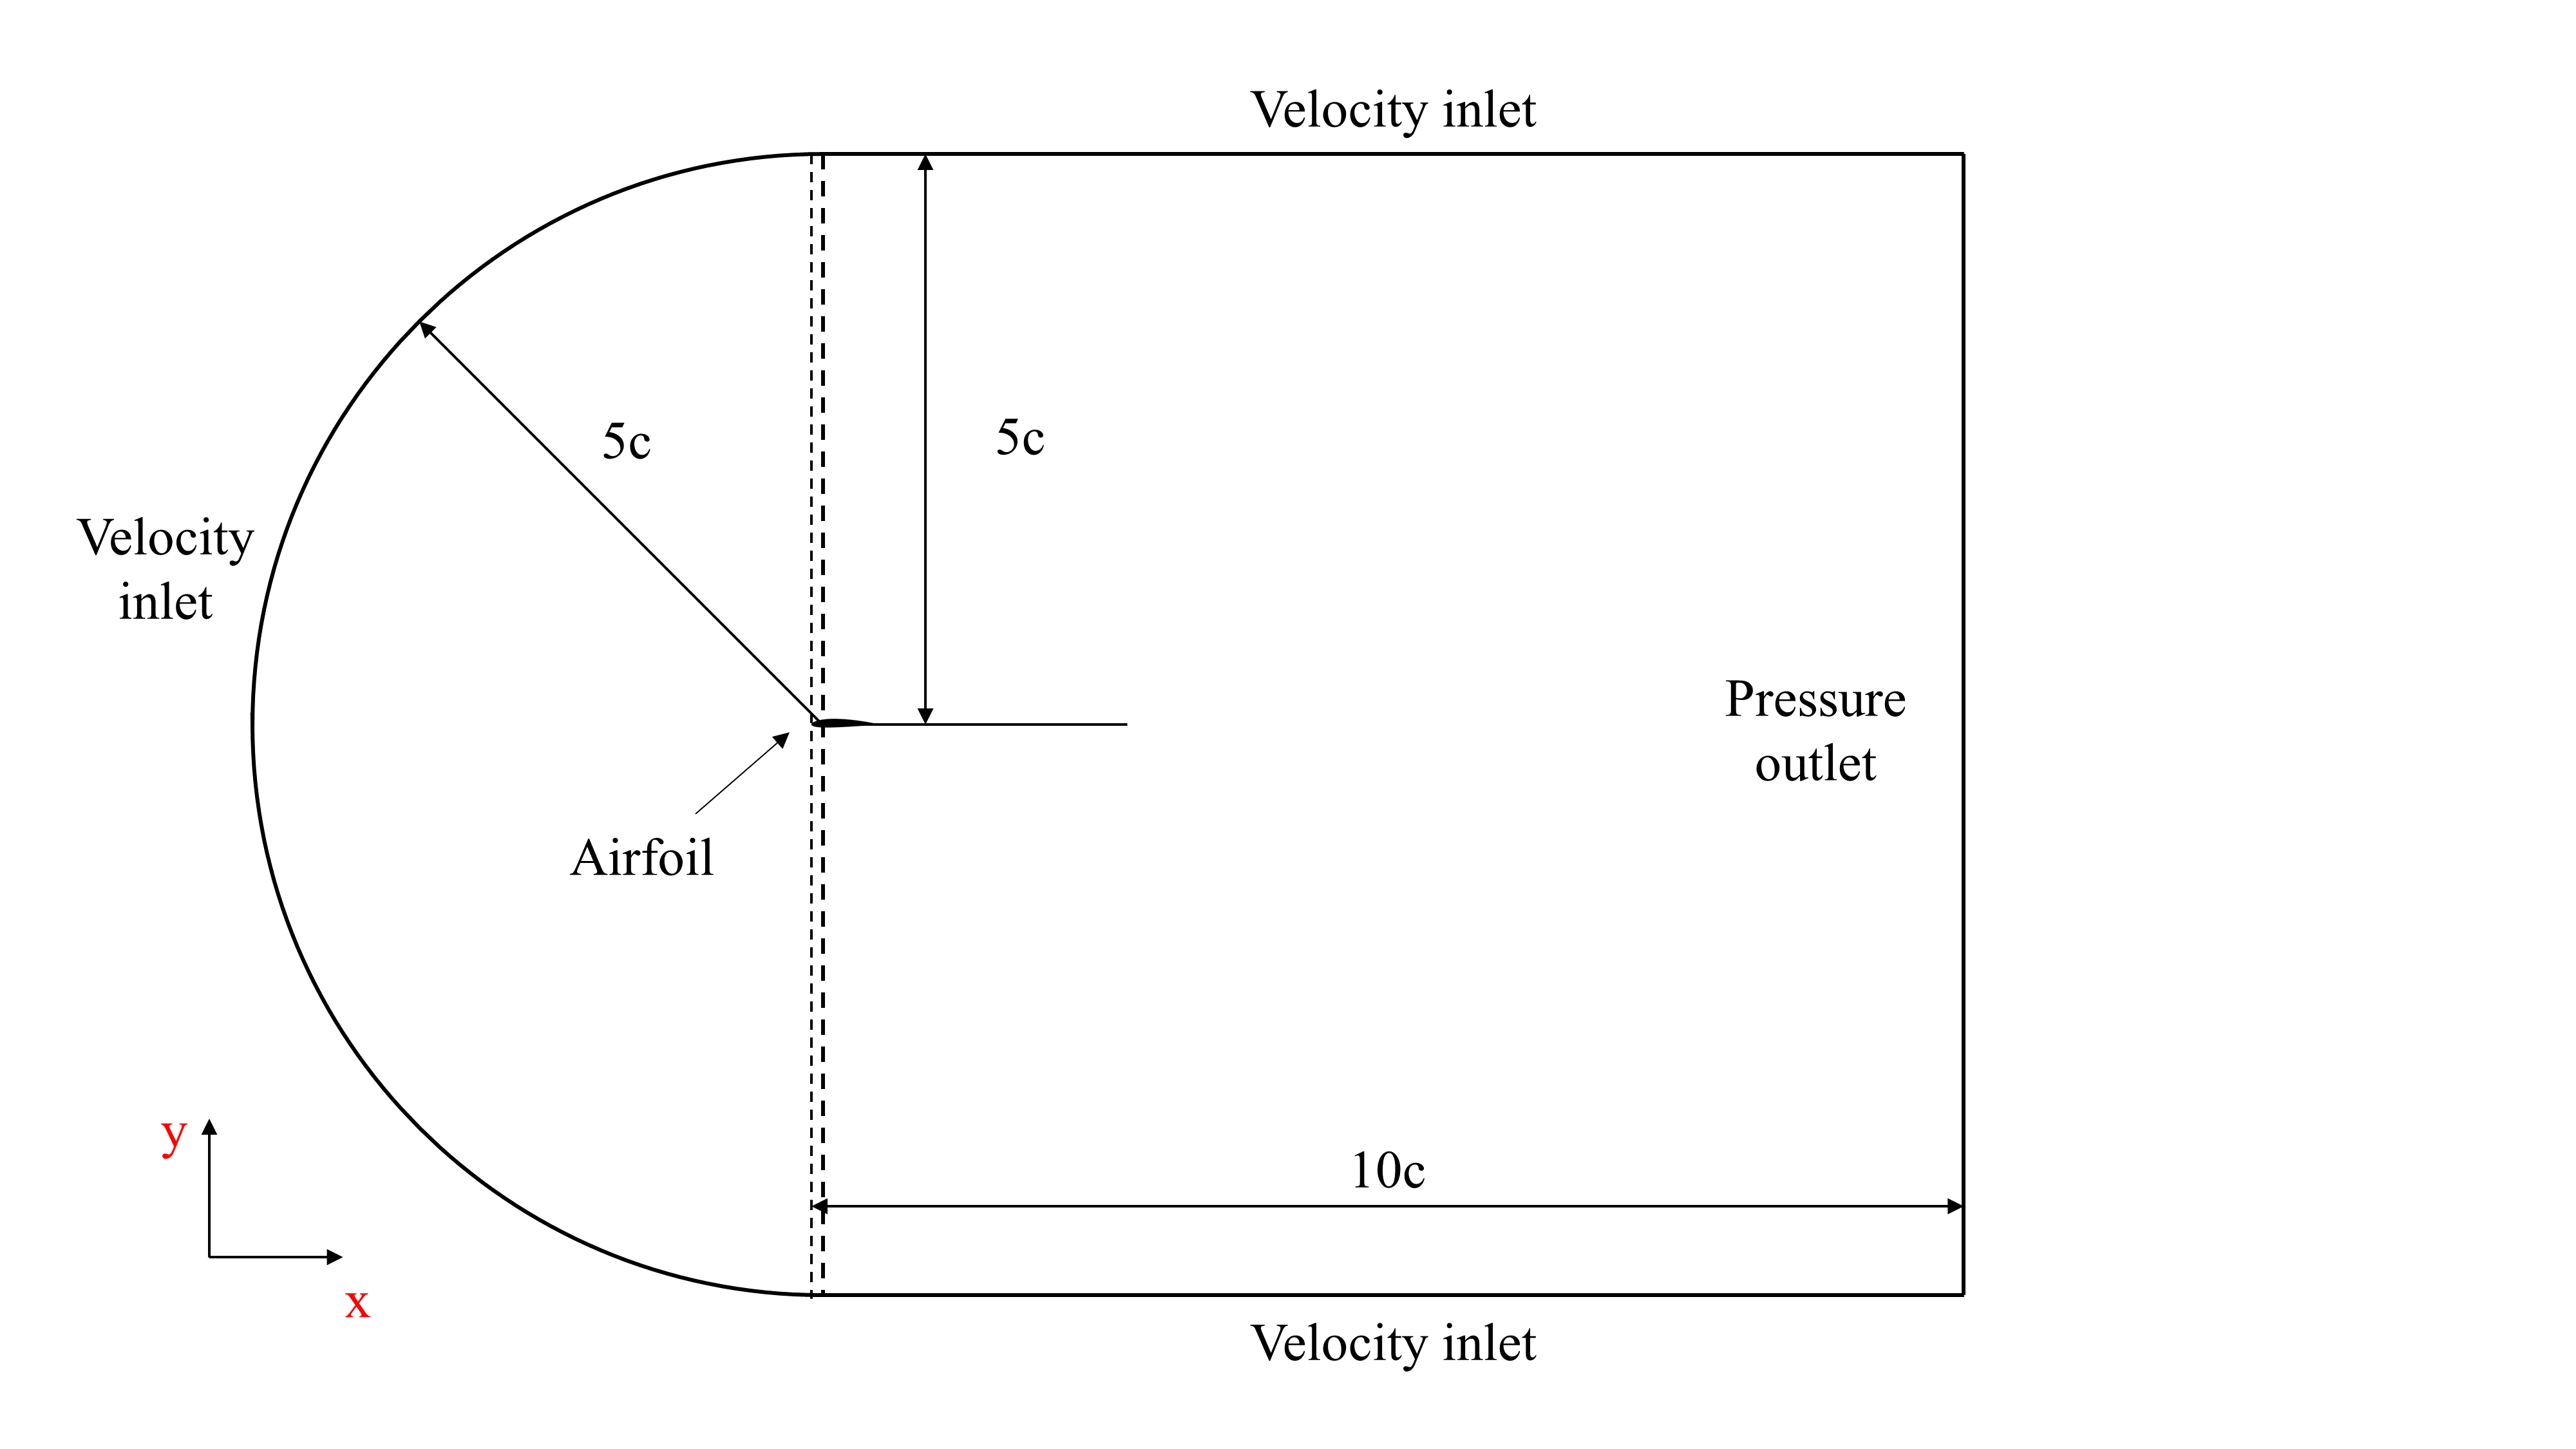
Figure 2: Computational domain
2.2. Grid domain generation
The grid division of the computing domain is shown in Figure 3. In this paper, the 2D structured mesh is selected to generate the mesh for the aerofoil and computation domain. To better simulate the flow field motion, the "C" type computation domain is used in the computation domain, and the computation domain is divided into 6 subdomains. To optimize computing efficiency and reduce computing cost, the outer domain adopts coarser cell side lengths for grid processing. A fine mesh is used around the aerofoil to better reflect the airflow movement.
The level of mesh division quality will directly affect the accuracy of numerical results. The mesh quality in this study is evaluated by its orthogonal mass coefficient, which is an important index of mesh quality. The closer the value is to 1, the more uniform the mesh element size and shape, and the better the mesh quality. According to statistics, the average orthogonal mass coefficient of the NACA 2412 calculation domain grid is 0.98, and the average orthogonal mass coefficient of the NACA 4412 calculation domain grid is 0.98, so the grid quality of the two is better. In addition, the local grid details around the aerofoil of NACA 2412 and NACA 4412 are shown in Figure 4.
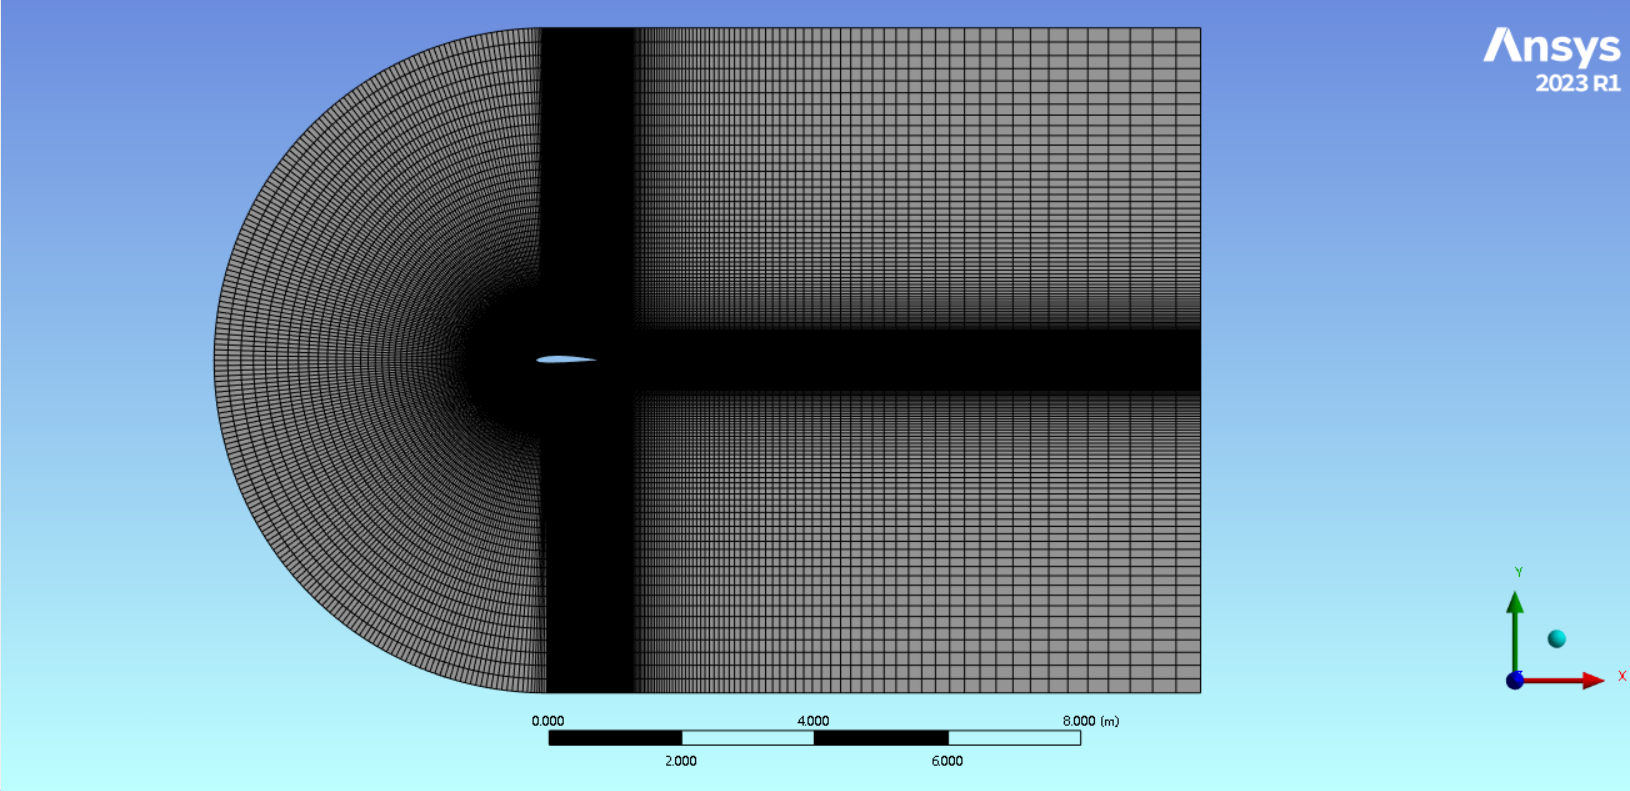
Figure 3: Calculation domain grid (taking NACA 2412 as an example)
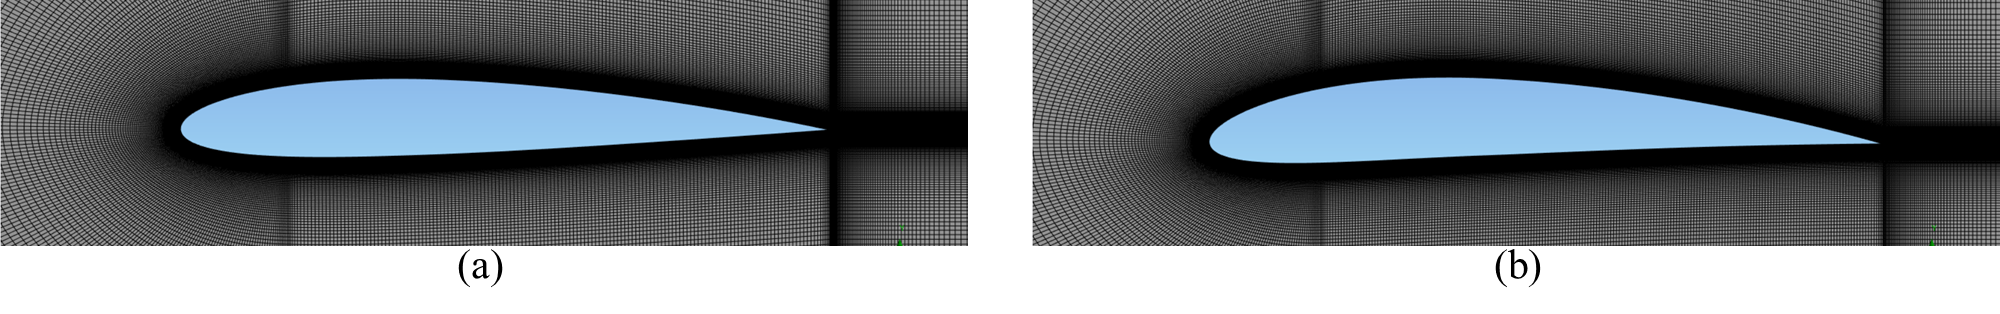
Figure 4: Local details: (a) NACA 2412, (b) NACA 4412
2.3. Boundary conditions
Boundary conditions refer to the characteristic physical properties or conditions on the surface of a region that represent a specific flow variable of a physical model. To obtain accurate numerical results, this paper sets 1000 iterations and 10-6 iteration errors during CFD simulation to ensure the convergence of results. Detailed specifications for the boundary conditions of the simulation can be found in Table 1.
Table 1: Boundary conditions
Input parameter | Parameter value |
solver | Pressure base solver |
Viscous model | SST k-ω |
stress | second order |
gradient | Least squares unit |
Turbulent viscosity | First order upwind |
momentum | Second order upwind |
Dynamic viscosity | 1.7894×10⁻⁵ kg/(m s) |
Inlet velocity | 58.429 m/s |
Fluid density | 1.225 kg/m3 |
Turbulence intensity | 5% |
Turbulent viscosity ratio | 10 |
Reynolds number | 4×10⁶ |
Chord length | 1 m |
Number of iterations | 1000 |
Residual error | 1e-6 |
The basic governing equations used in this paper are the incompressible continuity equation, Navier-Strokes equation and SST k-ω turbulence model equation.
The continuity equation used in this paper is as follows:
\( \frac{∂ρ}{∂t}+∇\cdot (ρ\vec{V})=0 \) (1)
The Navier-Strokes equation used in this paper is as follows:
\( \frac{∂}{∂t}(ρ\vec{V})+∇\cdot (ρ\vec{V}\vec{V})=-∇p+∇\cdot (\bar{\bar{r}})+ρ\vec{g}+\vec{F} \) (2)
The turbulence model is a mathematical model to predicts the effect of turbulence on aerofoil, which is a two-equation turbulence model. This equation involves two variables, with k being the kinetic energy and ω being the specific dissipation rate. The shear-stress transport model (SST k-ω model) adopted in this paper is an improved version of the k-w model, which is widely used because it considers the transfer of turbulent shear stress more than before in the definition of turbulent viscosity [8, 9]. The relevant turbulent viscosity is modelled as follows:
Kinematic eddy viscosity:
\( {ν_{t}}=\frac{{a_{1}}k}{max({a_{1}}ω; Ω{F_{2}})} \) (3)
\( {F_{2}}=tan\lbrace {[max(\frac{2\sqrt[]{k}}{{β^{*}}ωy},\frac{500ν}{{y^{2}}ω})]^{2}}\rbrace \) (4)
Turbulence kinetic energy:
\( \frac{∂k}{∂t}+{U_{j}}\frac{∂k}{∂{x_{j}}}=min({τ_{ij}}\frac{∂{U_{i}}}{∂{x_{j}}},10{β^{*}}kω)-{β^{*}}kω+\frac{∂y}{∂{x_{j}}}[(ν+{σ_{k}}{ν_{T}})\frac{∂k}{∂{x_{j}}}] \) (5)
Specific dissipation rate:
\( \frac{∂ω}{∂t}+{U_{j}}\frac{∂ω}{∂{x_{j}}}=α{S^{2}}-β{ω^{2}}+\frac{∂}{∂{x_{j}}}[(ν+{σ_{ω}}{ν_{T}})\frac{∂ω}{∂{x_{j}}}]+2(1-{F_{1}}){σ_{{ω^{2}}}}\frac{1}{ω}\frac{∂k}{∂{x_{i}}}\frac{∂ω}{∂{x_{i}}} \) (6)
\( {F_{1}}=tanh\lbrace {\lbrace min[max(\frac{\sqrt[]{k}}{{β^{*}}ωy},\frac{500ν}{{y^{2}}ω}),\frac{4{σ_{{ω^{2}}}}k}{C{D_{kω}}{y^{2}}}]\rbrace ^{4}}\rbrace \) (7)
\( {CD_{kω}}=max(2ρ{σ_{{ω^{2}}}}\frac{1}{ω}\frac{∂k}{∂{x_{i}}}\frac{∂ω}{∂{x_{i}}},{10^{-10}}) \) (8)
3. Result and discussion
This part displays and discusses the simulation results of NACA 2412 and 4412 aerofoil based on Fluent software. The pressure and velocity distribution of two types of aerofoil under different angles of attack are investigated, and then the aerodynamic characteristics of the two types of aerofoil at different angles of attack are compared.
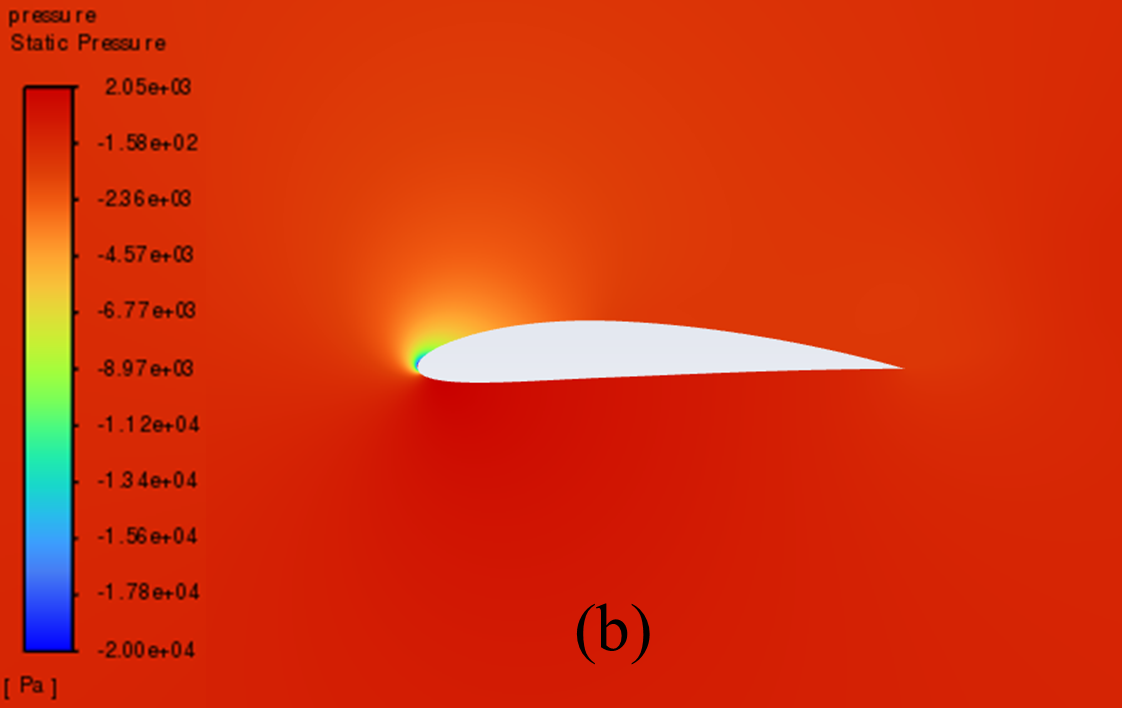
3.1. Cloud diagram of pressure distribution at different angles of attack
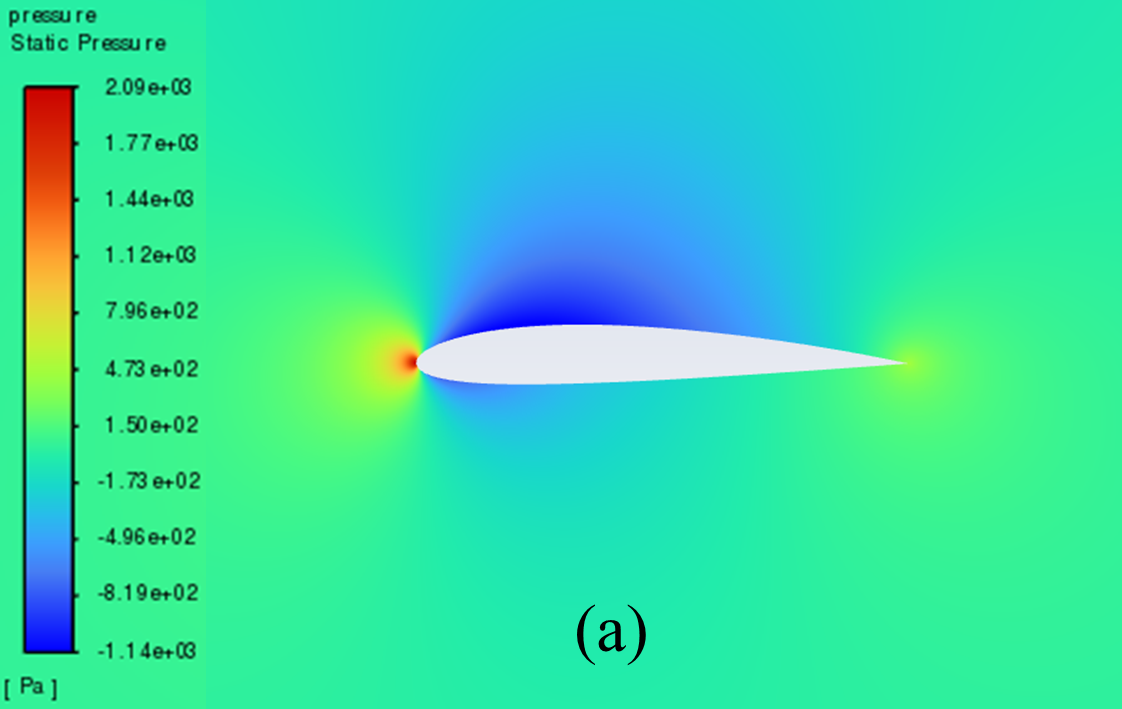
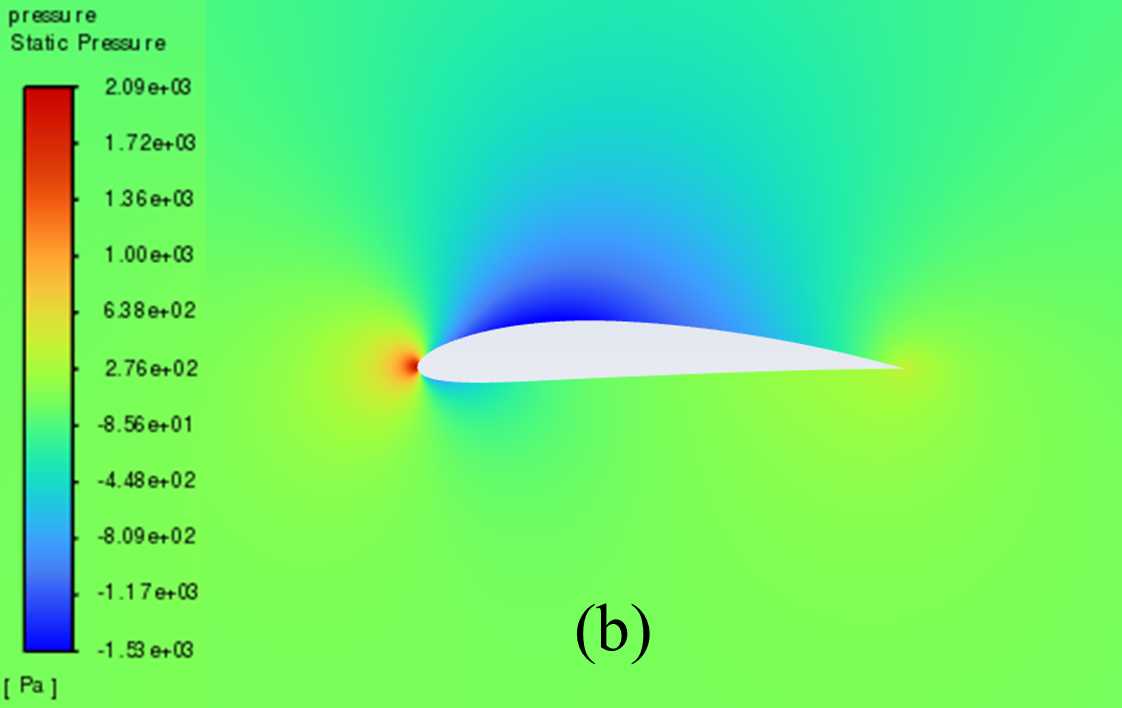
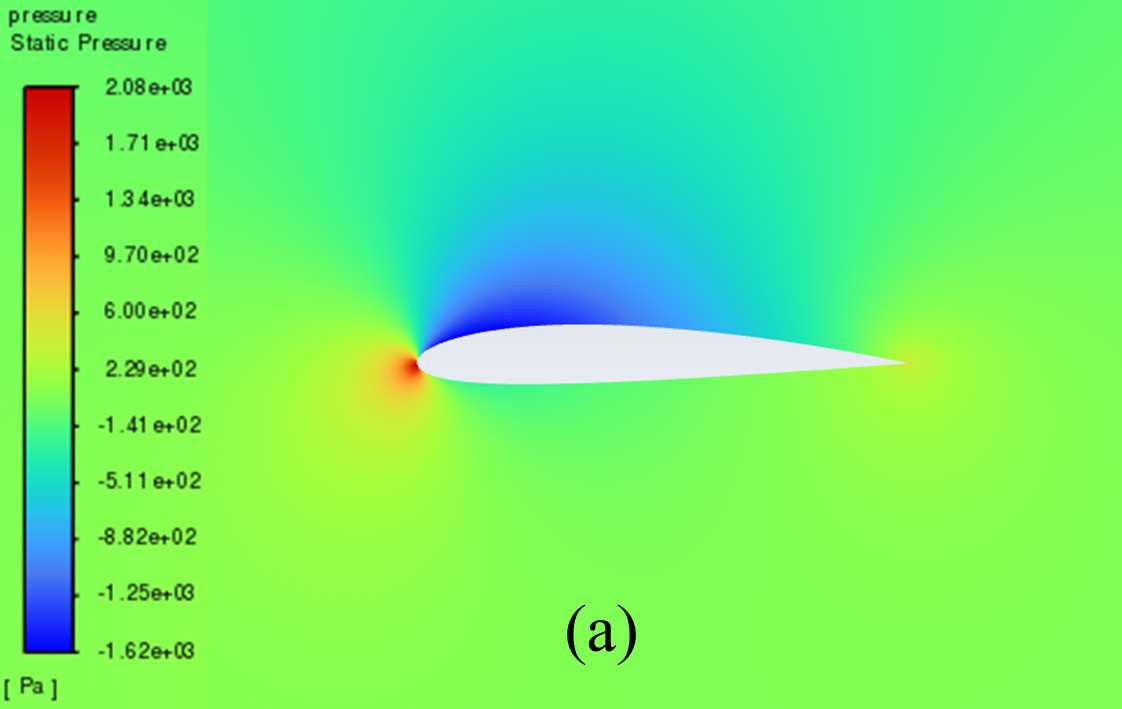
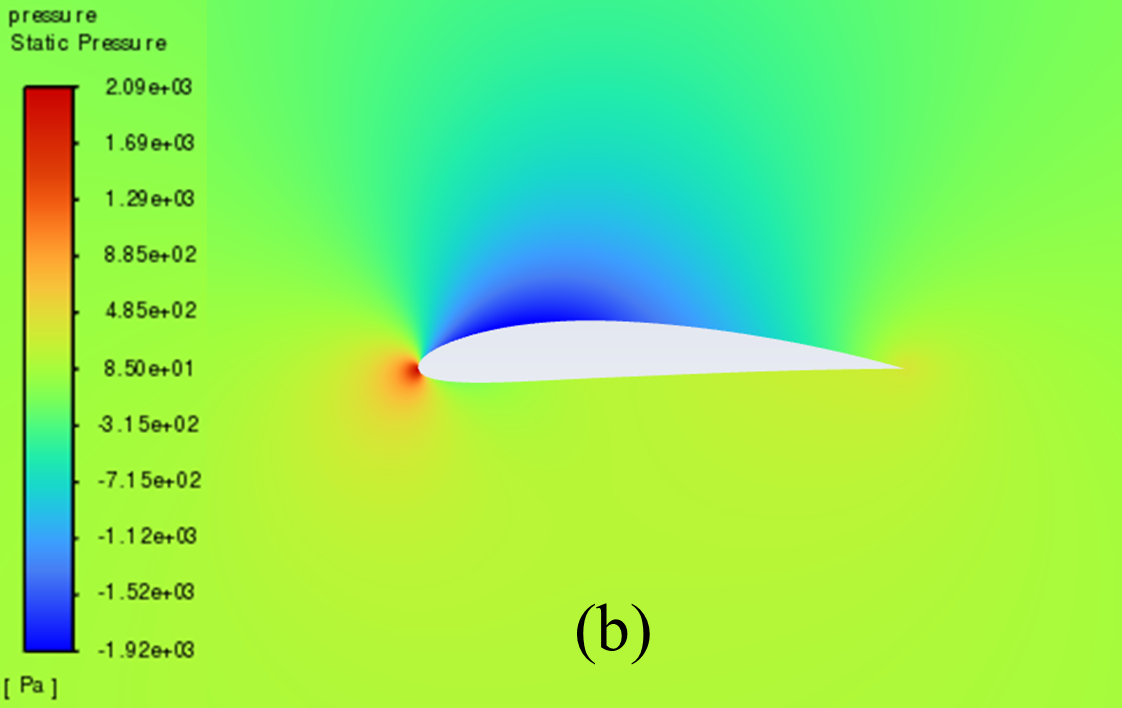
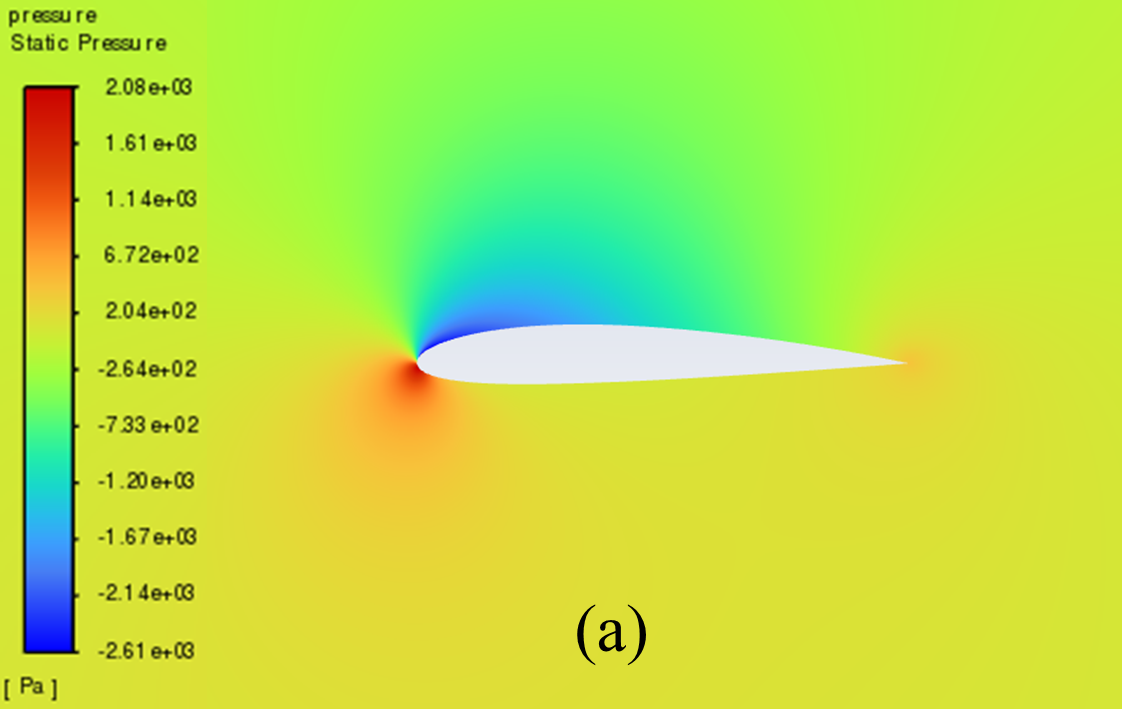
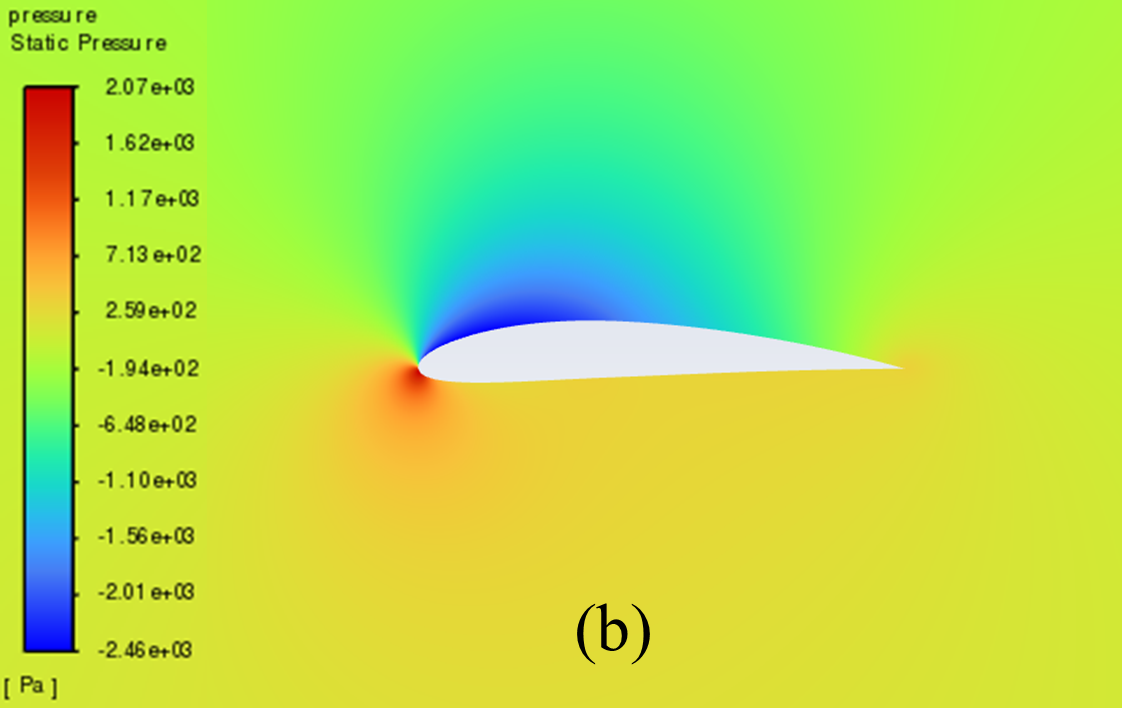
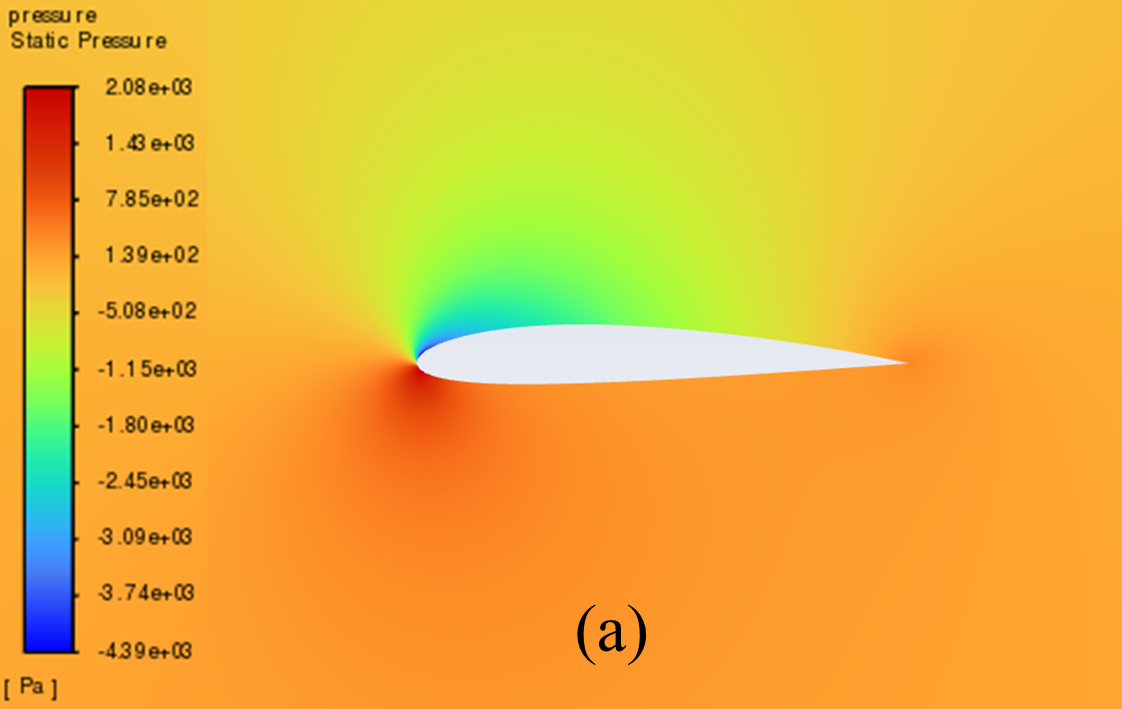
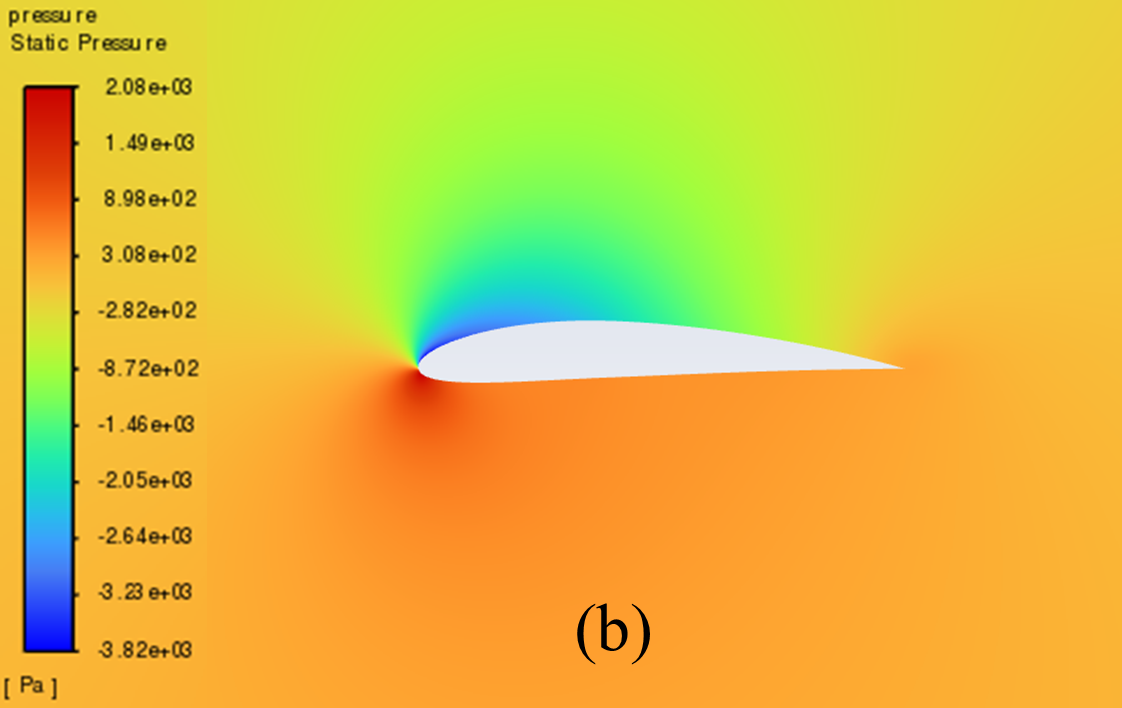
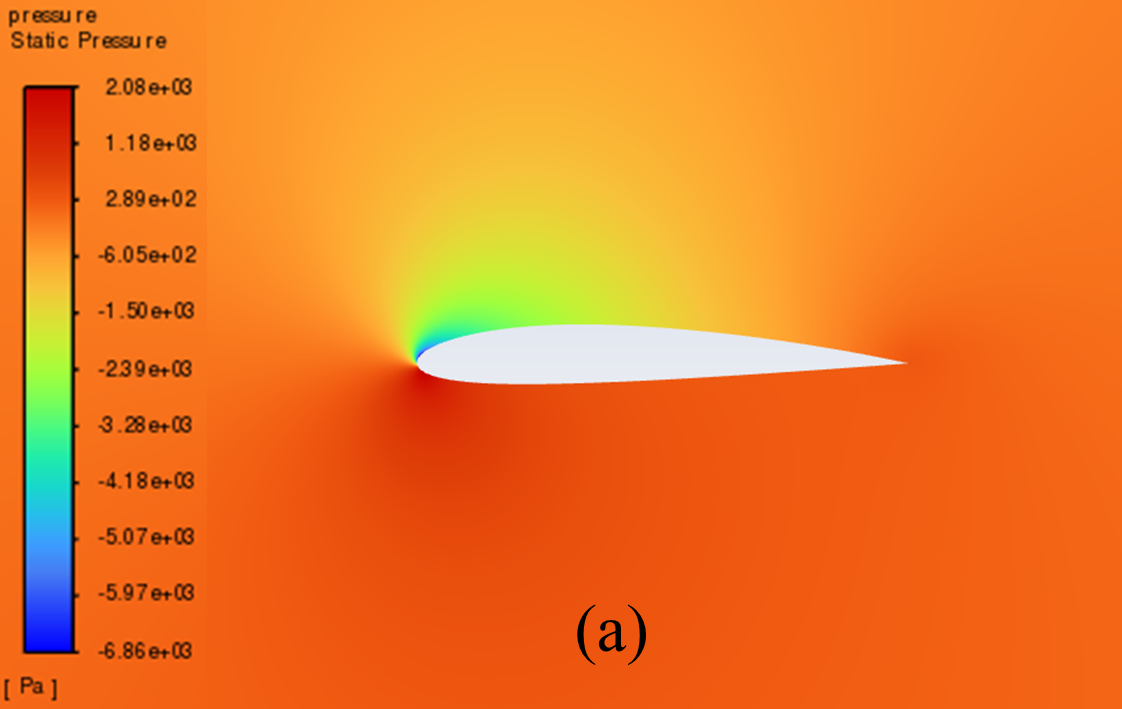
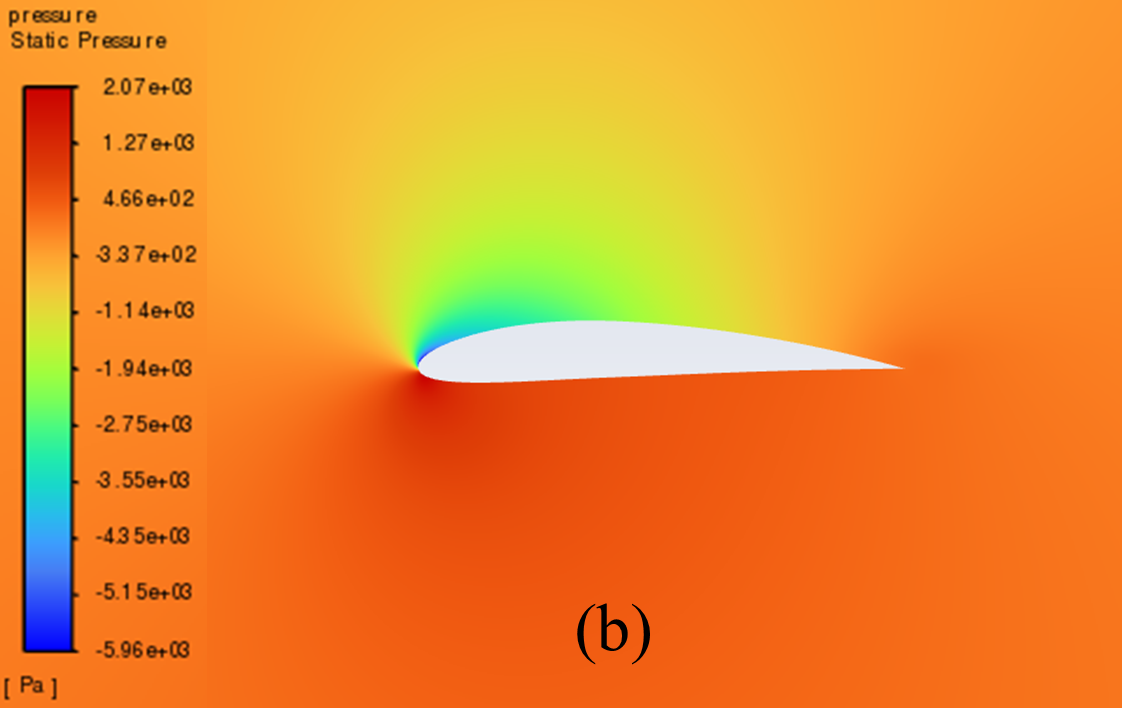
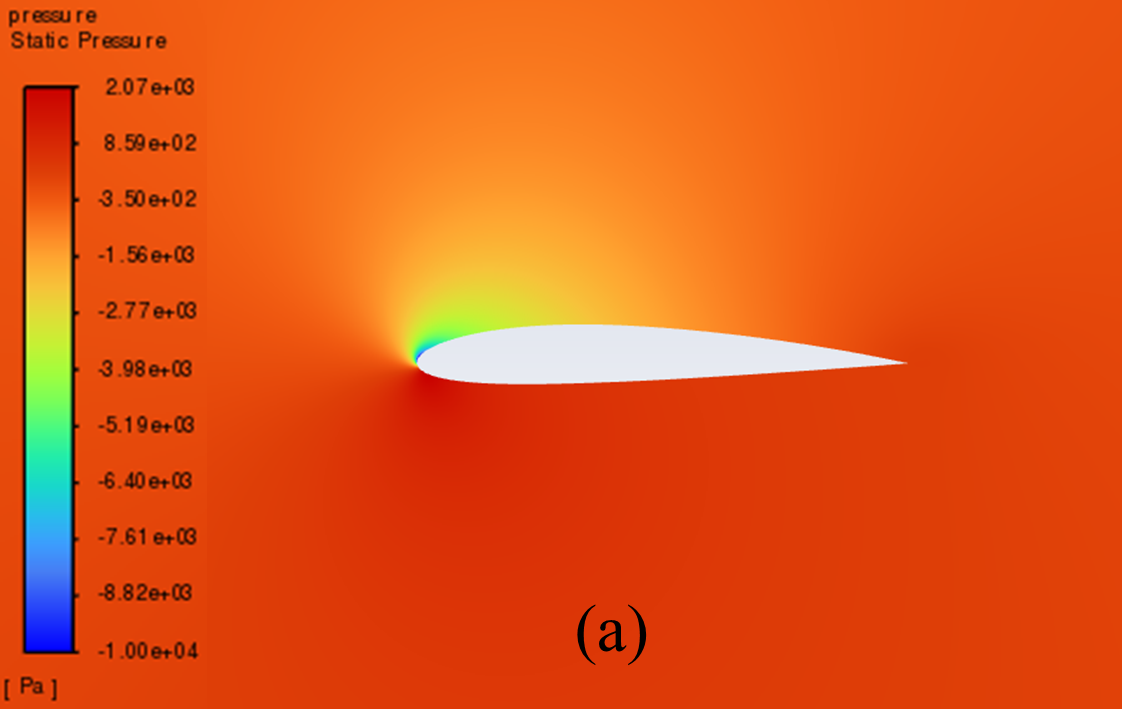
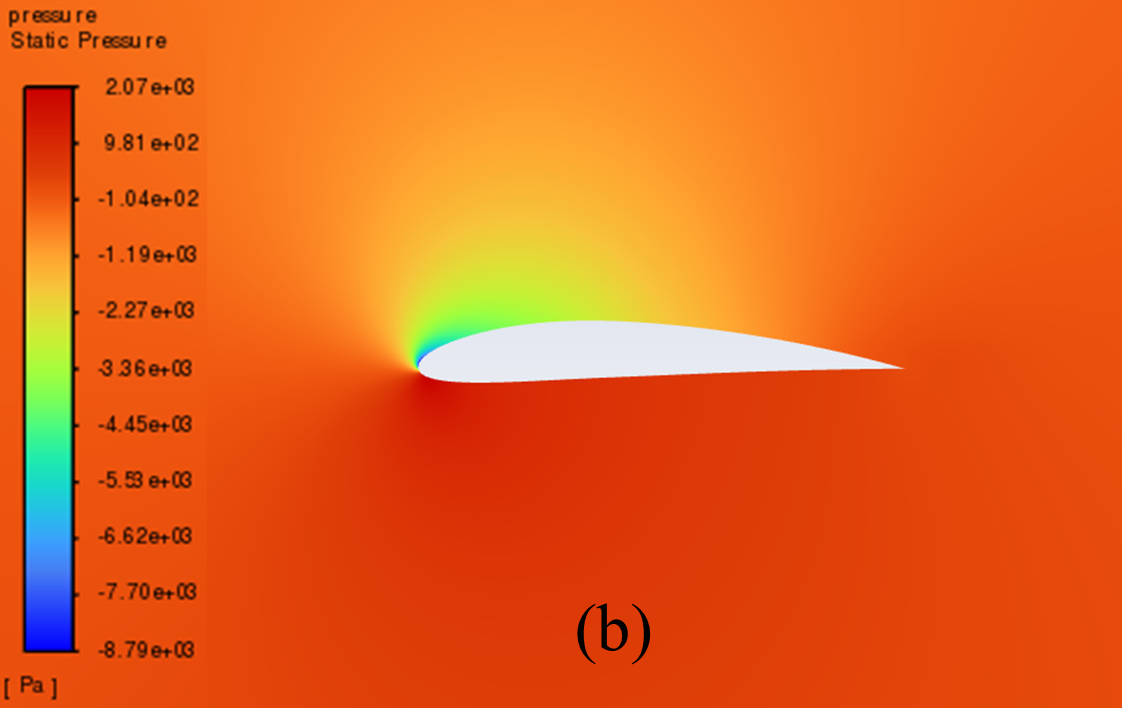
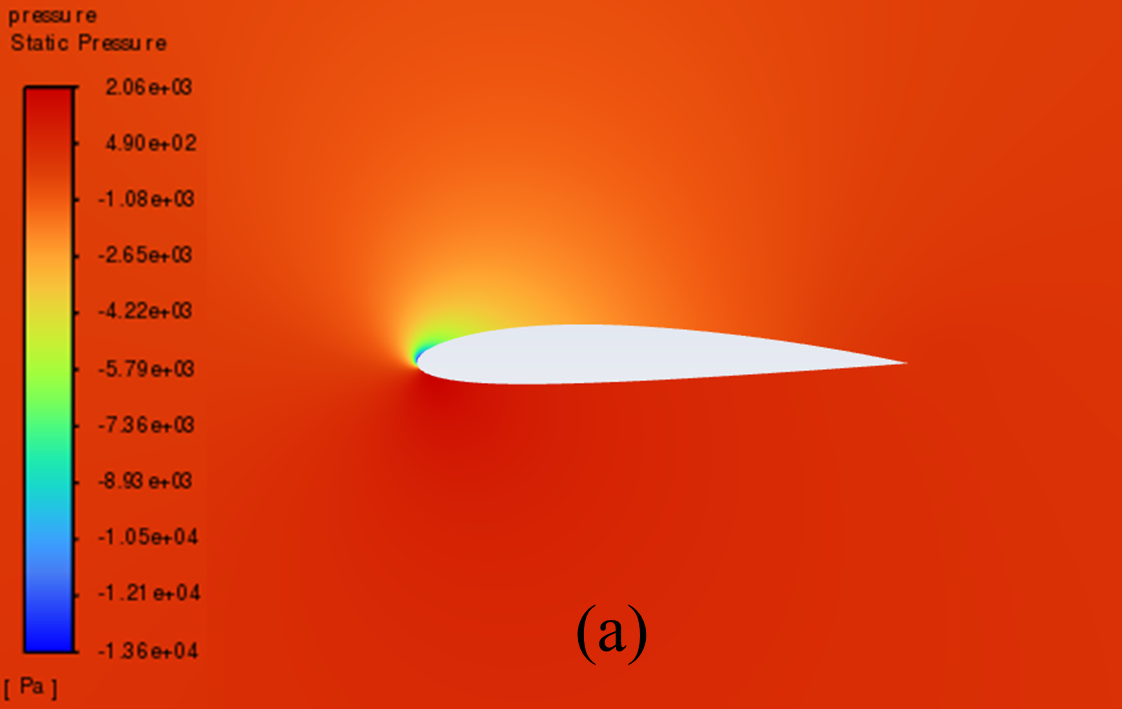
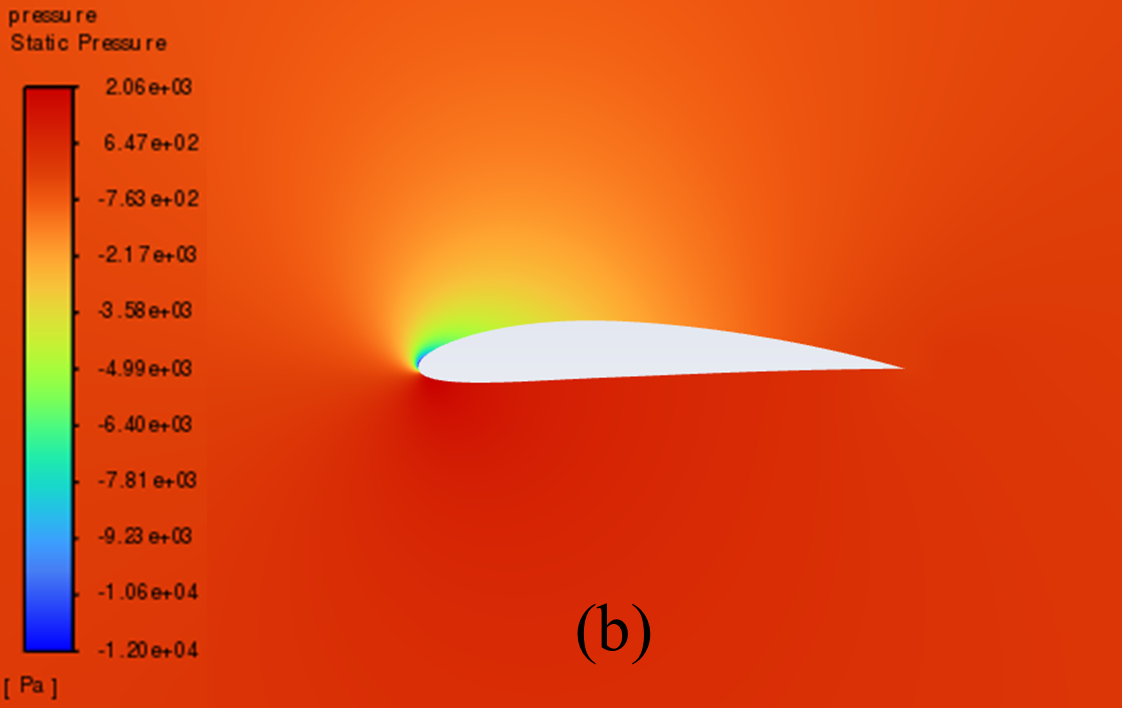
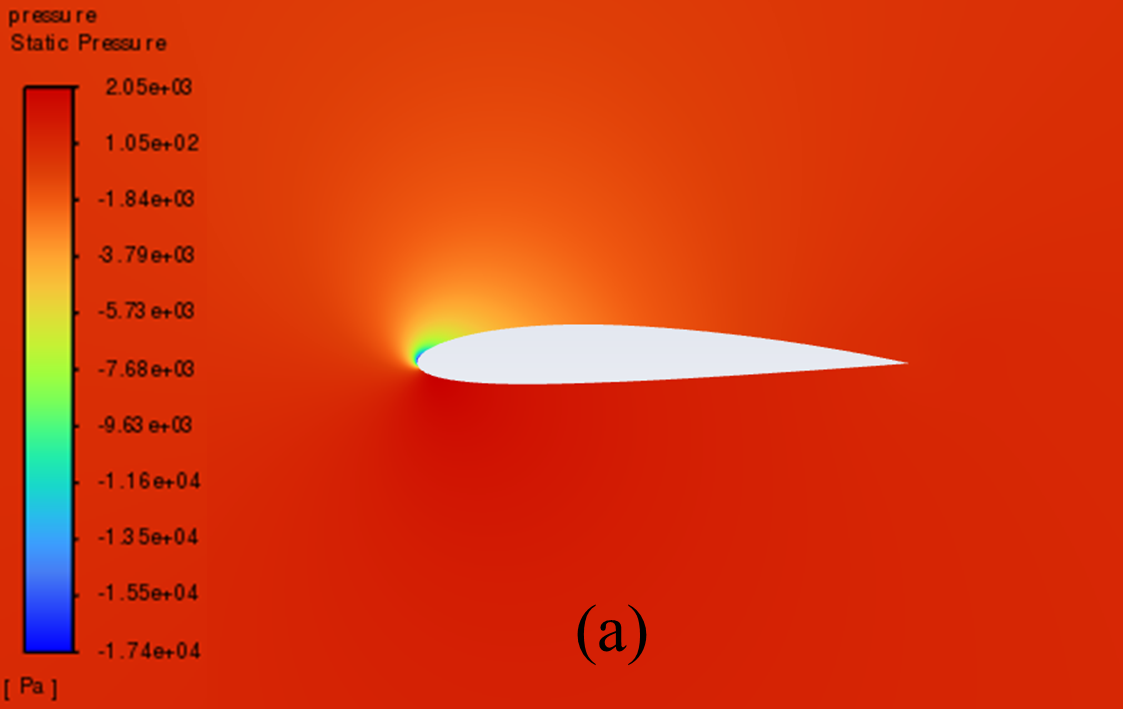
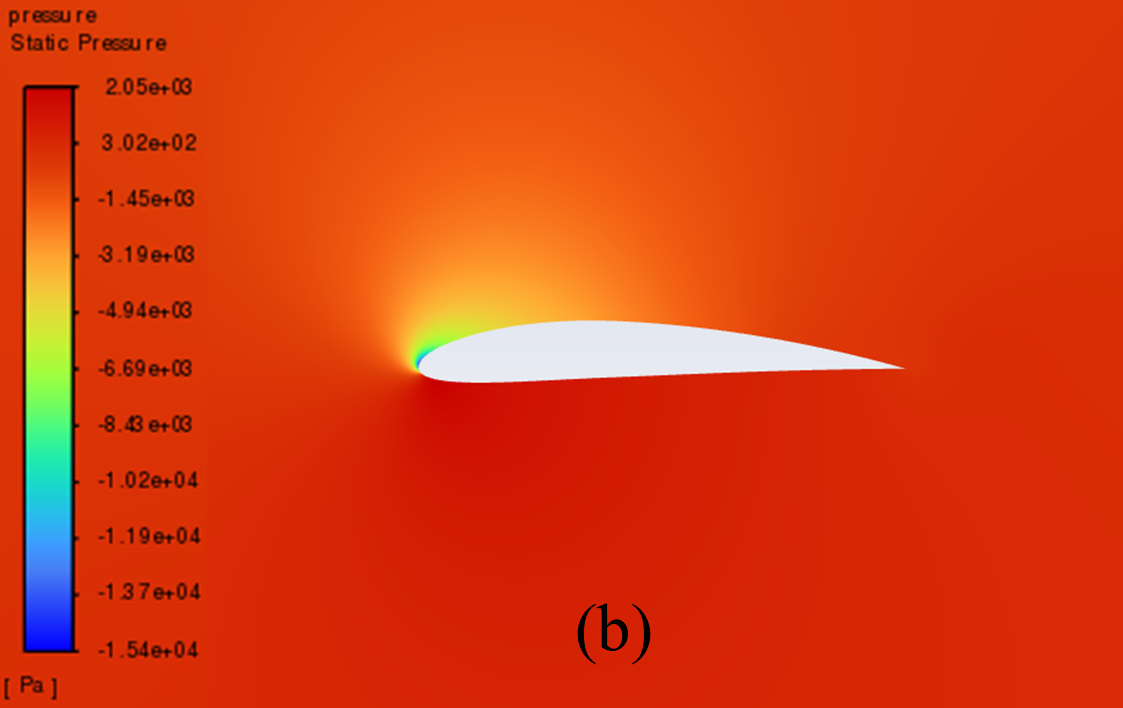
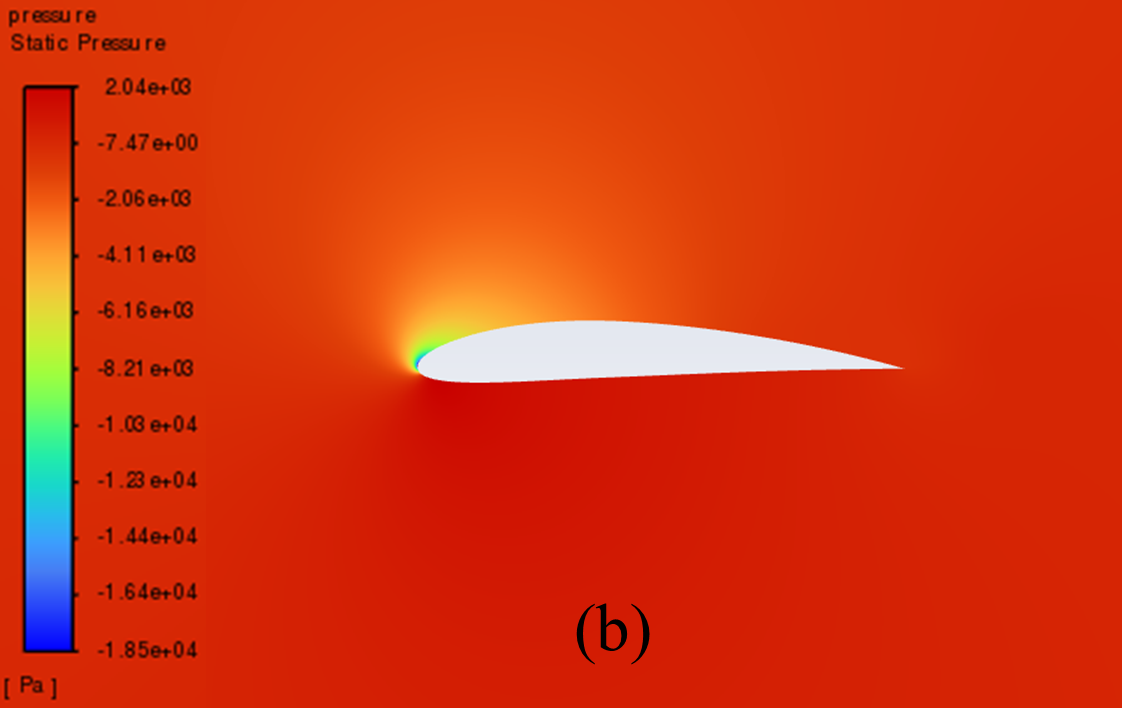
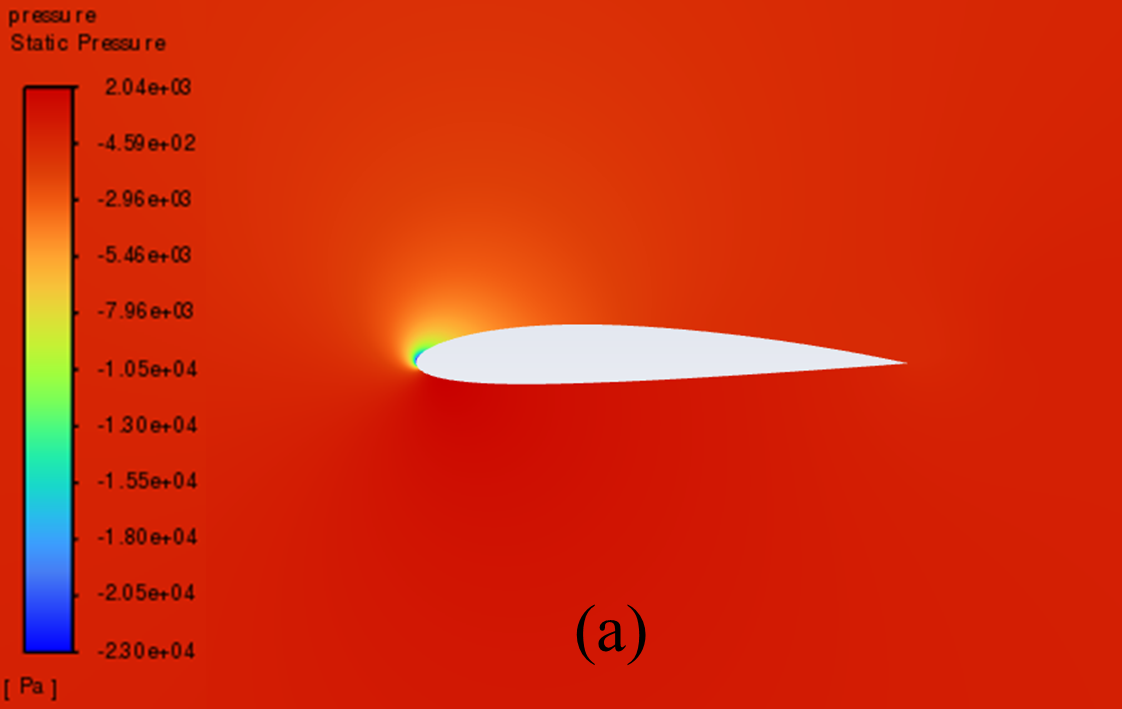
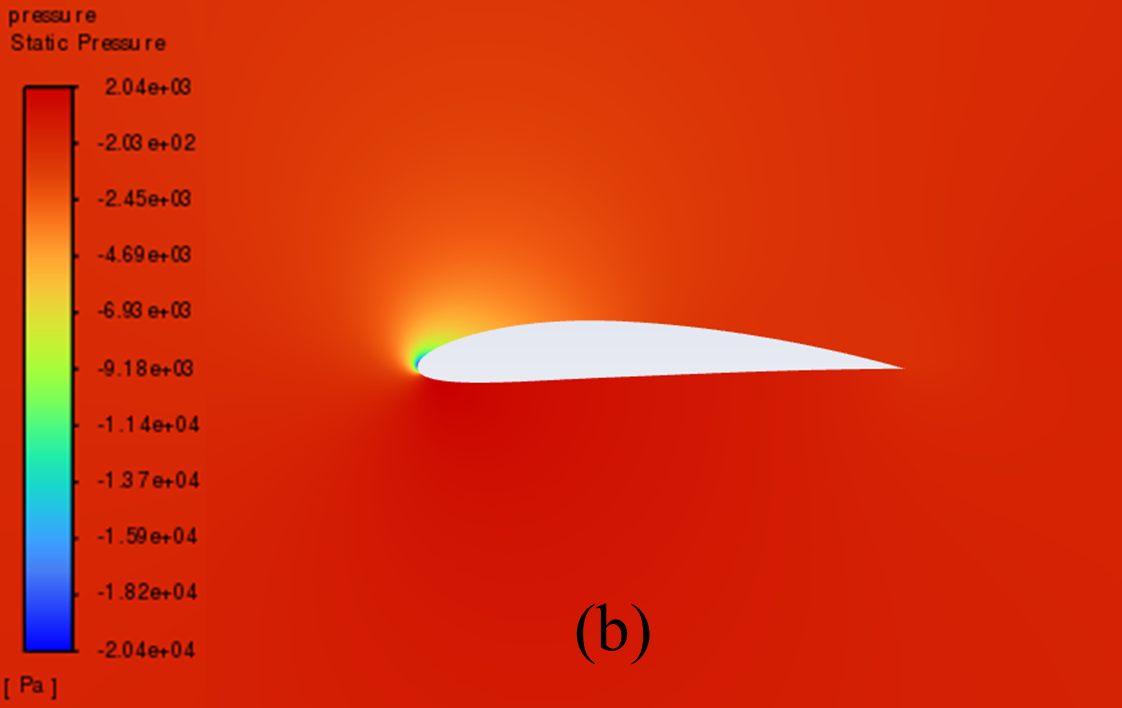
Figure 5 illustrates the static pressure cloud image of NACA 2412 and NACA 4412 respectively from 0° to 20° Angle of attack (AOA). It can be seen from the comparative analysis of the figure, that as the increase of AOA, there is a low-pressure area on the upper surface of the aerofoil, and its pressure centre gradually moves to the forward edge. In addition, there is a stagnation point at the leading edge of the aerofoil, where the static pressure reaches its maximum. With the increase of the AOA, the position of the stagnation point constantly moves below the leading edge point. The above phenomenon is reflected in NACA 2412 and NACA 4412.
Furthermore, the aerofoil has a relatively low static pressure on the upper surface, as well as a relatively high static pressure on the lower surface. According to the Bernoulli principle and lift theory, the airflow velocity on the upper surface of the aerofoil is higher than that on the lower surface, resulting in greater surface pressure on the lower surface than on the upper surface. When there is a certain pressure differential between the upper and lower surfaces of the aerofoil, the flow of air can effectively generate lift and push the aerofoil upward.
When the AOA is small, with the increase of the AOA, the airflow's rate of change in velocity on the upper surface increases, and the lift force increases accordingly. However, when the AOA is large, the flow separation phenomenon begins to occur, resulting in a continuous decline in the growth rate of lift.
0° AOA
2° AOA
4° AOA
6° AOA
8° AOA
10° AOA
12° AOA
14° AOA

16° AOA
18° AOA

20° AOA
Figure 5: Pressure cloud images: (a) NACA 2412, (b) NACA 4412
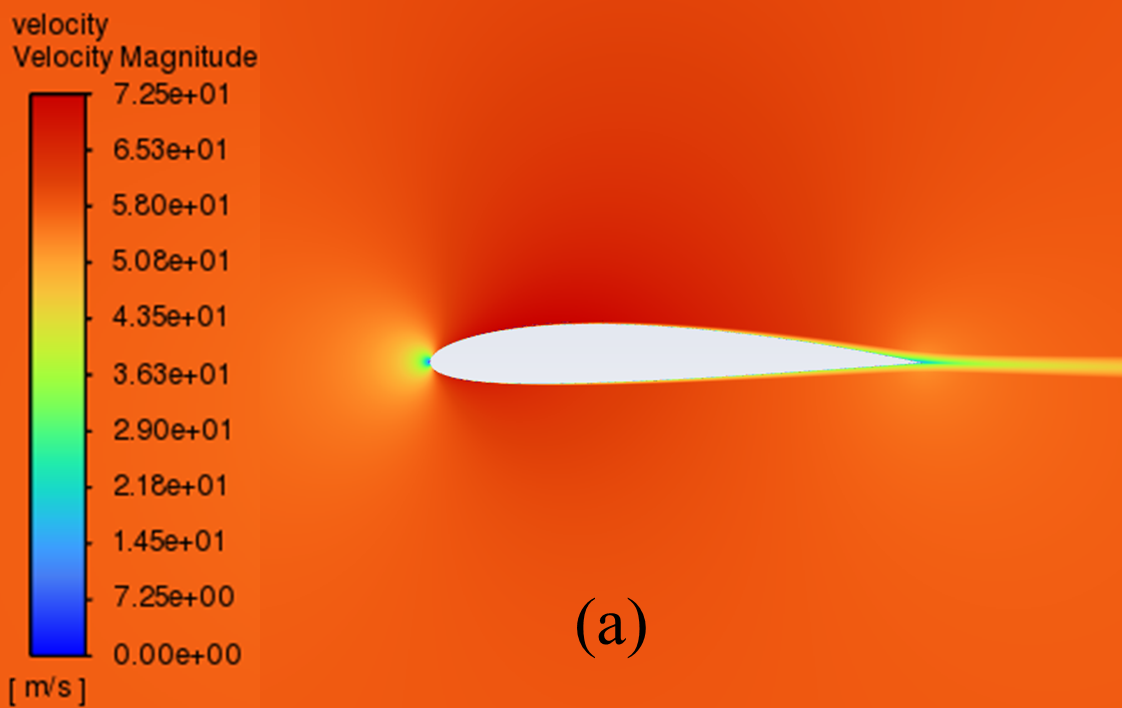
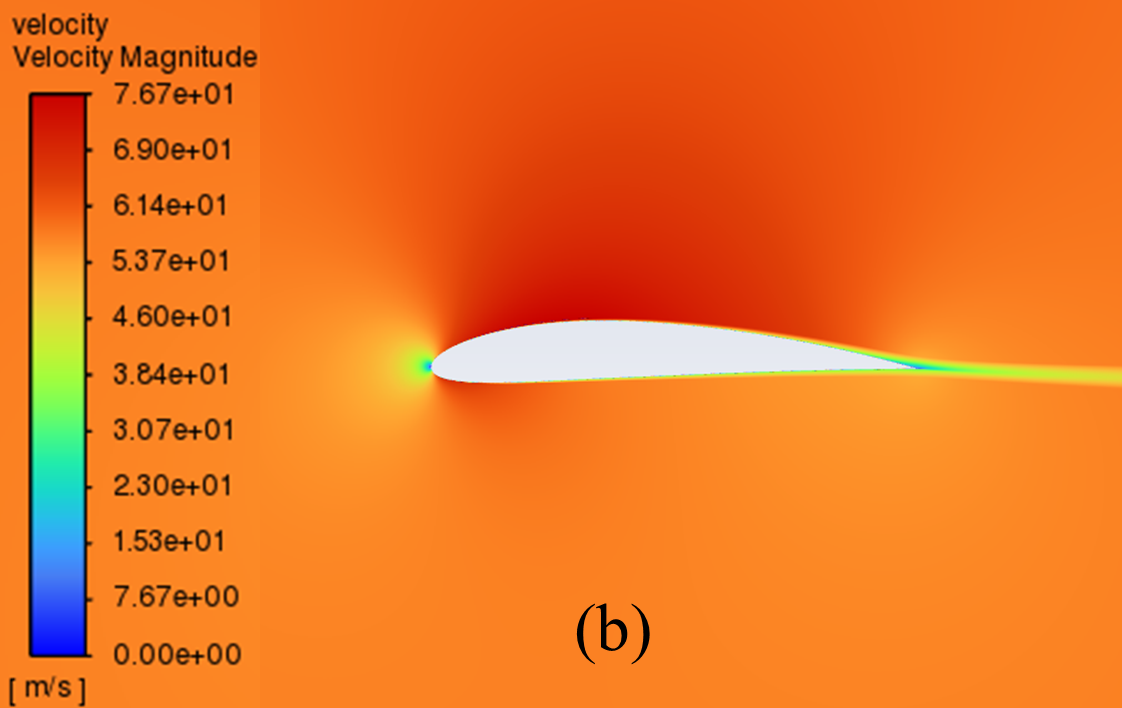
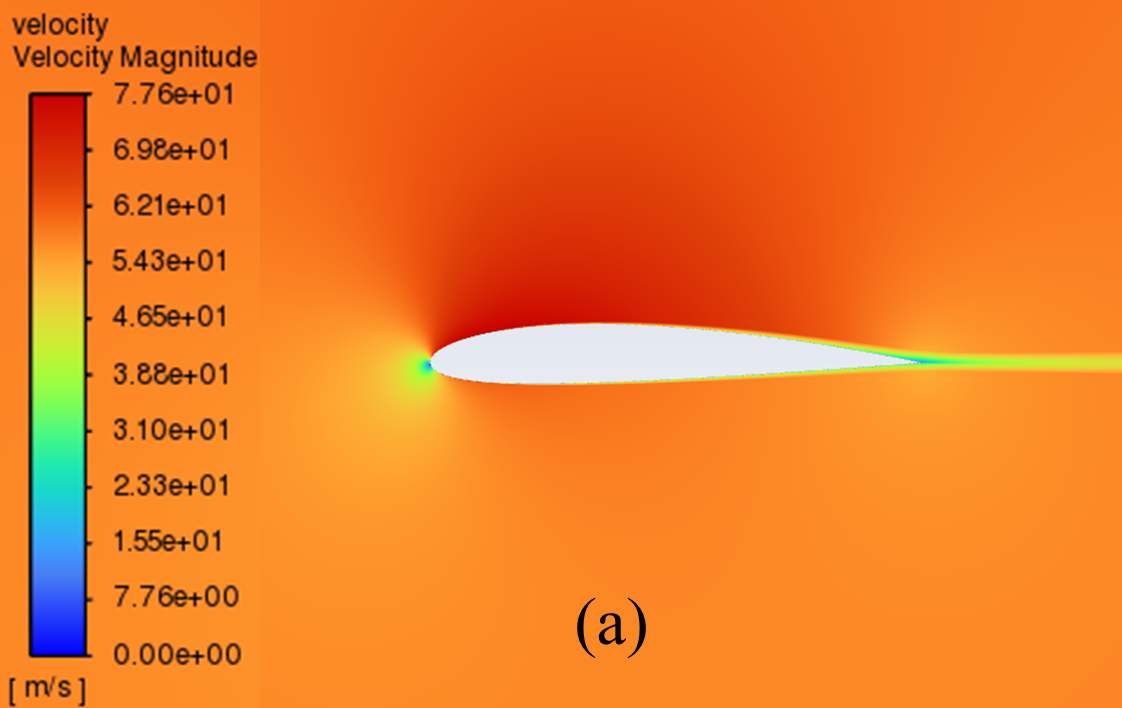
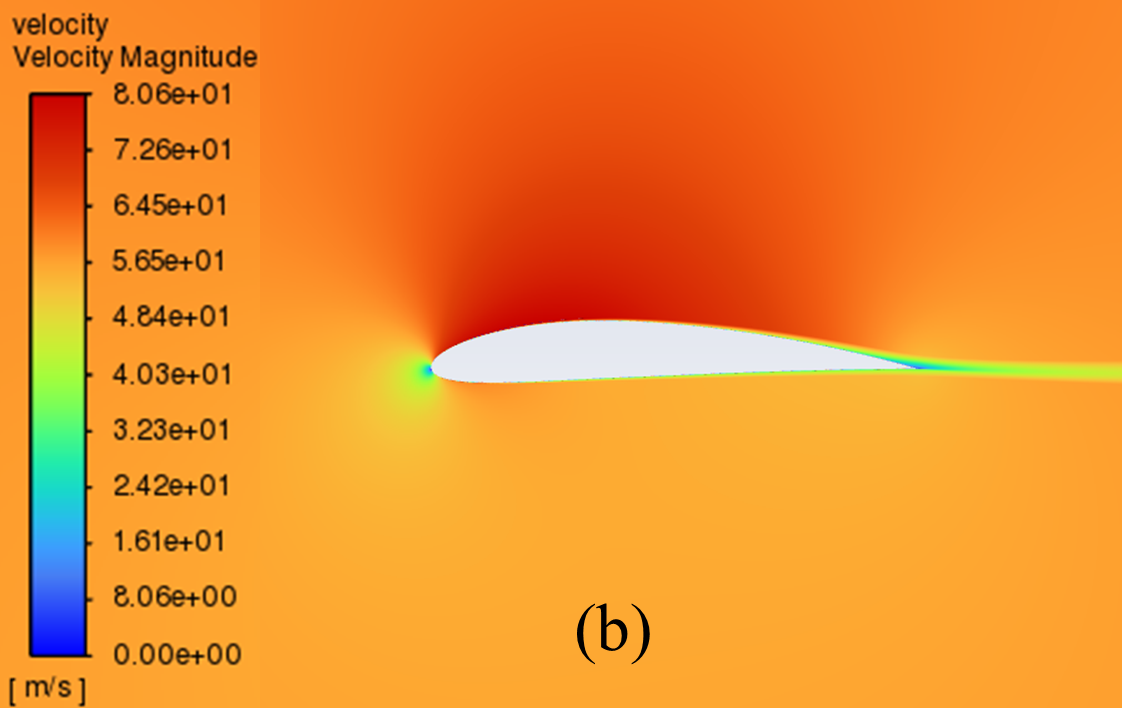
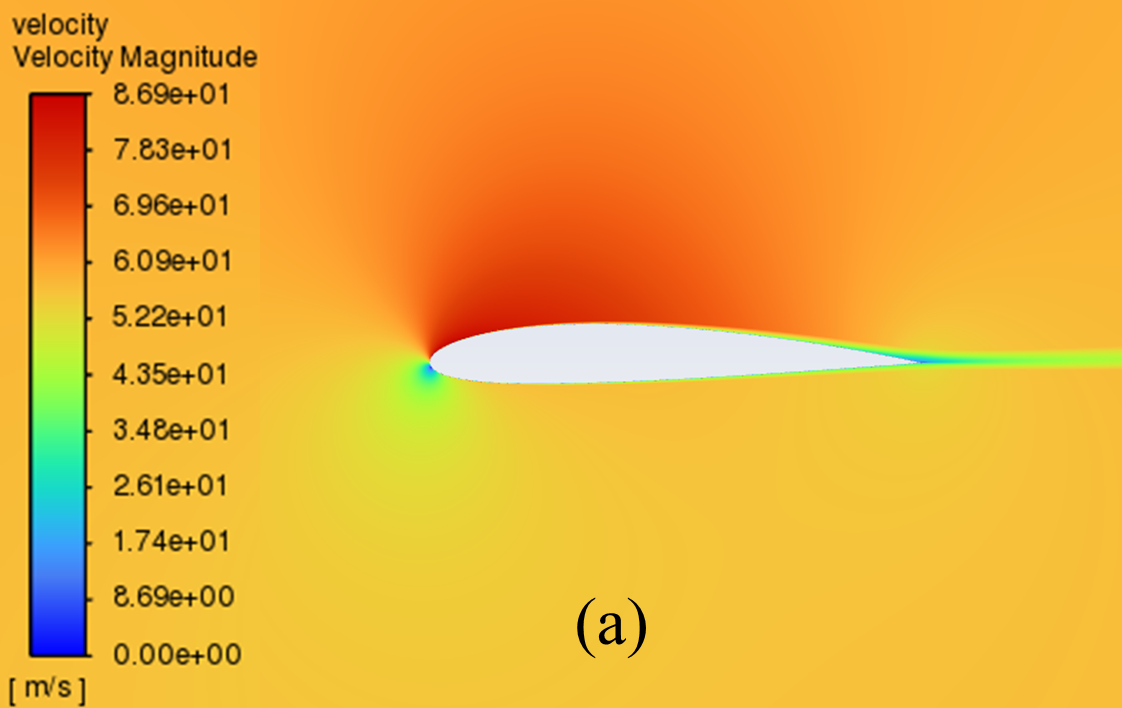
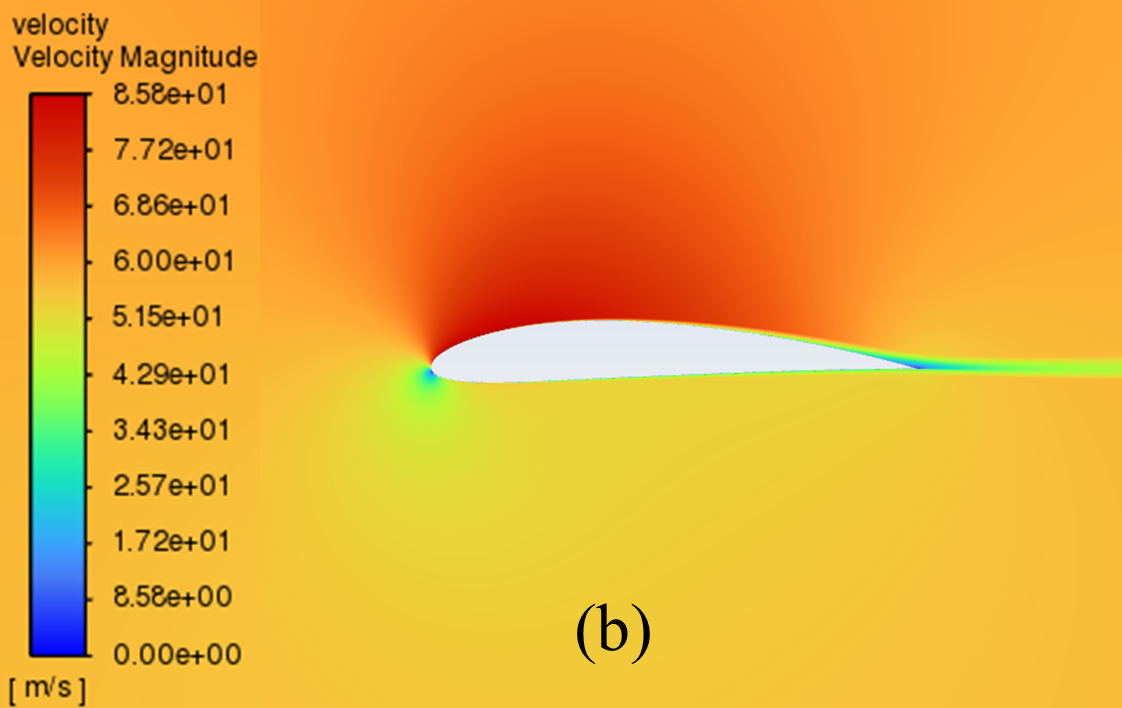
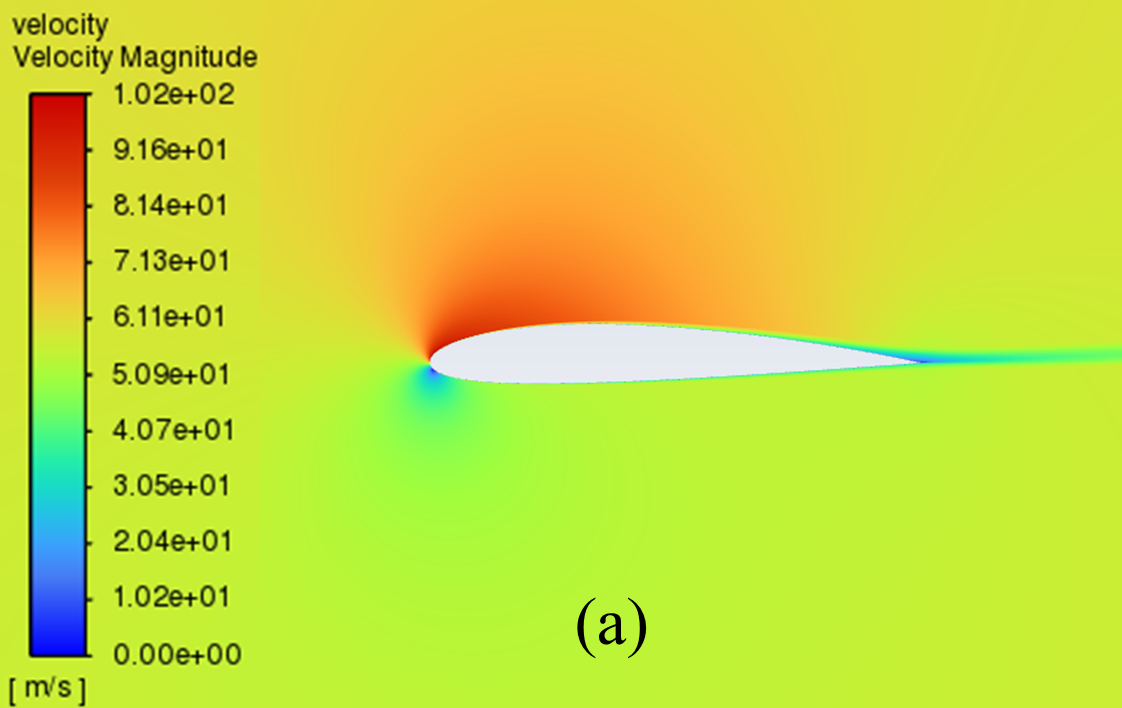
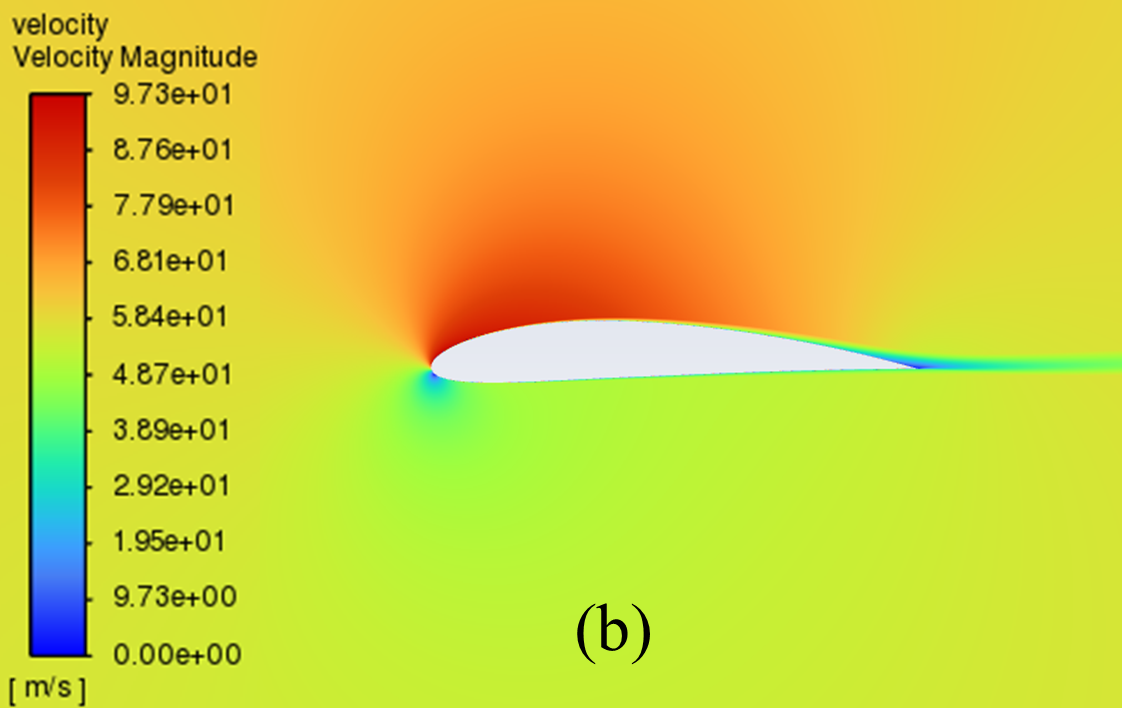
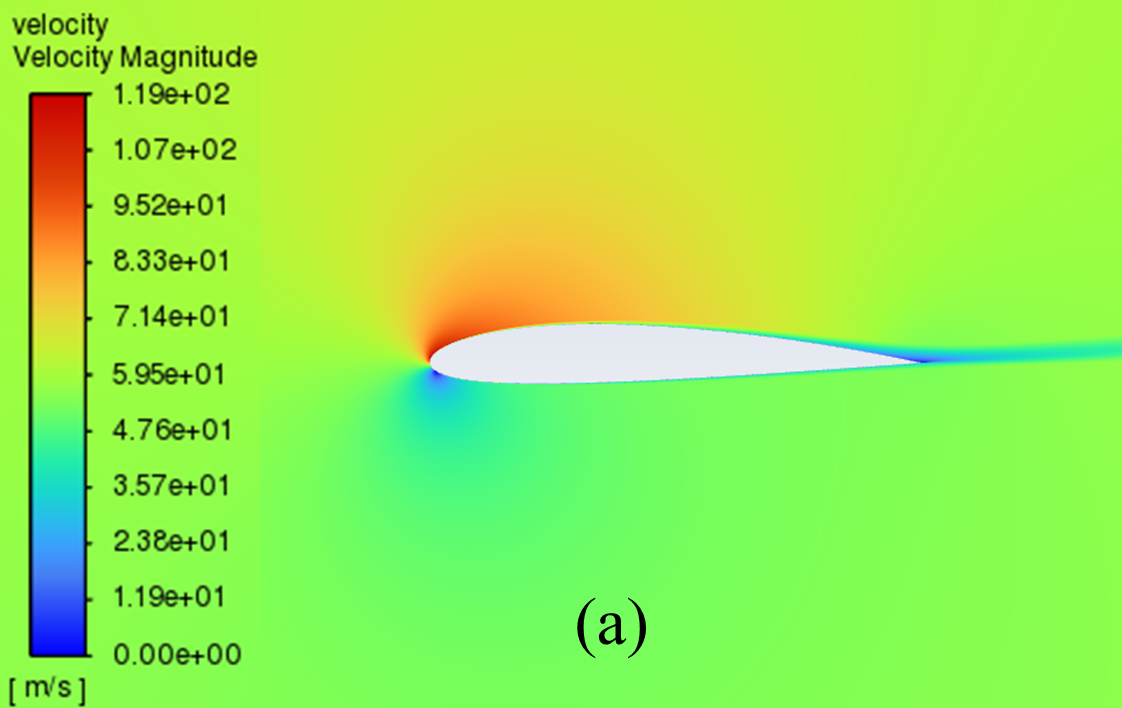
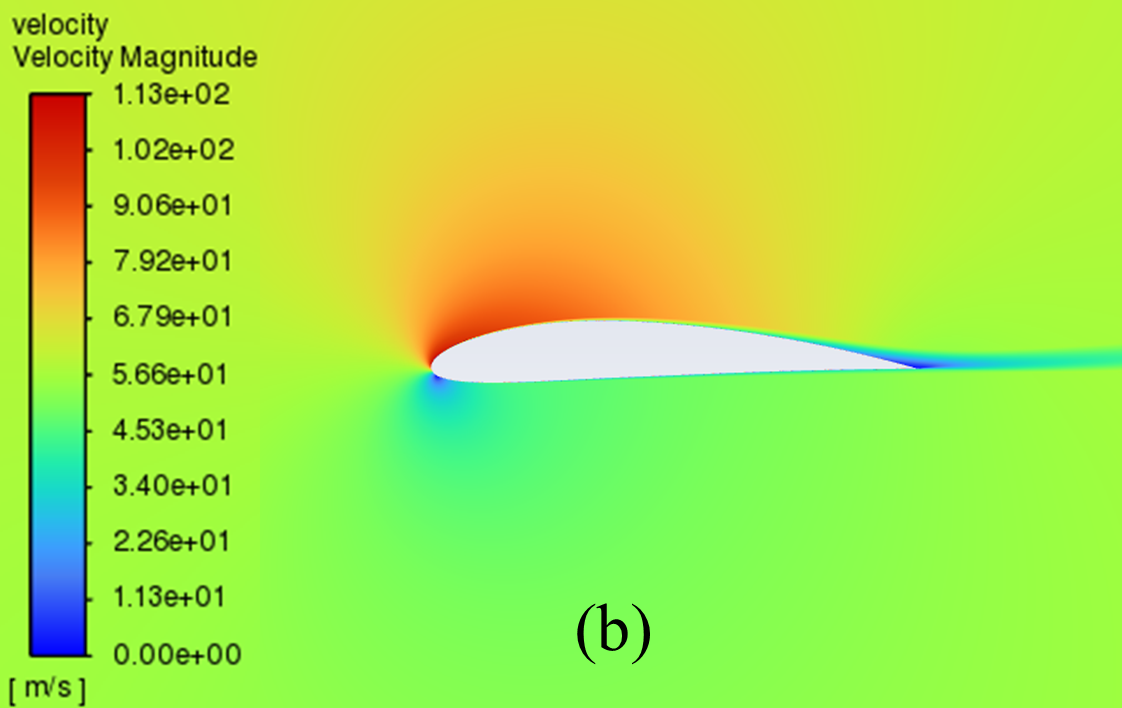
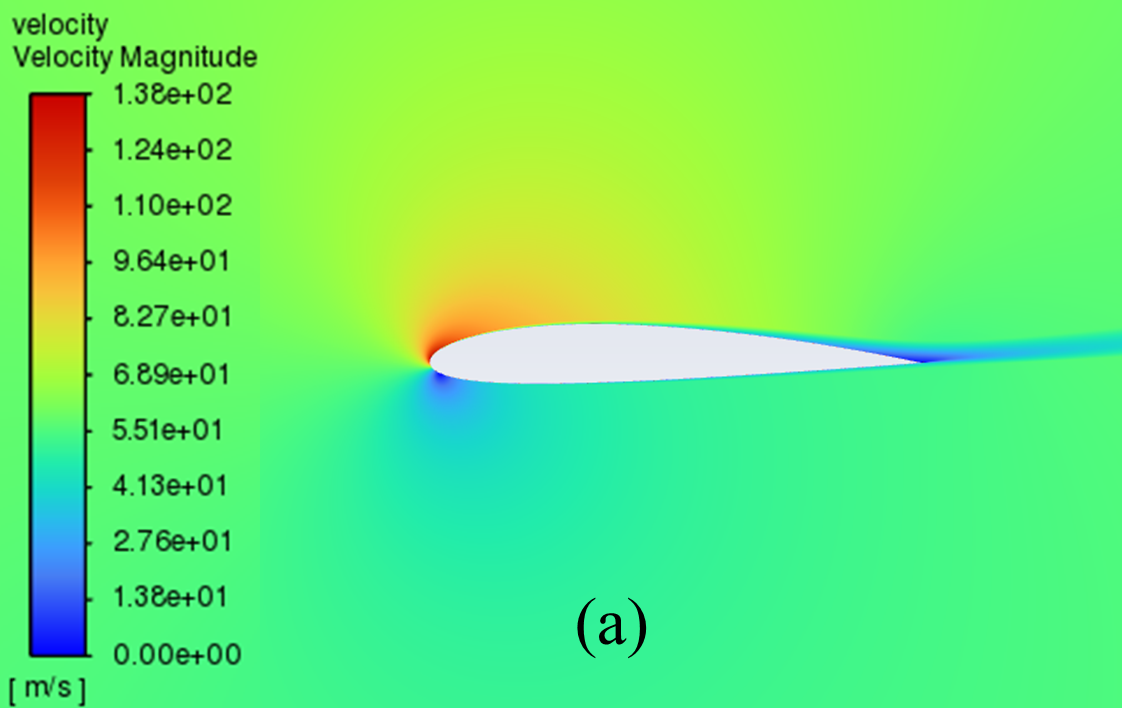
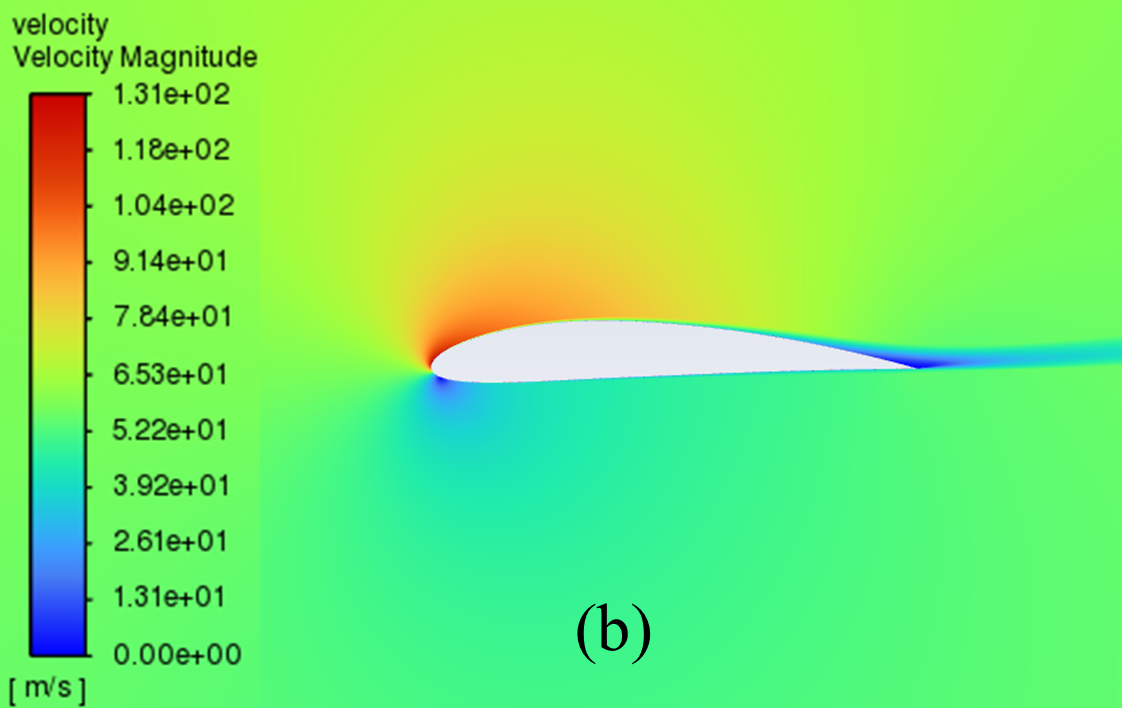
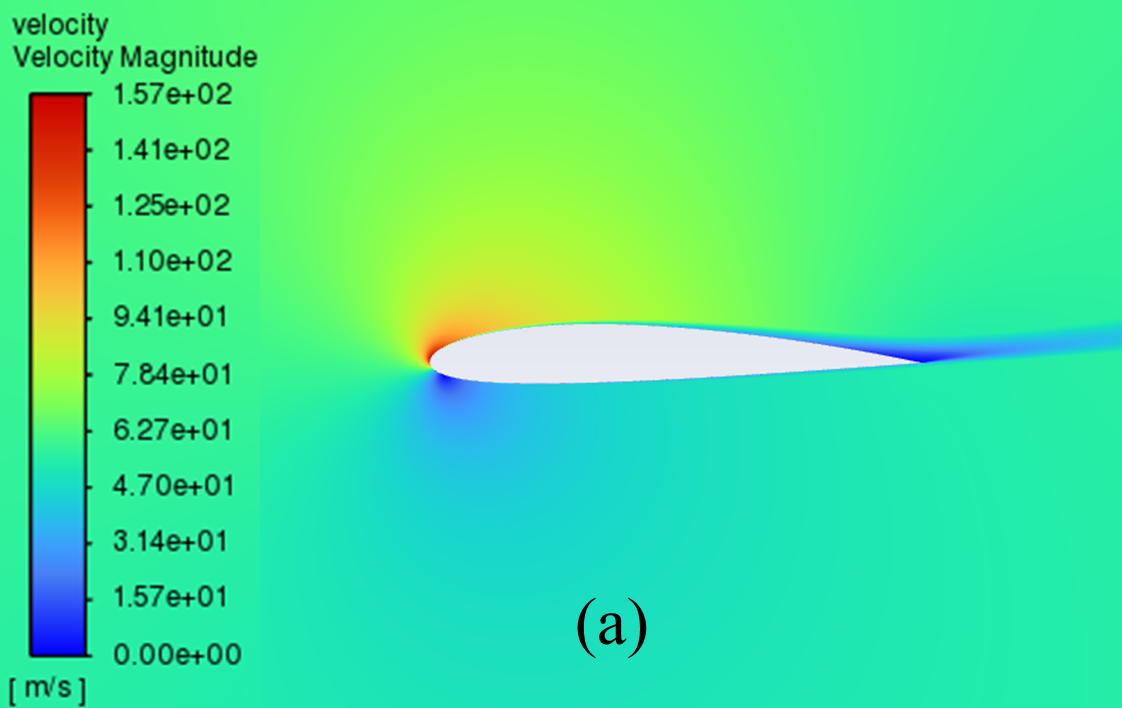
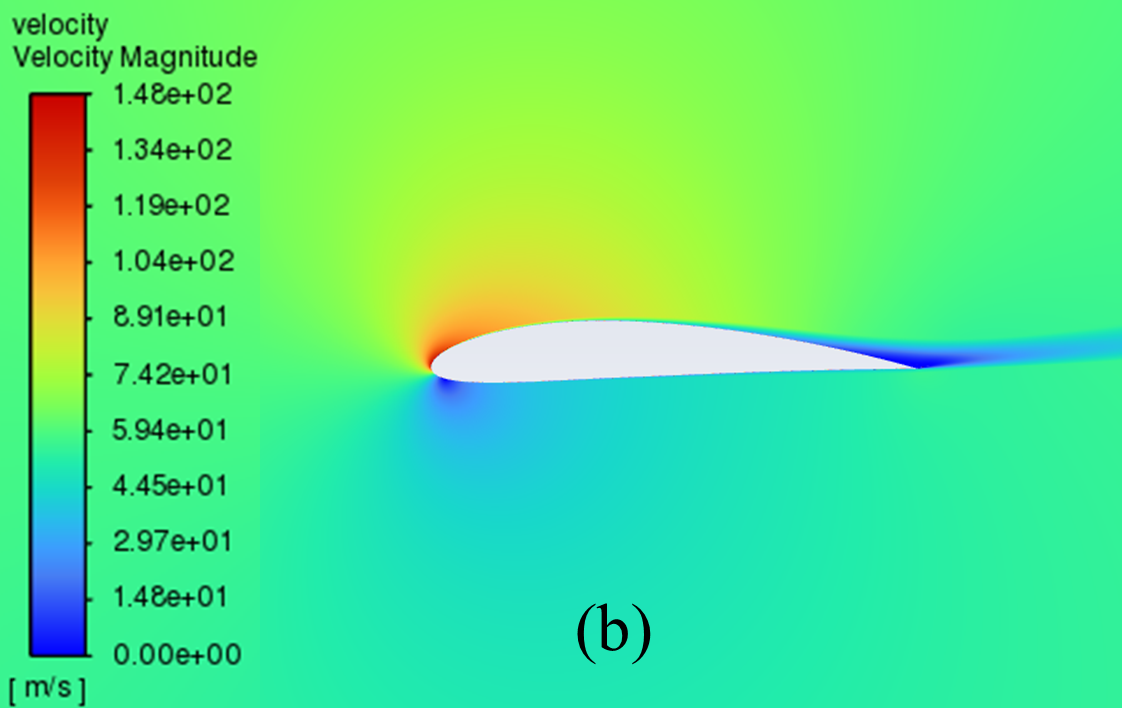
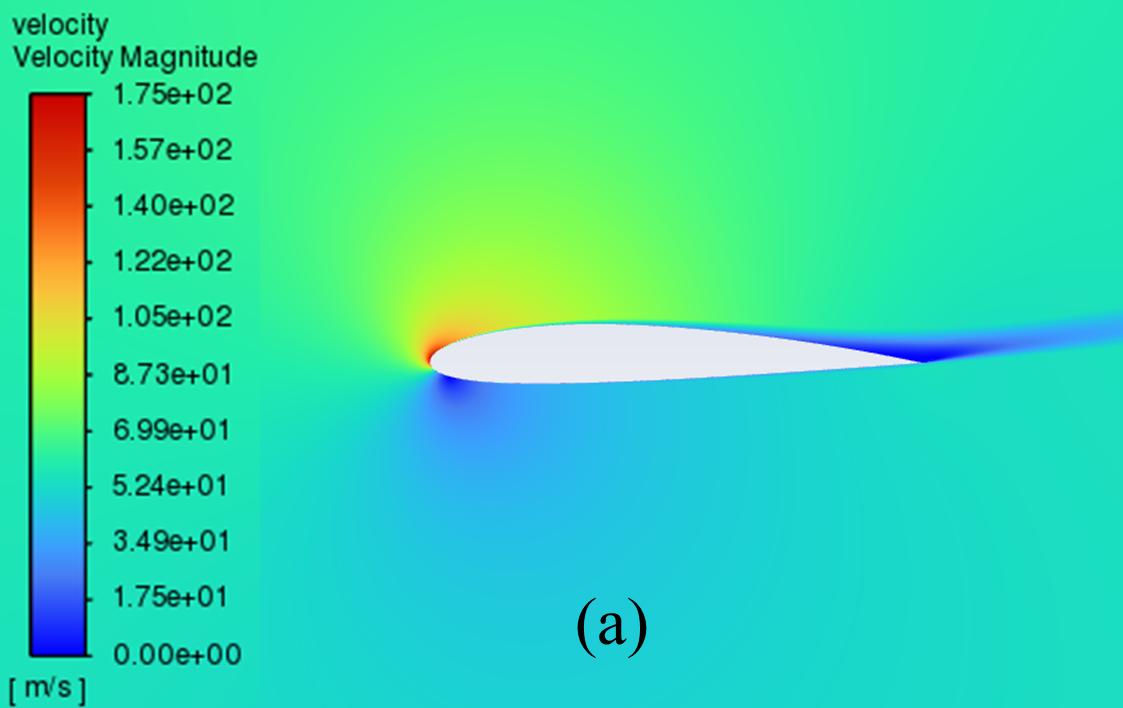
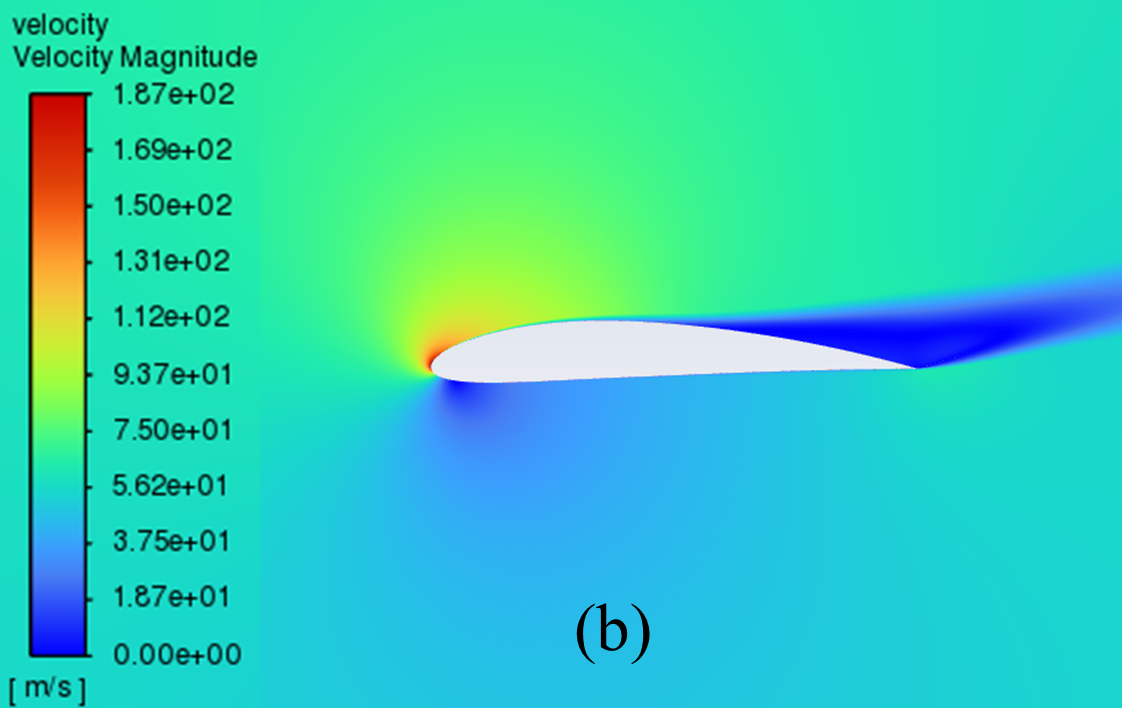
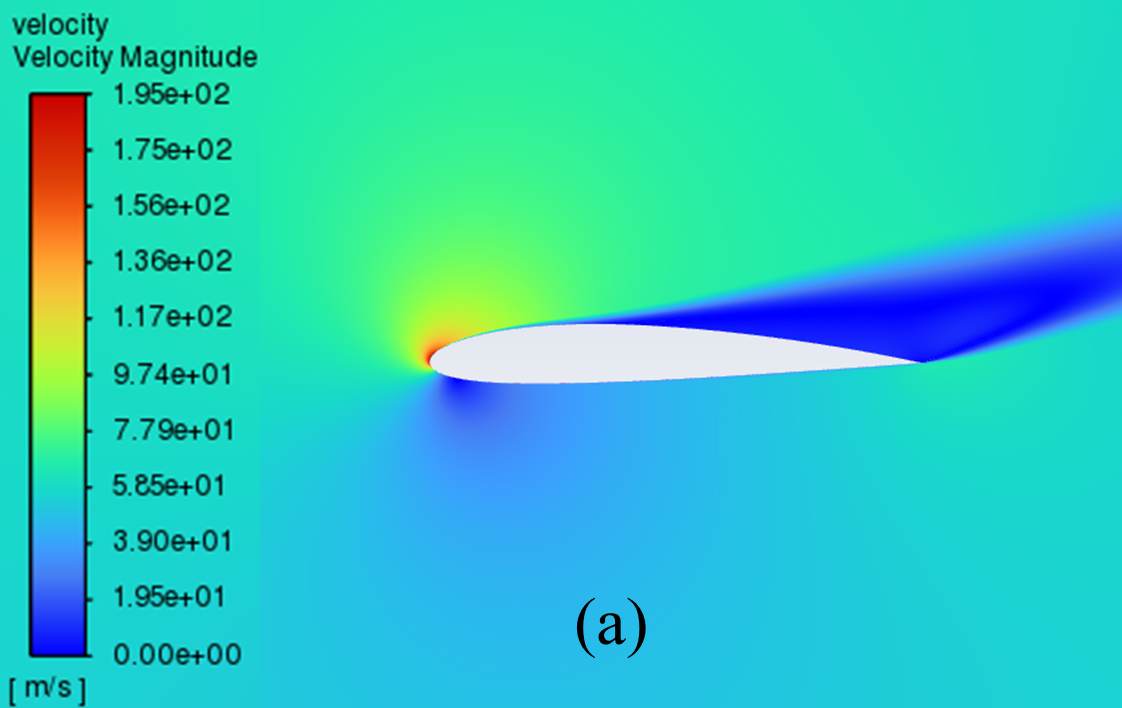
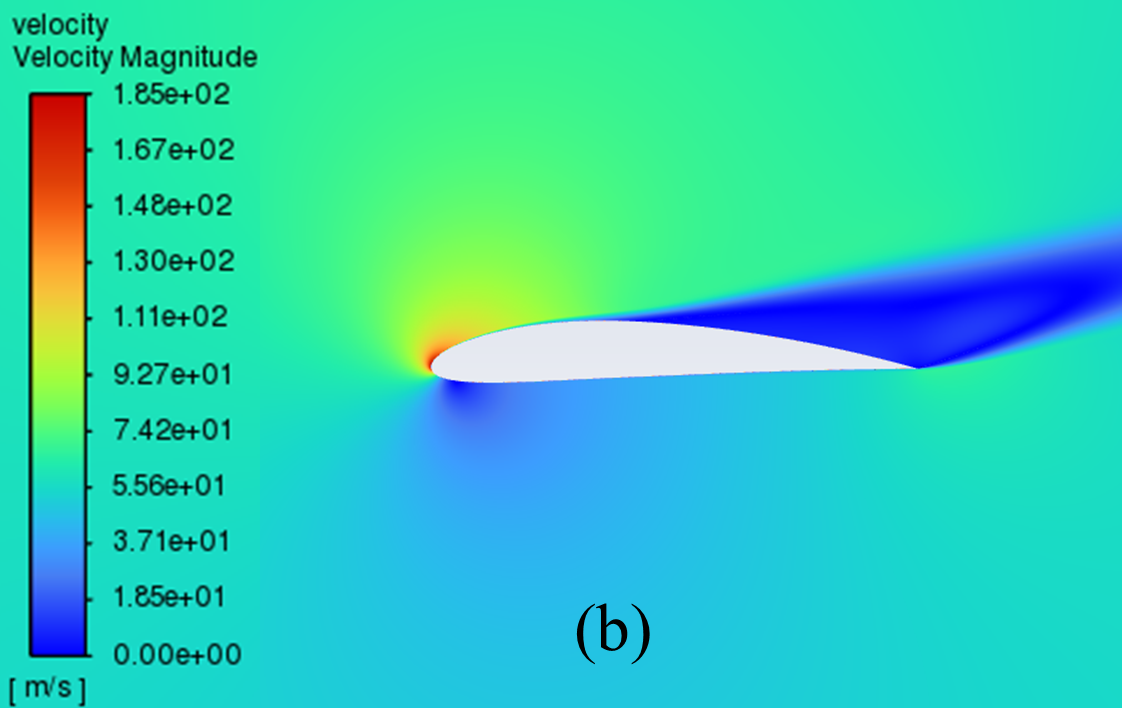
3.2. Cloud diagram of velocity distribution at different angles of attack
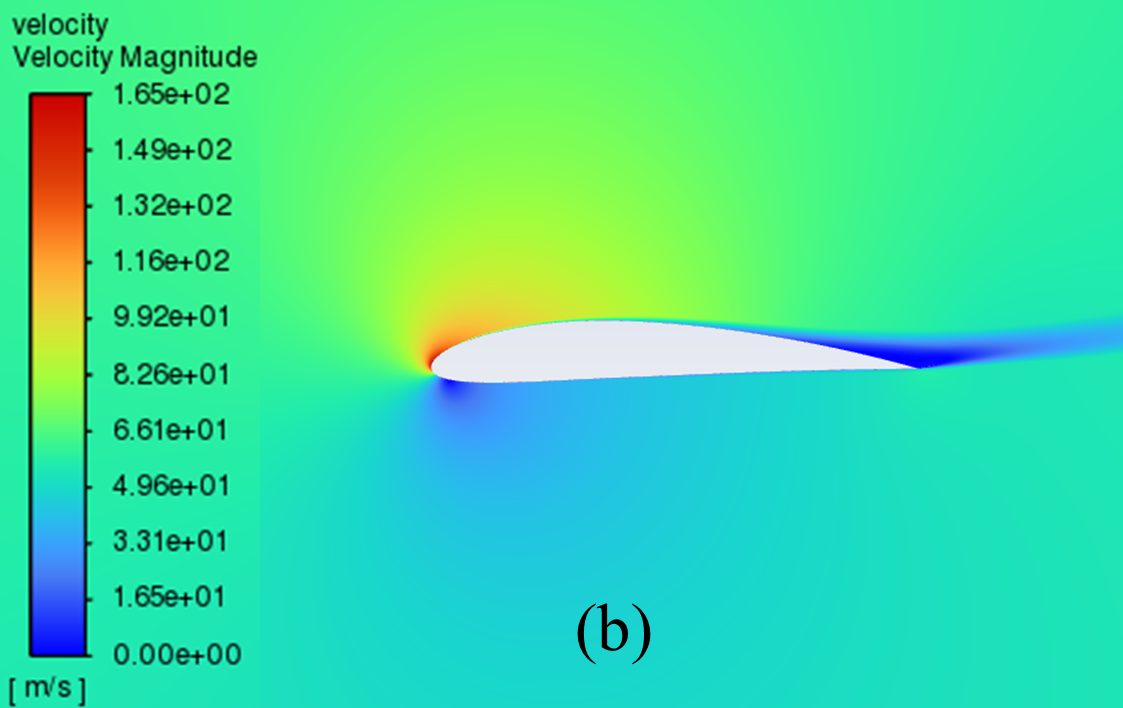
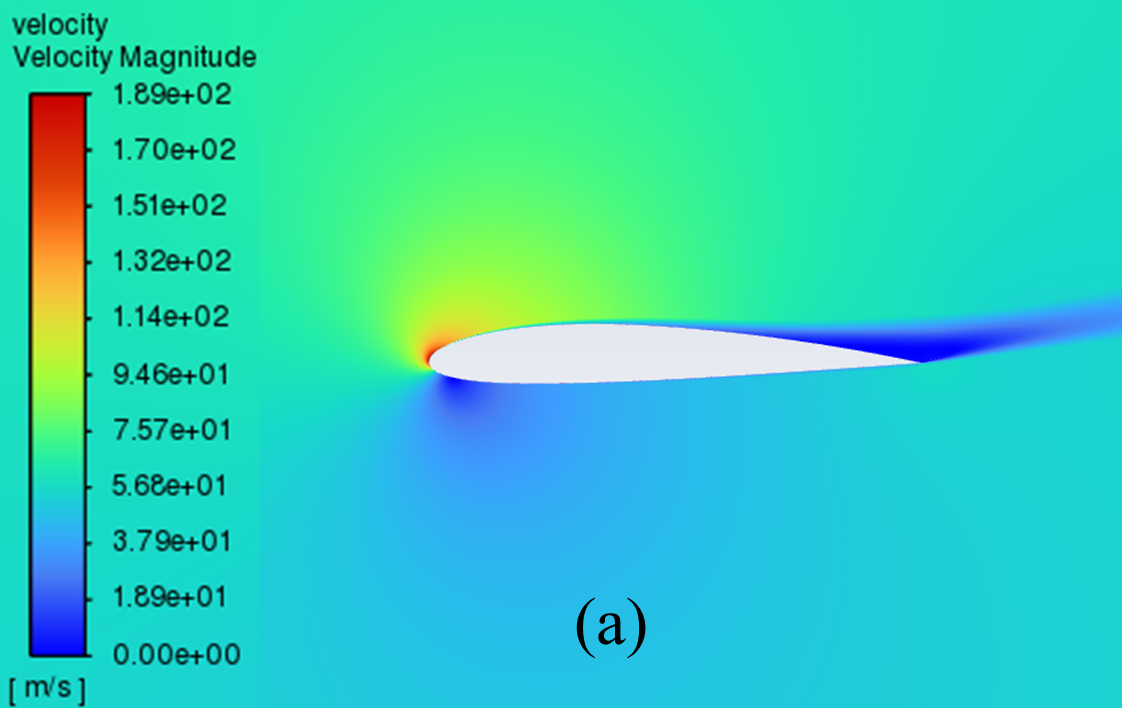
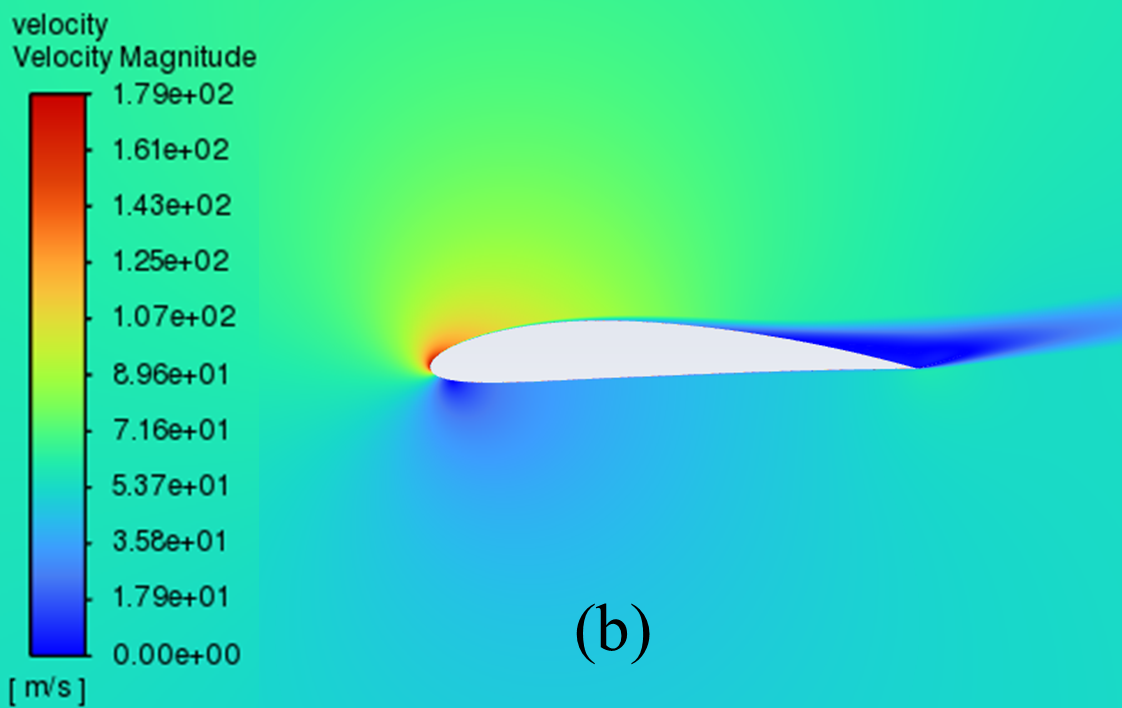
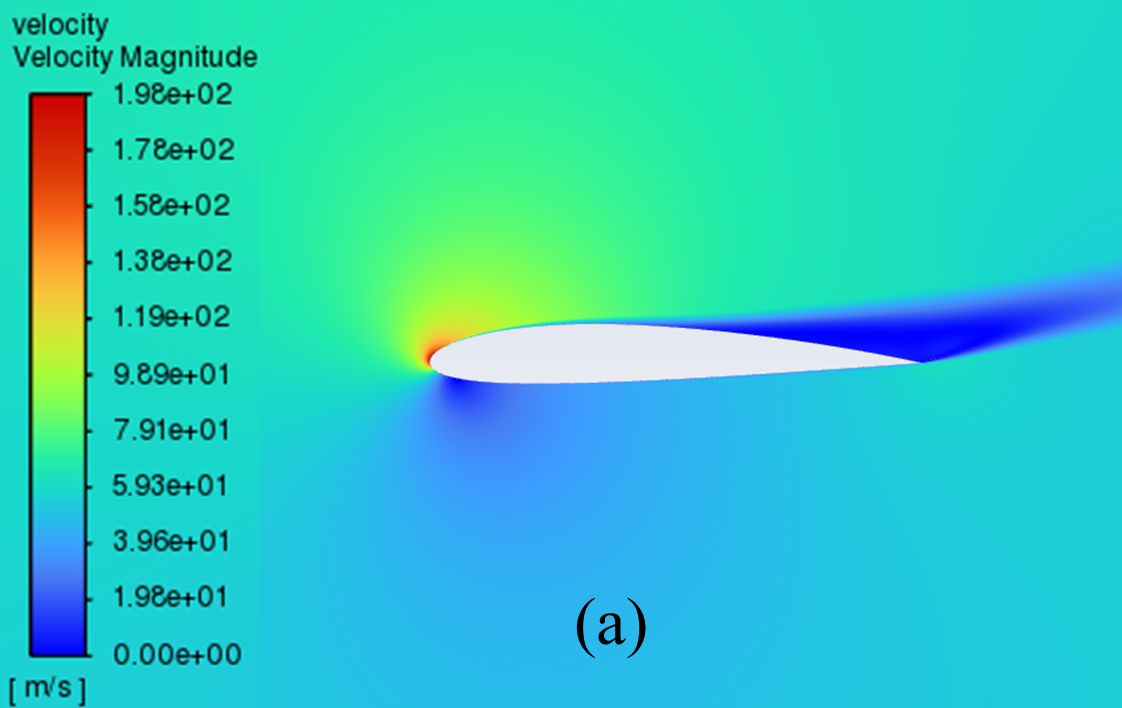
The velocity distribution cloud maps for NACA 2412 and NACA 4412 are respectively shown in Figure 6 for AOA ranging from 0° to 20°. As can be seen from the figure, according to Bernoulli's theory, with a low AOA, the upper surface of the aerofoil has a rapid airflow speed, which means that the upper surface pressure is low and the lift generated is large, which means that the pressure is low and the lift generation is large.
Concerning the trailing edge, it conforms to the Kuta condition, that is, when an object with a keen trailing edge moves through a fluid, it creates a circulation that keeps the trailing stagnation point at the trailing edge.
The flow pattern converges above and below the corner, meets and diverges from the fuselage, forming a stagnation point at the trailing edge. With the AOA growing, the airflow over the upper surface of the aerofoil gradually becomes less smooth enough, resulting in the separation point moving from the trailing edge to the forward edge.
0° AOA
2° AOA
4° AOA
6° AOA
8° AOA
10° AOA
12° AOA
14° AOA
16° AOA
18° AOA
20° AOA
Figure 6: Velocity cloud images: (a) NACA 2412, (b) NACA 4412
3.3. Comparison of aerodynamic characteristics
Lift and drag generated by two different aerofoils (generally referred to as aerodynamic force) are usually converted into aerodynamic coefficients (lift and drag coefficients) for solution and comparison, as shown in equations (9) and (10), where the L and the D are lift force and drag force respectively, the q stands for dynamic pressure, \( q=\frac{1}{2}ρ{ν^{2}} \) , while S stands for the aerofoil reference area.
\( {c_{L}}=\frac{L}{qS} \) (9)
\( {c_{D}}=\frac{D}{qS} \) (10)
Both the lift coefficient (CL) and the drag coefficient (CD) of two aerofoils at various AOA (α) are respectively specified in Table 2 and Table 3. In addition, the changing relationship between CL and CD and α is shown in Figure 7 and Figure 8 respectively.
Table 2: Lift coefficients CL of NACA2412 and NACA4412 aerofoils at different AOA
α (°) | CL 2412 | CL 4412 |
0 | 0.21248825 | 0.42621602 |
2 | 0.42973723 | 0.63984346 |
4 | 0.64301465 | 0.84952175 |
6 | 0.8518279 | 1.0528707 |
8 | 1.0532642 | 1.2459741 |
10 | 1.2429234 | 1.4237316 |
12 | 1.4136498 | 1.5780271 |
14 | 1.5539601 | 1.6970239 |
16 | 1.6432812 | 1.7625848 |
18 | 1.63946 | 1.7442237 |
20 | 1.4878131 | 1.5801629 |
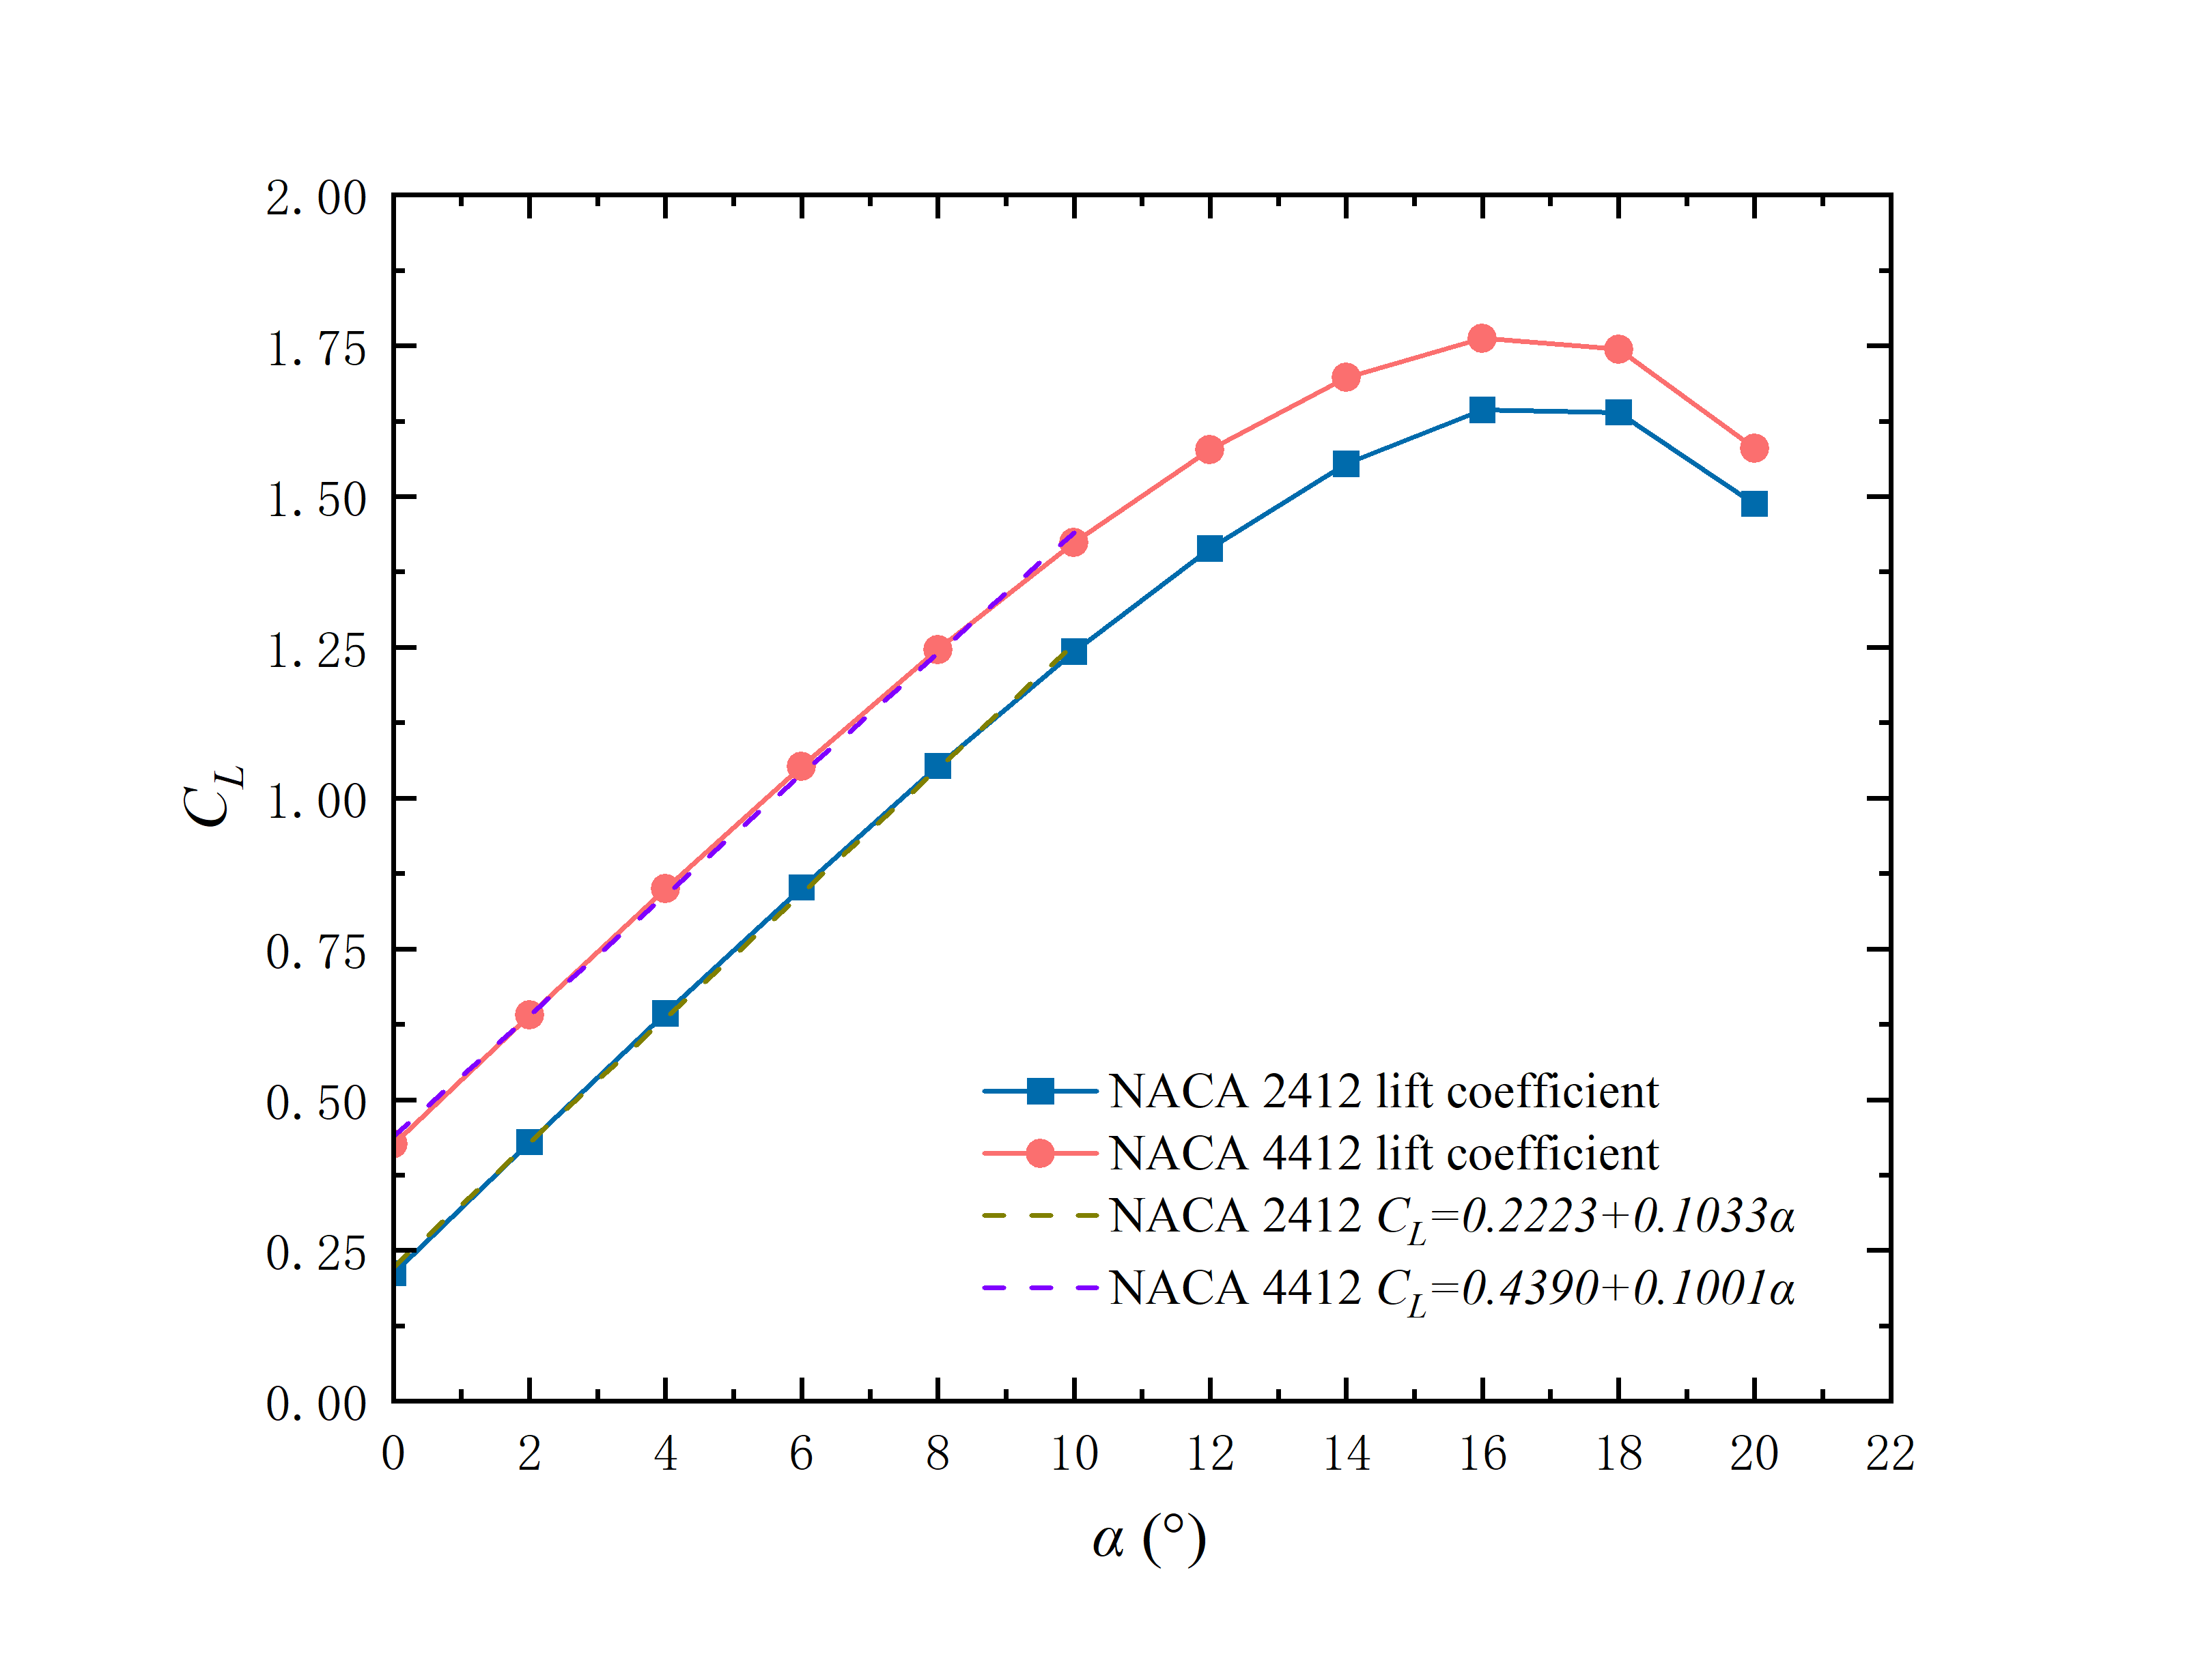
Figure 7: Variation law of lift coefficient CL with AOA
The results show that when the AOA is in the range from 0° to 10°, CL increases nearly linearly with the increase of α, which is mainly due to the airflow on the surface of the aerofoil to maintain adhesion flow state, and aerofoil can effectively generate lift force at this AOA. With the increase in α, the airflow velocity increases, generating a continuous decline in pressure on the aerofoil upper surface, thereby increasing the lift force. During the range from 10° to 16°, with the AOA continues to increase, the boundary layer of the aerofoil surface gradually thickens, resulting in the separation of surface flows and the formation of eddy currents in the wake region, resulting in the slowdown of lift growth. When the AOA reaches 16°, the lift coefficients of both two aerofoils reach the peak, and the AOA under this condition is identified as the stall angle.
The CL curves of the two aerofoils are shown in Figure 7. A linear increase of CL occurs from 0° to 10° AOA, and the corresponding linear relationship is obtained through origin fitting. The expression is as follows:
NACA 2412: \( {c_{L}}=0.2223+0.1033α \) (11)
NACA 4412: \( {c_{L}}=0.4390+0.1001α \) (12)
In addition, the changing trends of CD and CL in the early stage are the same, showing an increasing trend. However, as the AOA increases, the growth rate of CD continues to increase. This is mainly because, at a small AOA, the flow remains laminar, and the resistance increases at a relatively slow rate. However, when the AOA is further increased, especially above 10°, the flow begins to separate, forming eddies, which causes the pressure and resistance to rise rapidly, resulting in an increased growth rate of CD.
For the part of resistance coefficient CD of two aerofoils shown in Figure 8 that increases exponentially with the AOA from 12° to 20°, this paper obtains the corresponding exponential rate relationship through origin fitting, and the expression is as follows:
NACA 2412: \( {c_{D}}=0.0184+(5.355×{10^{4}}){e^{0.36361α}} \) (13)
NACA 4412: \( {c_{D}}=0.0147+(3.149×{10^{4}}){e^{0.27831α}} \) (14)
The lift-to-drag ratio K is defined as the ratio of lift to drag (i.e. the ratio of CL and CD) at the same AOA, which serves as a crucial parameter for assessing the aerodynamic properties of aircraft and representing the aerodynamic efficiency of aircraft during flight. The expression is as follows:
\( K=\frac{{C_{L}}}{{C_{D}}} \) (15)
From Figure 9, for lift-drag ratio K, the curves of the two aerofoils both illustrate trends of initially rising and then decreasing. The peak AOA of the aerofoils of NACA 2412 and NACA 4412 is 8° and 6° respectively. Then, with the increase of the AOA, the K of the two aerofoils decreases continuously, and the K of the NACA 4412 aerofoils is greater than that of the NACA 2412 aerofoils before and including the AOA of 12°. However, when the AOA is greater than 12°, the K of the NACA 4412 becomes lower than that of the NACA 2412, but the gap between them is also narrowing. At the AOA of 20°, although the K of the 4412 prevailed again, the difference in K between the two types of aerofoils is very small.
Table 3: Resistance coefficient CD of NACA2412 and NACA4412 aerofoil at different AOA
α (°) | CD 2412 | CD 4412 |
0 | 0.008961213 | 0.009702708 |
2 | 0.009622582 | 0.010749884 |
4 | 0.010806229 | 0.012301875 |
6 | 0.012526392 | 0.01437099 |
8 | 0.014847044 | 0.017020032 |
10 | 0.017892437 | 0.020411115 |
12 | 0.021947869 | 0.02274531 |
14 | 0.027656959 | 0.031425256 |
16 | 0.036838848 | 0.041995178 |
18 | 0.055026113 | 0.061181169 |
20 | 0.095612427 | 0.097301969 |
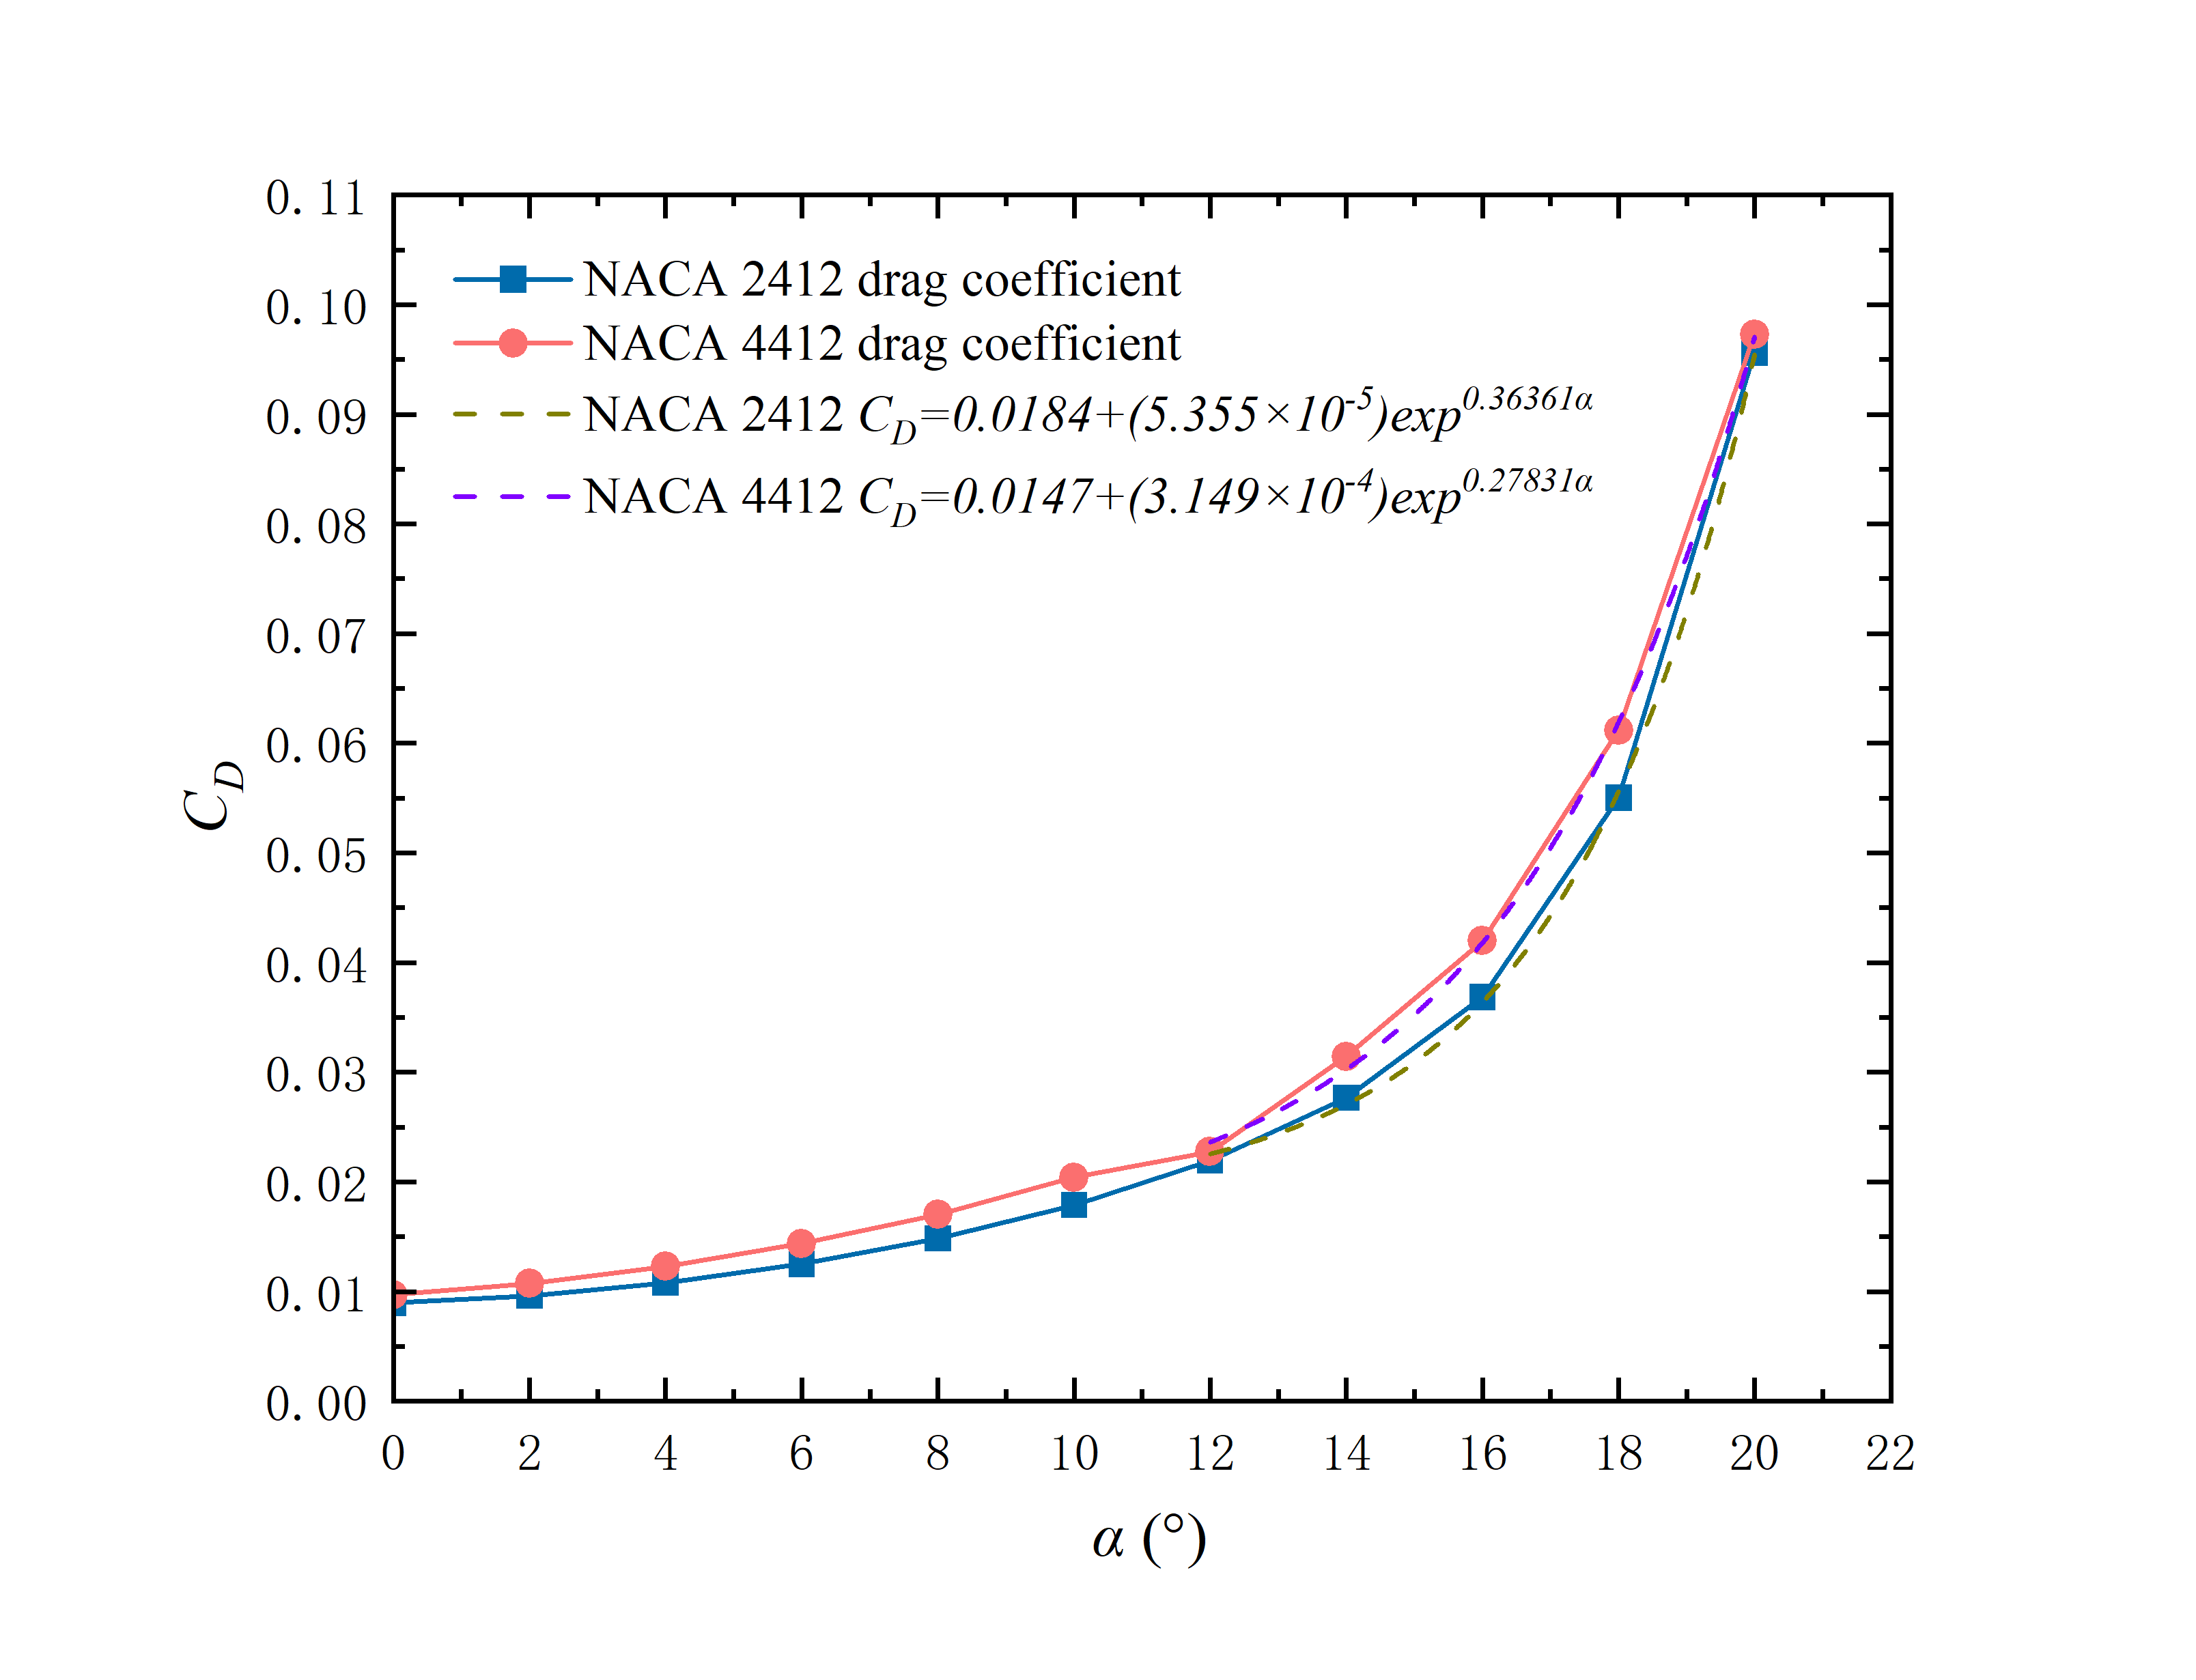
Figure 8: Variation law of resistance coefficient CD with AOA
Table 4: Lift-drag ratio K of NACA 2412 and NACA 4412 aerofoil at different AOA
α (°) | K 2412 | K 4412 |
0 | 23.71199715 | 43.92753421 |
2 | 44.65924555 | 59.52096413 |
4 | 59.50407399 | 69.05628207 |
6 | 68.00265392 | 73.26361649 |
8 | 70.94100348 | 73.20633122 |
10 | 69.46641198 | 69.75275971 |
12 | 64.4094331 | 69.37813114 |
14 | 56.18694738 | 54.00191171 |
16 | 44.60729065 | 41.97112345 |
18 | 29.79421788 | 28.5091595 |
20 | 15.56087578 | 16.23978339 |
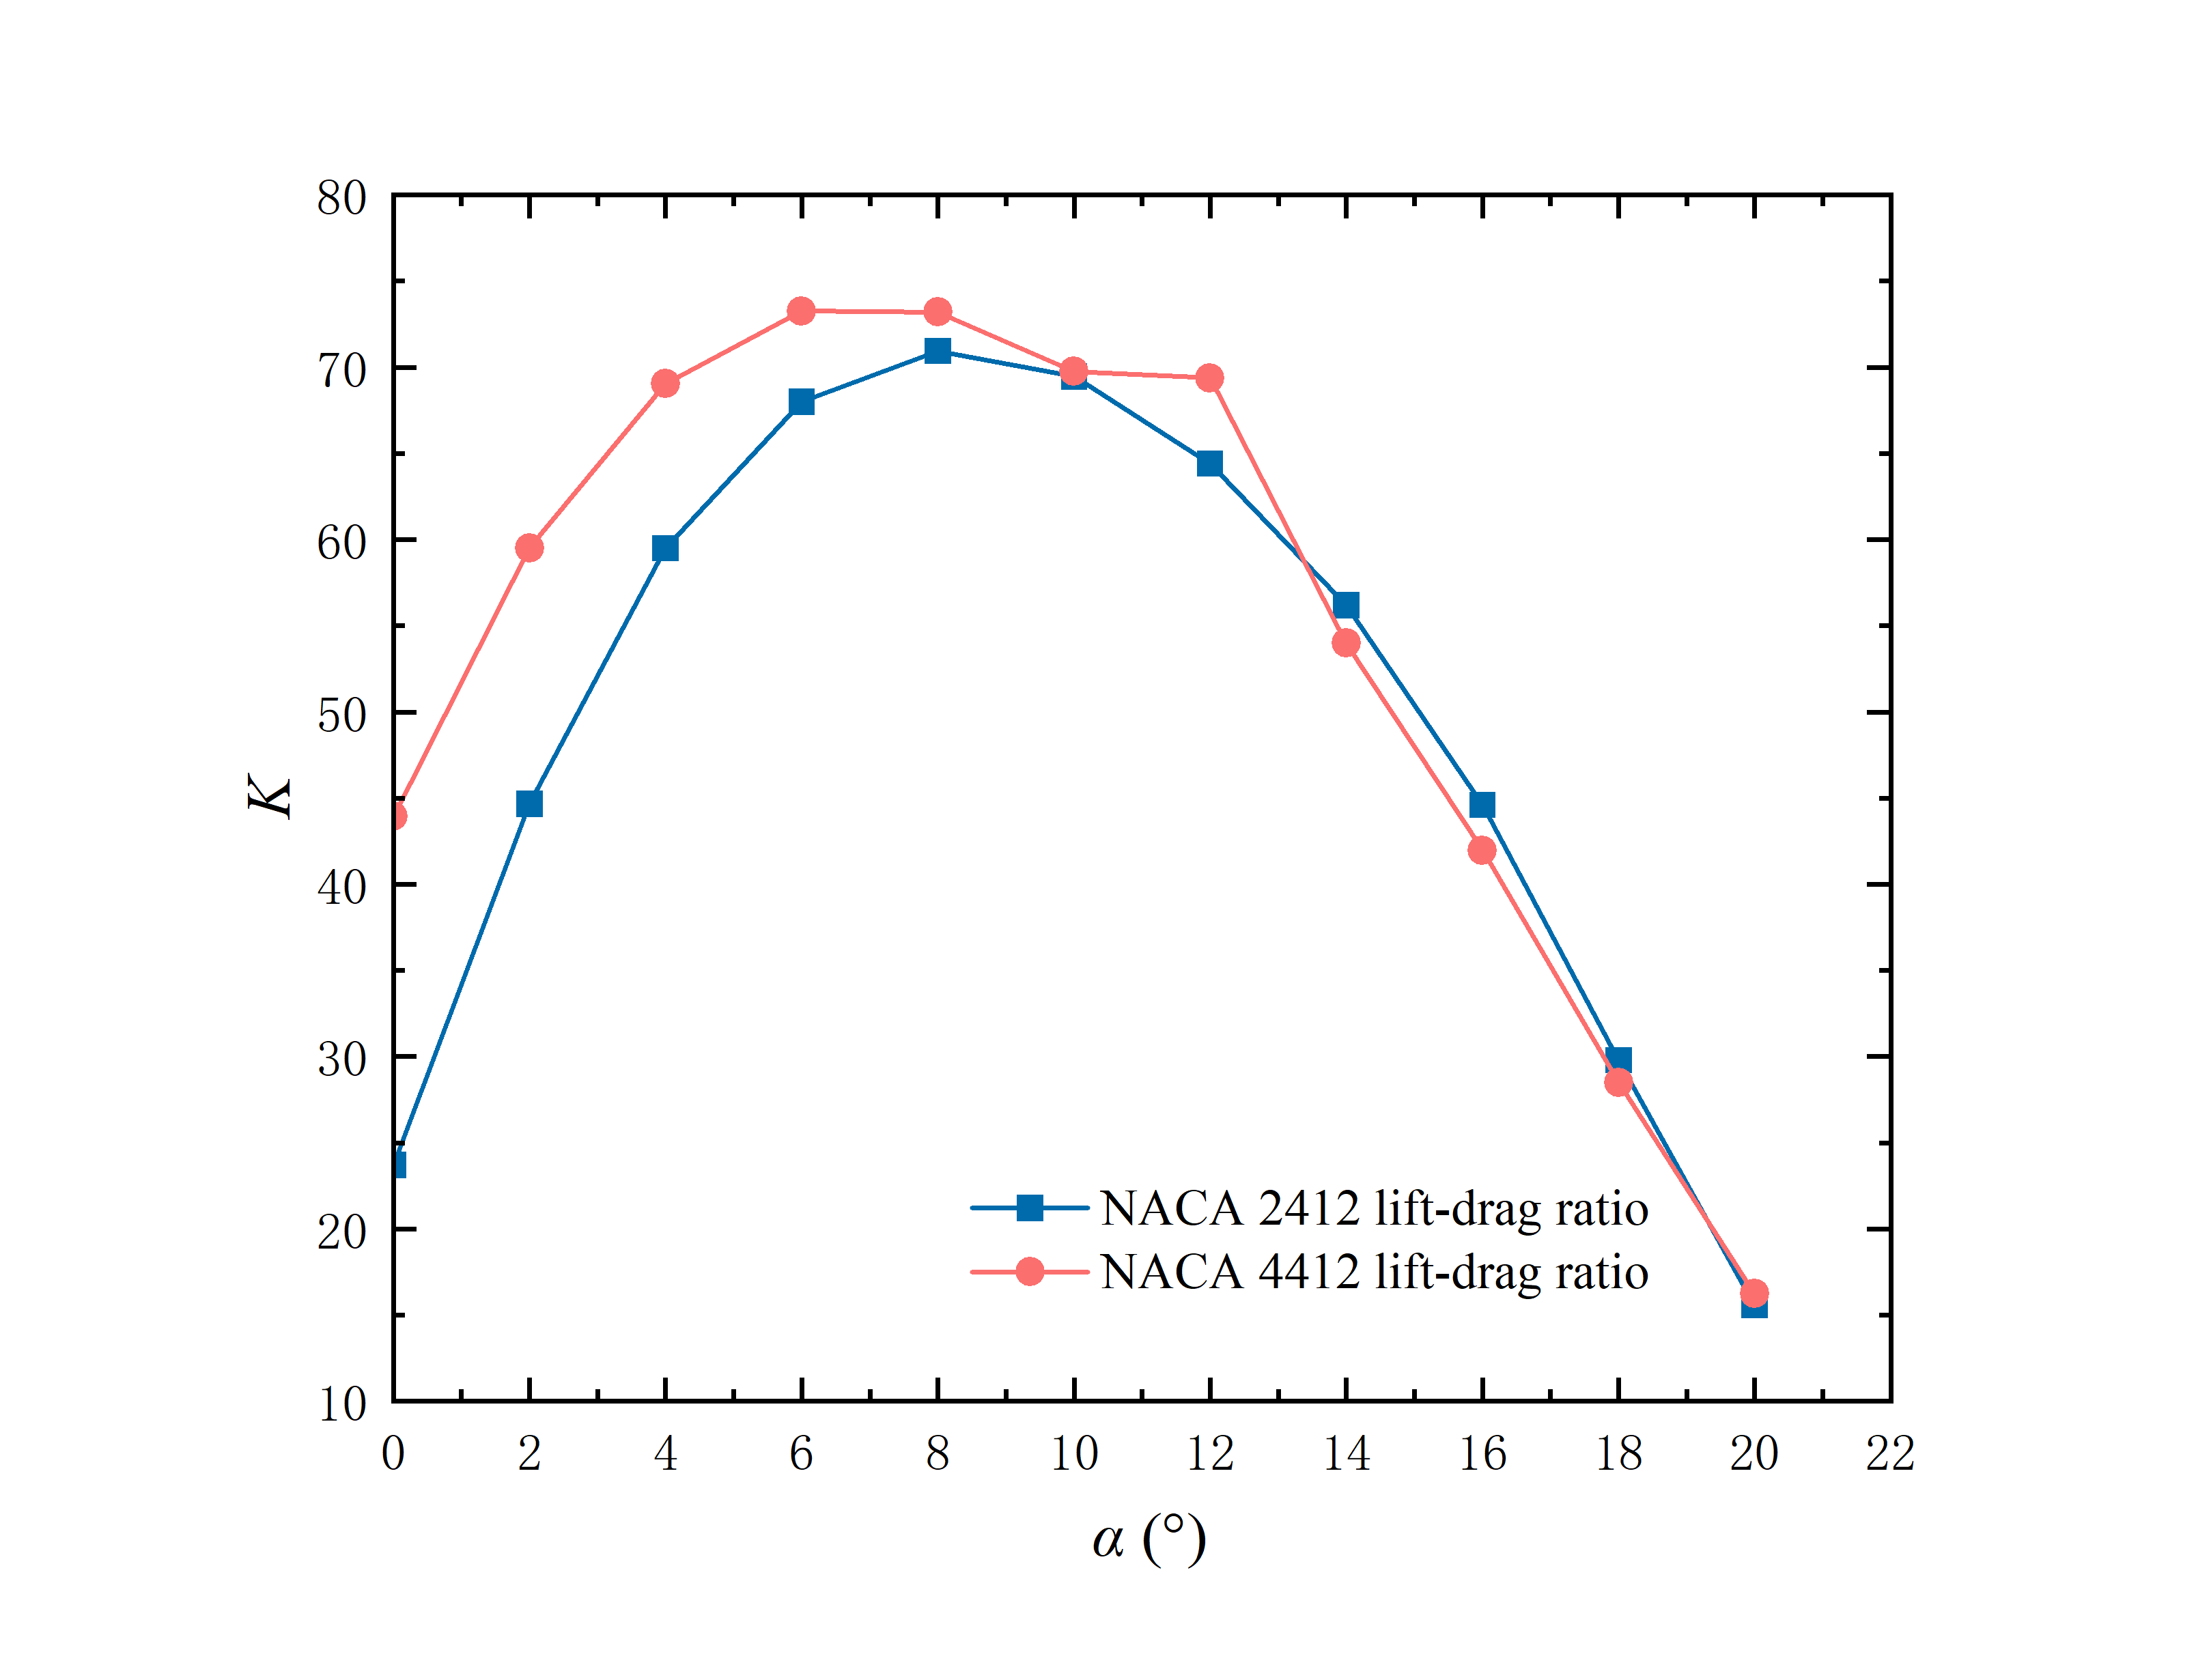
Figure 9: Variation law of lift-drag ratio K with AOA
4. Conclusion
Based on ANSYS Fluent, the aerodynamic characteristics of NACA 2412 and NACA 4412 aerofoils are compared under the condition of Reynolds number of 4×10⁶ and Angle of attack range of 0°~20°. The two-dimensional flow characteristics were simulated numerically employing the SST k-ω turbulence model and the finite volume method. The distribution of pressure and velocity for two aerofoils at different AOA were analysed, and both the lift coefficient (CL) and the drag coefficient (CD), as well as the lift drag ratio (K), were compared. The research conclusions of this paper are as follows:
For two aerofoils, the pressure centre of the zone of low pressure on the top surface gradually moved to the leading edge, and the flow separation near the trailing edge increased with the increase in the AOA. Concurrently, the pressure differential between the superior and inferior surfaces (as well as the resulting lift by the aerofoil) increases with the increase in the AOA.
Under the condition of low AOA (0° ~ 10°), the CL of NACA 2412 and NACA 4412 increases linearly with the increase of AOA, while under the condition of high AOA (10° ~ 16°), the increase rate of CL gradually decreases. When the AOA is 16°, it is the stall Angle of the two aerofoils. When the AOA is greater than 16°, the CL of the two aerofoils gradually decreases. The CD rises as the AOA increases, and the growth rate of the CD also rises with the growth of the AOA.
At 8°, the K of the NACA 2412 aerofoil reaches its peak value, and k of the NACA 4412 aerofoil reaches its peak value at 6°. Under this condition, the aerodynamic efficiency of the two aerofoils reaches the maximum respectively. Both CD and CL of the NACA 4412 aerofoil are greater than those of the NACA 2412 aerofoil under the same working condition. When the AOA is less than 10°, the K of NACA 4412 is greater than that of NACA 2412. After the AOA exceeds 10°, the K value of the NACA 2412 aerofoil exceeds that of the NACA 4412. Overall, NACA 4412 shows better aerodynamic performance than NACA 2412 at a small AOA (α ≤ 10°).
In light of the results from this study and the shortcomings of numerical methods, future work is further looked forward to after comprehensive consideration, and the changes in aerodynamic characteristics of NACA 2412 and 4412 with the angle of attack under different Reynolds number conditions are further explored in the future research plan.
References
[1]. Theodorsen T. (1979). General Theory of Aerodynamic Instability and the Mechanism of Flutter. No. NACA-TR-496. https://doi.org/10.1016/s0016-0032(35)92022-1
[2]. Versteeg H K. (2007). An introduction to computational fluid dynamics the finite volume method. 2/E. Pearson Education India.
[3]. Saha P, Kaberwal H S. (2020). Numerical Analysis of Aerodynamic Performance Characteristics of NACA 2312 and NACA 2412. International Journal of Innovative Science and Research Technology. Volume 5(Issue 3). https://doi.org/10.38124/IJISRT20MAR229
[4]. Nizama V, Supat J, Parikh M, et al. (2024). Aerodynamic characteristics of NACA 0012 and NACA 2412 aerofoils at low Reynolds number. AIP Conference Proceedings. Vol. 3107. No. 1. AIP Publishing. https://doi.org/10.1063/5.0208454
[5]. Soetanto M F, Sugianto S, Hartono B. (2023). Numerical Study of Aerodynamic Characteristics of Airflow Around NACA 0012 and NACA 4412 Airfoils at Re= 170000. International Journal Applied Technology Research, 4(2). https://doi.org/10.35313/ijatr.v4i2.134
[6]. Dhakal S, Bhattarai K R, Sanjay M. (2023). Computational Analysis of the Aerodynamic Performance of NACA 4412 and NACA 23012 Airfoils. International Research Journal of Engineering and Technology. Volume 10(Issue 12). https://doi.org/10.13140/RG.2.2.31495.37284
[7]. Ashley H, Landhal M. (1965). Aerodynamics of Wings and Bodies. Journal of Fluid Mechanics. Volume 27(Issue 2). https://doi.org/10.1017/S0022112067210436
[8]. Menter, F.R. (1993). Zonal two equation kw turbulence models for aerodynamic flows. AIAA paper 93-2906. https://doi.org/10.2514/6.1993-2906.
[9]. Menter, F.R. (1994). Two-equation eddy-viscosity turbulence models for engineering applications. AIAA Journal, Volume 32, no 8. pp. 1598-1605. https://doi.org/10.2514/3.12149
Cite this article
Zhang,R. (2025). Numerical Analysis of Aerodynamic Performance Characteristics of NACA 2412 and NACA 4412 at Re = 4000000. Applied and Computational Engineering,130,9-22.
Data availability
The datasets used and/or analyzed during the current study will be available from the authors upon reasonable request.
Disclaimer/Publisher's Note
The statements, opinions and data contained in all publications are solely those of the individual author(s) and contributor(s) and not of EWA Publishing and/or the editor(s). EWA Publishing and/or the editor(s) disclaim responsibility for any injury to people or property resulting from any ideas, methods, instructions or products referred to in the content.
About volume
Volume title: Proceedings of the 5th International Conference on Materials Chemistry and Environmental Engineering
© 2024 by the author(s). Licensee EWA Publishing, Oxford, UK. This article is an open access article distributed under the terms and
conditions of the Creative Commons Attribution (CC BY) license. Authors who
publish this series agree to the following terms:
1. Authors retain copyright and grant the series right of first publication with the work simultaneously licensed under a Creative Commons
Attribution License that allows others to share the work with an acknowledgment of the work's authorship and initial publication in this
series.
2. Authors are able to enter into separate, additional contractual arrangements for the non-exclusive distribution of the series's published
version of the work (e.g., post it to an institutional repository or publish it in a book), with an acknowledgment of its initial
publication in this series.
3. Authors are permitted and encouraged to post their work online (e.g., in institutional repositories or on their website) prior to and
during the submission process, as it can lead to productive exchanges, as well as earlier and greater citation of published work (See
Open access policy for details).
References
[1]. Theodorsen T. (1979). General Theory of Aerodynamic Instability and the Mechanism of Flutter. No. NACA-TR-496. https://doi.org/10.1016/s0016-0032(35)92022-1
[2]. Versteeg H K. (2007). An introduction to computational fluid dynamics the finite volume method. 2/E. Pearson Education India.
[3]. Saha P, Kaberwal H S. (2020). Numerical Analysis of Aerodynamic Performance Characteristics of NACA 2312 and NACA 2412. International Journal of Innovative Science and Research Technology. Volume 5(Issue 3). https://doi.org/10.38124/IJISRT20MAR229
[4]. Nizama V, Supat J, Parikh M, et al. (2024). Aerodynamic characteristics of NACA 0012 and NACA 2412 aerofoils at low Reynolds number. AIP Conference Proceedings. Vol. 3107. No. 1. AIP Publishing. https://doi.org/10.1063/5.0208454
[5]. Soetanto M F, Sugianto S, Hartono B. (2023). Numerical Study of Aerodynamic Characteristics of Airflow Around NACA 0012 and NACA 4412 Airfoils at Re= 170000. International Journal Applied Technology Research, 4(2). https://doi.org/10.35313/ijatr.v4i2.134
[6]. Dhakal S, Bhattarai K R, Sanjay M. (2023). Computational Analysis of the Aerodynamic Performance of NACA 4412 and NACA 23012 Airfoils. International Research Journal of Engineering and Technology. Volume 10(Issue 12). https://doi.org/10.13140/RG.2.2.31495.37284
[7]. Ashley H, Landhal M. (1965). Aerodynamics of Wings and Bodies. Journal of Fluid Mechanics. Volume 27(Issue 2). https://doi.org/10.1017/S0022112067210436
[8]. Menter, F.R. (1993). Zonal two equation kw turbulence models for aerodynamic flows. AIAA paper 93-2906. https://doi.org/10.2514/6.1993-2906.
[9]. Menter, F.R. (1994). Two-equation eddy-viscosity turbulence models for engineering applications. AIAA Journal, Volume 32, no 8. pp. 1598-1605. https://doi.org/10.2514/3.12149