


1. Introduction
Sleep plays an essential part in our lives as we spend one-third of our time sleeping. Despite the growing recognition of the importance of sleep, the prevalence of sleep disorders such as insomnia was about 30% [1]. The current gold standard in accessing sleep is polysomnography (PSG), providing a comprehensive evaluation. However, the need for a sleep technologist to set up the equipment and the discomfort associated with the sensors and wiring can negatively impact sleep quality [2], resulting in an inaccurate representation of the subject’s sleep and not being used in long-term sleep monitoring. Therefore, there is a growing need for at-home sleep assessment solutions that effectively detect disorders in their early stages while being easy to use. In this review, we present an overview of the recent developments in wearable sensors and electronics and propose the advantages and limitations of each device in the application of sleep assessment. The new tool ear-EEG and the other devices are compared in terms of accuracy, comfort level, prices, and feasibility. Finally, we discuss these home-use sleep monitoring systems' current challenges and future development.
2. Electrocardiogram (ECG)
2.1. Definition and functions
An electrocardiogram (ECG) uses electrodes to record the heart's electrical activity. Figure 1 shows the three limb leads in an ECG created by placing electrodes on the right arm, left arm, and left leg.
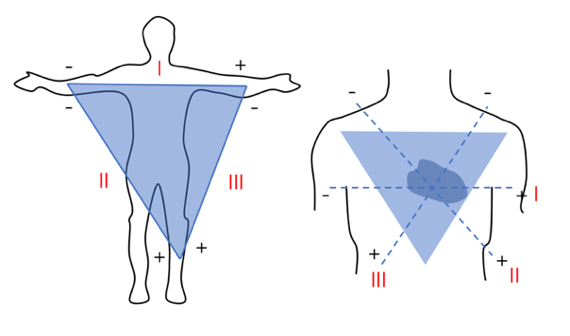
Figure 1. Placement of three limb leads (l, ll, lll), forming the Einthoven’s triangle.
2.2. Key studies
One of the studies compared the accuracy of detecting Obstructive Sleep Apnea (OSA) (when sleep is interrupted by abnormal breathing) using an ECG against the gold standard PSG[3]. The study recruited 205 adults with suspected OSA. The Apnea-Hypopnea Index (AHI) derived from the PSG recordings was used to diagnose and classify the severity of OSA. ECG recordings were taken simultaneously during the PSG study, and the cardiopulmonary coupling-derived respiratory event index (CPC-REI) was calculated. The CPC-REI was significantly correlated to the PCG-AHI (r=0.838, p<0.001). The accuracy of ECG in detecting OSA in moderate to severe cases was highly agreed with the manually scored AHI.
Another study conducted introduces a Deep Convolutional Recurrent (DCR) model, integrating convolutional and recurrent neural networks for sleep stage scoring from a single-lead ECG signal, displayed in Figure 2C[4]. The convolutional layers capture local ECG patterns, and the recurrent layers capture temporal dependencies. The study utilised PSG recordings from 52 healthy and 60 OSA patients, shown in Figure 2A, with ECG signals collected as in Figure 2B. Finally, the DCR model was evaluated using PSG data, achieving accuracies of 86.4% for three-class and 74.2% for five-class sleep staging, classified in Figure 2D.
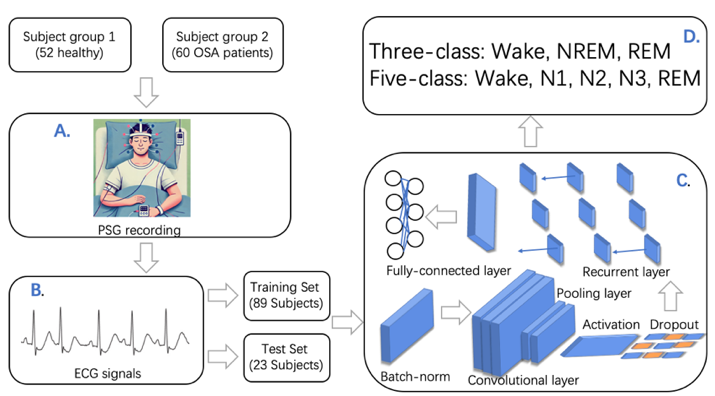
Figure 2. (A) study participants and setup of PSG (B) ECG dataset (C) DCR model (D)three-class and five-class sleep staging.
2.3. Advantages and limitations
Since ECG provides heart rate variability (HRV) data, the autonomic nervous system activity can be indicated, and different sleep stages can be classified. However, ECG signals exhibit the characteristics of non-linear and non-stationary noises, making signal processing challenging as the signals vary over time and can be altered by external factors [3].
3. Photoplethysmography (PPG)
3.1. Definition and function
Photoplethysmography (PPG) is an optical technique that measures blood volume changes in the skin related to cardiac activity, allowing indirect monitoring of heart rate and heart rate variability (HRV) [5]. Its process is shown in Figure 3. Initially, denoising is processed to minimize interference to the signal. Following this, different peak detection algorithms will be used to identify feature points. The feature extraction phase transforms the signal into time, frequency, and non-linear domains for feature extraction. PPG is now widely used in medical devices for physiological monitoring and consumer wearables for health tracking and sleep monitoring.
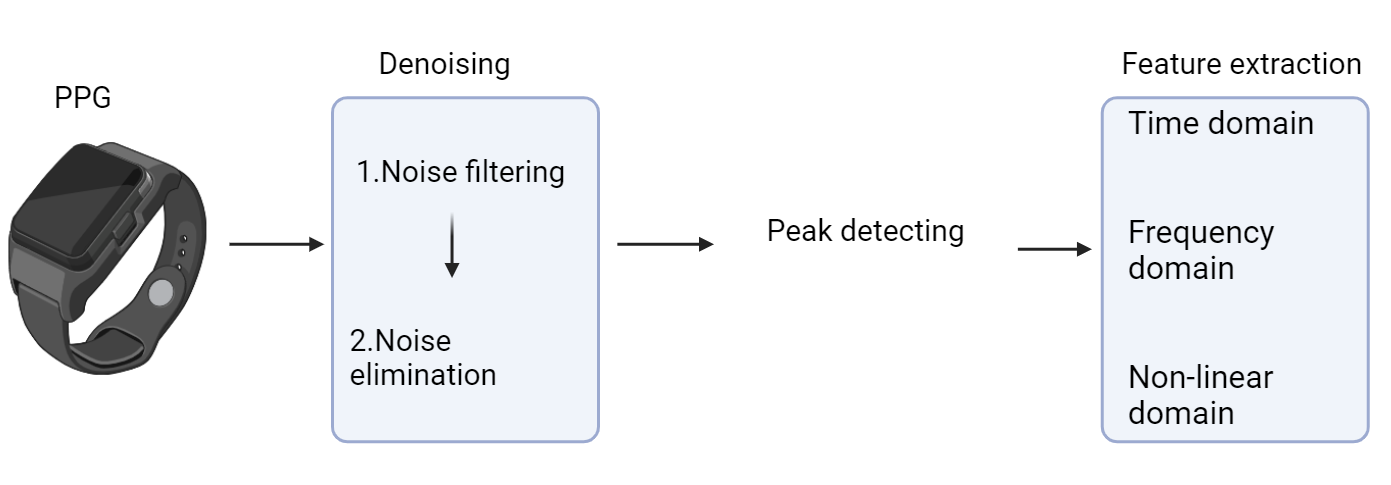
Figure 3. Working process overview of PPG.
3.2. Key studies
In one of the studies [6], researchers evaluated a way to detect sleeping disorders; this experiment evaluated the possibility and reliability of using finger PPG to detect central sleep apnea (CSA). The experiment included 266 patients with suspected sleep apnea (SA), who may have obstructive sleep apnea (OSA), central sleep apnea (CSA), or both. To verify the utility of PPG in detecting CSA, researchers conducted laboratory polysomnography (PSG) and PPG data collection for each patient simultaneously. In the outcome evaluation phase, sensitivity, specificity, accuracy, and Cohen's Kappa were calculated at different Central apnea hypopnea Index (CAHI) cut-off values (5, 10, and 15). At a cAHI cut-off value of 10, the method achieved high sensitivity and specificity, showing excellent performance. In summary, this experiment proposes a novel approach for detecting CSA by using non-invasive finger PPG signals to aid sleep apnea diagnosis and treatment.
3.3. Advantages and limitation
The PPG technique combines several advantages, such as non-invasive monitoring, convenience, real-time monitoring, and a wide range of application occasions. Due to its portability and micro size, it can provide real-time health feedback, and it’s easy to integrate the data into the device. However, the accuracy of PSG still needs to be improved.
4. Actigraphy
4.1. Definition and function
Actigraphy uses wristwatch-like devices to detect sleep-wake patterns by recording body movements. It is widely used for the diagnosis of sleep-related disorders [7]. Its working process is shown in figure 4.
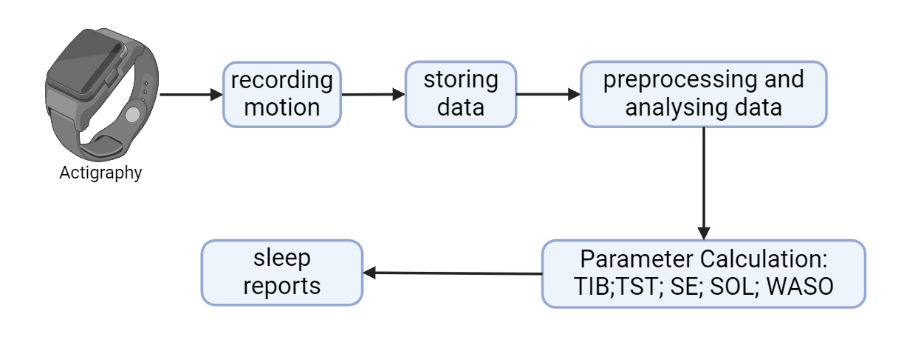
Figure 4. Working process overview of actigraphy.
Actigraphy gains data on sleep-wake patterns by recording body motion. Then, through data preprocessing and analysis, we get information on some parameter calculations: time in bed (TIB), total sleep time (TST), sleep efficiency (SE), sleep latency (SL), and wake after sleep onset (WASO).
4.2. Key studies
Accuracy of actigraphy was established by many studies from different regions and including subjects with varying age ranges, such as the Study of Women’s Health Across the Nation. ( \( n=323 \) , aged 48–57 years) [8]. Information gained from PSG and wrist actigraphy was collected simultaneously in participants’ homes over three nights. Multivariable repeated-measures linear models were employed to compare TST, SE, SL, and WASO across different measurement methods. According to the data, actigraphy and PSG (the gold standard) produced similar estimates of sleep duration (TIB, TST) and efficiency (SE, SL, WASO).
Another study ( \( n=22 \) , aged 23.9 \( (± 3.8) \) years) shows a similar conclusion, in which two nights of sleep were recorded at the same time with polysomnography (PSG), two activity monitors (actigraphy) and a partial-PSG system [9]. Agreement with PSG was assessed per-epoch basis and through summary metrics, including TST and WASO. According to the data, all devices demonstrated high relative accuracy for identifying sleep-wake patterns. Still, the partial-PSG system was the highest, with an agreement of 91.6 %, while the actigraphy shows a medium threshold of 87.7 %.
4.3. Advantages and limitations
According to previous research, actigraphy's comfort level and accuracy are relatively high [10,8]. However, it can only detect sleep-wake patterns, which leads to limited derivable information. For example, actigraphy has not been validated for measuring sleep stages, and results from limited experiments show that the accuracy is both low and unstable [11,12]. In addition, the accuracy is still expected to improve compared to the gold standard PSG.
5. Ear-EEG
5.1. In Ear-EEG: Generic and Custom-designed
In-ear electroencephalography (EEG) uses electrodes in the ear canal for long-term monitoring, especially during sleep, to study brain activity, detect sleep disorders, and understand sleep stages. Generic ear-EEG devices, made from flexible materials to fit various ear shapes and sizes, are designed for convenience and broad usability, though they may sacrifice signal quality. In contrast, custom ear-EEG devices are molded to an individual's ear for superior fit and signal quality, making them ideal for precise medical diagnostics and advanced research where accuracy is crucial.
5.2. In Ear-EEG Key Studies
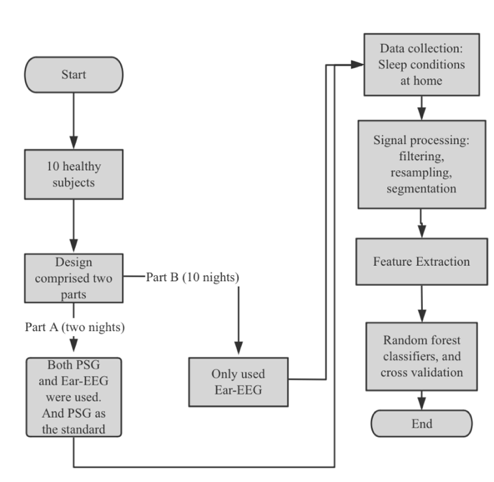
Figure 5. Flowchart of the study design and critical steps for generic and custom-designed ear-EEG. [13].
The study is shown in Fig. 5. involved ten healthy subjects in two parts. Part A included two nights of recordings using Ear-EEG and polysomnography (PSG) to assess sleep stage classification and comfort, with PSG as the reference. Part B involved ten nights of recordings using only Ear-EEG. Data was collected at home, processed, and analyzed using a random forest classifier, with Cohen's kappa measuring agreement between classifier output and PSG scoring. Additionally, the study compared custom-designed Ear-EEG with actigraphy in 20 subjects over 80 recordings. The comparison focused on Cohen's kappa values, showing that Ear-EEG had higher accuracy in sleep stage classification than actigraphy.
5.3. Around Ear-EEG Key Studies
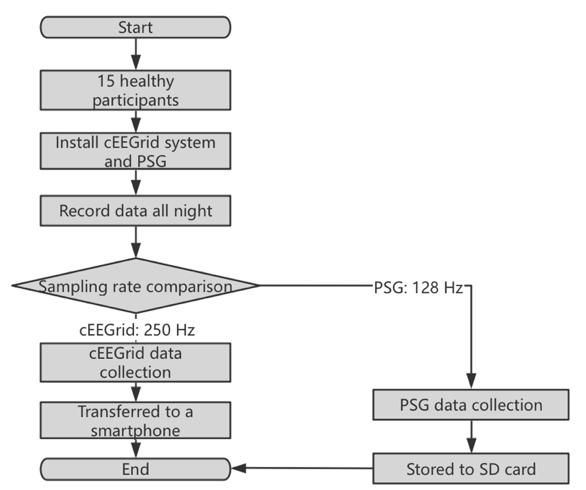
Figure 6. Flowchart of the study [14].
Fifteen participants were used by cEEGrid and PSG systems for overnight data recording and comparison.
A study in Fig. 6 involved fifteen subjects (six males, average age 35.3 years) comparing sleep EEG recordings between cEEGrid and standard PSG systems. The PSG used six scalp electrodes with ECG, EOG, and EMG, recording at 128 Hz, while the cEEGrid had ten electrodes behind the ear, recording at 250 Hz via Bluetooth [14].
Participants underwent health checks, were fitted with both systems and recorded data overnight. Average recording times were 11 hours 47 minutes for PSG and 11 hours 10 minutes for cEEGrid. The kappa statistic for sleep stage agreement was moderate (0.42), with better agreement in wake/sleep states (kappa 0.55). Bland-Altman analysis showed good agreement for nine 13 sleep parameters but noted differences in N2, N3, and sleep onset latency. Overall, the cEEGrid had a 58.5% agreement in sleep phase classification, indicating it can recognize sleep stages but needs improvement to match PSG accuracy.
A study in Fig. 7 evaluated a flexible printed ear-EEG sensor (cEEGrid) for home sleep monitoring with ten participants (eight women, two men, mean age 28.4 years). Each provided one night of sleep data using the cEEGrid and a portable amplifier. Additional electrodes were placed at Fpz, EOG_L, and EOG_R. Signals were recorded wirelessly at 250 Hz, then pre-processed with channel selection, bandpass filtering (0.5-40 Hz), and down-sampling to 125 Hz. Experts labeled 30-second segments using Fpz+EOG, cEEGrid, and cEEGrid+EOG per AASM guidelines. Cohen's kappa showed 0.67 for cEEGrid alone and 0.75 with EOG, indicating good consistency with PSG. Retest reliability for Fpz+EOG was 0.78. The study concluded that cEEGrid effectively monitors sleep stages at home, with improved accuracy when EOG channels are included, supporting its potential for diagnosing sleep disorders.
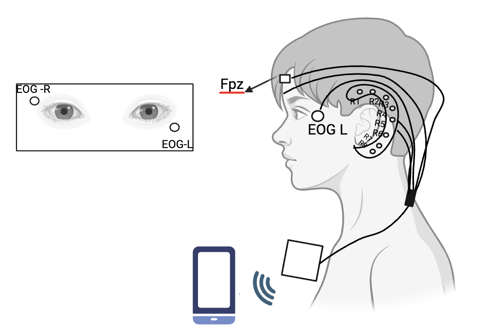
Figure 7. The study design in [15].
The study includes Frontal Pole Zero (Fpz), EOG_L, EOG_R, and R1-R8 electrodes positioned behind the ear and a system that transmits data wirelessly to a smartphone via Bluetooth.
Table 1. Comparisons for sleep monitoring devices regarding accuracy distinguish five sleep stages: comfort level, price, and annual usage.
Devices | Accuracy compared to PSG/% (Five sleep stages: N1, N2, N3, REM and wake) | Comfort Level | Price/$ | Annual Usage /Million |
ECG | 74.2 [4] | Low | 200-500 | 300-400 |
PPG | 59.3 | High | 100-500 | 400-500 |
Actigraphy | Not necessarily capable of five-class sleep staging [11] | High [10] | 100-300 | 20-50 |
Around Ear-EEG: cEEGrid | 58.5 | Medium | 200-400 | Not typically adopted in public |
In Ear-EEG | 89 [16] | High [13] | Generic: 400-600 Custom- designed: 700-1000 | Generic: 300-400 Custom- designed: 100-200 |
6. Results
As shown in Table 1, ear-EEG has the highest accuracy compared to polysomnography (PSG) at 89%, indicating its potential for recognizing five sleep stages. Conversely, PPG and Around Ear-EEG exhibit lower accuracy rates of 59.3% and 58.5%, respectively. For custom-designed ear-EEG, the price is 700-1000, which is relatively high compared with other devices. Actigraphy only distinguishes between sleep and wake states, lacking the granularity needed for detailed sleep stage analysis. PPG and In Ear-EEG are rated as highly comfortable, making them more suitable for long-term use. ECG is noted for its low comfort level, which might limit its feasibility for some users.
7. Conclusion
The medium comfort rating of Around Ear-EEG indicates a balance between usability and invasiveness. While higher accuracy and comfort often come with increased costs, as seen with custom-designed Ear-EEG, the choice of sleep monitoring method should be tailored to individual needs, balancing accuracy, comfort, and cost. PPG is widely used for its high comfort, while the more accurate but expensive In Ear-EEG is less utilized. Future research should aim to improve noninvasive, comfortable methods for broader accessibility and user-friendliness. Additionally, studies should include a wider age range to ensure generalizability [12], especially given the differing sleep patterns of children and the elderly. Enhancing accuracy in determining sleep stages, mainly N1 is also crucial. In summary, the future of sleep monitoring research lies in addressing these limitations by including a broader age range in studies and improving the accuracy of sleep stage determination. These advancements will provide more reliable, personalized sleep monitoring solutions and effectively detect sleep disorders.
References
[1]. Marshall, S. (2024) Sleep Statistics and Facts About Sleep Deprivation. https://www.ncoa.org/adviser/sleep/sleep-statistics/#:~:text=About%2030%25%20of%20adults%20have
[2]. Van De Water, A. T. M., Holmes, A., Hurley, D. A. (2011). Objective measurements of sleep for non-laboratory settings as alternatives to polysomnography - a systematic review. Journal of Sleep Research, 20(1pt2), 183–200.
[3]. Ma, Y., Sun, S., Zhang, M., Guo, D., Liu, A. R., Wei, Y., Peng, C.-K. (2020). Electrocardiogram-based Sleep Analysis for Sleep Apnea Screening and Diagnosis. Sleep & Breathing = Schlaf & Atmung, 24(1), 231–240.
[4]. Urtnasan, E., Park, J.-U., Joo, E. Y., & Lee, K.-J. (2022). Deep Convolutional Recurrent Model for Automatic Scoring Sleep Stages Based on Single-Lead ECG Signal. Diagnostics, 12(5), 1235.
[5]. Fonseca, P., Weysen, T., Goelema, M. S., Møst, E. I. S., Radha, M., Lunsingh Scheurleer, C., van den Heuvel, L., & Aarts, R. M. (2017). Validation of Photoplethysmography-Based Sleep Staging Compared With Polysomnography in Healthy Middle-Aged Adults. Sleep, 40(7).
[6]. Massie, F., Vits, S., Khachatryan, A., Bart Van Pee, Johan Verbraecken, & Bergmann, J. (2023). Central Sleep Apnea Detection by Means of Finger Photoplethysmography. IEEE Journal of Translational Engineering in Health and Medicine, 11, 126–136.
[7]. Sadeh, A., & Acebo, C. (2002). The role of actigraphy in sleep medicine. Sleep Medicine ¬¬¬Reviews, 6(2), 113–124.
[8]. Lehrer, H. M., Yao, Z., Krafty, R. T., Evans, M. A., Buysse, D. J., Kravitz, H. M., Matthews, K. A., Gold, E. B., Harlow, S. D., Samuelsson, L. B., & Hall, M. H. (2022). Comparing polysomnography, actigraphy, and sleep diary in the home environment: The Study of Women’s Health Across the Nation (SWAN) Sleep Study. SLEEP Advances, 3(1).
[9]. Kosmadopoulos, A., Sargent, C., Darwent, D., Zhou, X., & Roach, G. D. (2014). Alternatives to polysomnography (PSG): A validation of wrist actigraphy and a partial-PSG system. Behavior Research Methods, 46(4), 1032–1041.
[10]. Kamdar, B. B., Kadden, D. J., Vangala, S., Elashoff, D. A., Ong, M. K., Martin, J. L., & Needham, D. M. (2017). Feasibility of Continuous Actigraphy in Patients in a Medical Intensive Care Unit. American Journal of Critical Care, 26(4), 329–335.
[11]. Yuan, H., Hill, E. A., Kyle, S. D., & Doherty, A. (2024). A systematic review of the performance of actigraphy in measuring sleep stages. Journal of Sleep Research.
[12]. Mikkelsen, K. B., Villadsen, D. B., Otto, M., & Kidmose, P. (2017). Automatic sleep staging using ear-EEG. BioMedical Engineering OnLine, 16(1).
[13]. Tabar, Y. R., Mikkelsen, K. B., Shenton, N., Kappel, S. L., Bertelsen, A. R., Nikbakht, R., Toft, H. O., Henriksen, C. H., Hemmsen, M. C., Rank, M. L., Otto, M., & Kidmose, P. (2023). At-home sleep monitoring using generic ear-EEG. Frontiers in Neuroscience, 17.
[14]. Sterr, A., Ebajemito, J. K., Mikkelsen, K. B., Bonmati-Carrion, M. A., Santhi, N., della Monica, C., Grainger, L., Atzori, G., Revell, V., Debener, S., Dijk, D.-J., & DeVos, M. (2018). Sleep EEG Derived From Behind-the-Ear Electrodes (cEEGrid) Compared to Standard Polysomnography: A Proof of Concept Study. Frontiers in Human Neuroscience, 12.
[15]. Carlos, Wiebke Pätzold, Karen Insa Wolf, Paul, M., Matthiesen, I., Bleichner, M. G., & Debener, S. (2021). Flex-Printed Ear-EEG Sensors for Adequate Sleep Staging at Home. Frontiers in Digital Health, 3.
[16]. Tabar, Y. R., Mikkelsen, K. B., Rank, M. L., Hemmsen, M. C., Otto, M., & Kidmose, P. (2020). Ear-EEG for sleep assessment: a comparison with actigraphy and PSG. Sleep and Breathing, 25(3), 1693–1705.
Cite this article
Tang,Y.;Yin,X.;Wang,X.;Zhang,Z. (2025). Application of Ear-EEG and Other Wearable Systems in Sleep Assessment. Applied and Computational Engineering,131,161-169.
Data availability
The datasets used and/or analyzed during the current study will be available from the authors upon reasonable request.
Disclaimer/Publisher's Note
The statements, opinions and data contained in all publications are solely those of the individual author(s) and contributor(s) and not of EWA Publishing and/or the editor(s). EWA Publishing and/or the editor(s) disclaim responsibility for any injury to people or property resulting from any ideas, methods, instructions or products referred to in the content.
About volume
Volume title: Proceedings of the 2nd International Conference on Machine Learning and Automation
© 2024 by the author(s). Licensee EWA Publishing, Oxford, UK. This article is an open access article distributed under the terms and
conditions of the Creative Commons Attribution (CC BY) license. Authors who
publish this series agree to the following terms:
1. Authors retain copyright and grant the series right of first publication with the work simultaneously licensed under a Creative Commons
Attribution License that allows others to share the work with an acknowledgment of the work's authorship and initial publication in this
series.
2. Authors are able to enter into separate, additional contractual arrangements for the non-exclusive distribution of the series's published
version of the work (e.g., post it to an institutional repository or publish it in a book), with an acknowledgment of its initial
publication in this series.
3. Authors are permitted and encouraged to post their work online (e.g., in institutional repositories or on their website) prior to and
during the submission process, as it can lead to productive exchanges, as well as earlier and greater citation of published work (See
Open access policy for details).
References
[1]. Marshall, S. (2024) Sleep Statistics and Facts About Sleep Deprivation. https://www.ncoa.org/adviser/sleep/sleep-statistics/#:~:text=About%2030%25%20of%20adults%20have
[2]. Van De Water, A. T. M., Holmes, A., Hurley, D. A. (2011). Objective measurements of sleep for non-laboratory settings as alternatives to polysomnography - a systematic review. Journal of Sleep Research, 20(1pt2), 183–200.
[3]. Ma, Y., Sun, S., Zhang, M., Guo, D., Liu, A. R., Wei, Y., Peng, C.-K. (2020). Electrocardiogram-based Sleep Analysis for Sleep Apnea Screening and Diagnosis. Sleep & Breathing = Schlaf & Atmung, 24(1), 231–240.
[4]. Urtnasan, E., Park, J.-U., Joo, E. Y., & Lee, K.-J. (2022). Deep Convolutional Recurrent Model for Automatic Scoring Sleep Stages Based on Single-Lead ECG Signal. Diagnostics, 12(5), 1235.
[5]. Fonseca, P., Weysen, T., Goelema, M. S., Møst, E. I. S., Radha, M., Lunsingh Scheurleer, C., van den Heuvel, L., & Aarts, R. M. (2017). Validation of Photoplethysmography-Based Sleep Staging Compared With Polysomnography in Healthy Middle-Aged Adults. Sleep, 40(7).
[6]. Massie, F., Vits, S., Khachatryan, A., Bart Van Pee, Johan Verbraecken, & Bergmann, J. (2023). Central Sleep Apnea Detection by Means of Finger Photoplethysmography. IEEE Journal of Translational Engineering in Health and Medicine, 11, 126–136.
[7]. Sadeh, A., & Acebo, C. (2002). The role of actigraphy in sleep medicine. Sleep Medicine ¬¬¬Reviews, 6(2), 113–124.
[8]. Lehrer, H. M., Yao, Z., Krafty, R. T., Evans, M. A., Buysse, D. J., Kravitz, H. M., Matthews, K. A., Gold, E. B., Harlow, S. D., Samuelsson, L. B., & Hall, M. H. (2022). Comparing polysomnography, actigraphy, and sleep diary in the home environment: The Study of Women’s Health Across the Nation (SWAN) Sleep Study. SLEEP Advances, 3(1).
[9]. Kosmadopoulos, A., Sargent, C., Darwent, D., Zhou, X., & Roach, G. D. (2014). Alternatives to polysomnography (PSG): A validation of wrist actigraphy and a partial-PSG system. Behavior Research Methods, 46(4), 1032–1041.
[10]. Kamdar, B. B., Kadden, D. J., Vangala, S., Elashoff, D. A., Ong, M. K., Martin, J. L., & Needham, D. M. (2017). Feasibility of Continuous Actigraphy in Patients in a Medical Intensive Care Unit. American Journal of Critical Care, 26(4), 329–335.
[11]. Yuan, H., Hill, E. A., Kyle, S. D., & Doherty, A. (2024). A systematic review of the performance of actigraphy in measuring sleep stages. Journal of Sleep Research.
[12]. Mikkelsen, K. B., Villadsen, D. B., Otto, M., & Kidmose, P. (2017). Automatic sleep staging using ear-EEG. BioMedical Engineering OnLine, 16(1).
[13]. Tabar, Y. R., Mikkelsen, K. B., Shenton, N., Kappel, S. L., Bertelsen, A. R., Nikbakht, R., Toft, H. O., Henriksen, C. H., Hemmsen, M. C., Rank, M. L., Otto, M., & Kidmose, P. (2023). At-home sleep monitoring using generic ear-EEG. Frontiers in Neuroscience, 17.
[14]. Sterr, A., Ebajemito, J. K., Mikkelsen, K. B., Bonmati-Carrion, M. A., Santhi, N., della Monica, C., Grainger, L., Atzori, G., Revell, V., Debener, S., Dijk, D.-J., & DeVos, M. (2018). Sleep EEG Derived From Behind-the-Ear Electrodes (cEEGrid) Compared to Standard Polysomnography: A Proof of Concept Study. Frontiers in Human Neuroscience, 12.
[15]. Carlos, Wiebke Pätzold, Karen Insa Wolf, Paul, M., Matthiesen, I., Bleichner, M. G., & Debener, S. (2021). Flex-Printed Ear-EEG Sensors for Adequate Sleep Staging at Home. Frontiers in Digital Health, 3.
[16]. Tabar, Y. R., Mikkelsen, K. B., Rank, M. L., Hemmsen, M. C., Otto, M., & Kidmose, P. (2020). Ear-EEG for sleep assessment: a comparison with actigraphy and PSG. Sleep and Breathing, 25(3), 1693–1705.