


1. Introduction
Investment institutions have begun to use quantitative investment for decision-making in stock trading. Compared with traditional investment strategies, quantitative investment has significant advantages in systematicity, accuracy, timeliness, and diversification. In order to explore the accuracy of the random forest algorithm in predicting stock price fluctuations under pure technical indicators, this paper starts from the mature stock selection indicator system in China, selects five pure technical indicators, and establishes a stock price fluctuation prediction model based on random forest, providing investors with accurate stock fluctuation reference[1].
Random forest is an ensemble learning method that uses bagging strategy. It is an ensemble classifier composed of multiple decision trees that can classify and predict samples. A decision tree is a prediction model based on a tree structure consisting of root nodes, intermediate nodes, and leaf nodes. It judges the (one or more) attributes of the sample from top to bottom in sequence, until it reaches the leaf nodes of the decision tree and derives the final result. When there are too many abnormal data or too many features in the dataset, it can easily lead to overfitting. Random forest is an ensemble classifier based on multiple decision trees for sample classification and prediction. Multiple decision trees are constructed by generating different features of multiple sub samples. In the final classification, voting is used for classification, and the one with the most votes is the final classification; For regression problems, the average method is generally used to determine the final result. Decision formula:
\( G(x)=arg {max{ y_{i}}\sum _{i=1}^{k} L({f_{i}}(x)={y_{i}})}\ \ \ (1) \)
of which \( {f_{i}}(x) \) Representing the i-th decision tree in the decision tree, representing the indicative function, G (x) refers to the classification model of the random forest.
The construction process of random forest is shown in Figure 1.
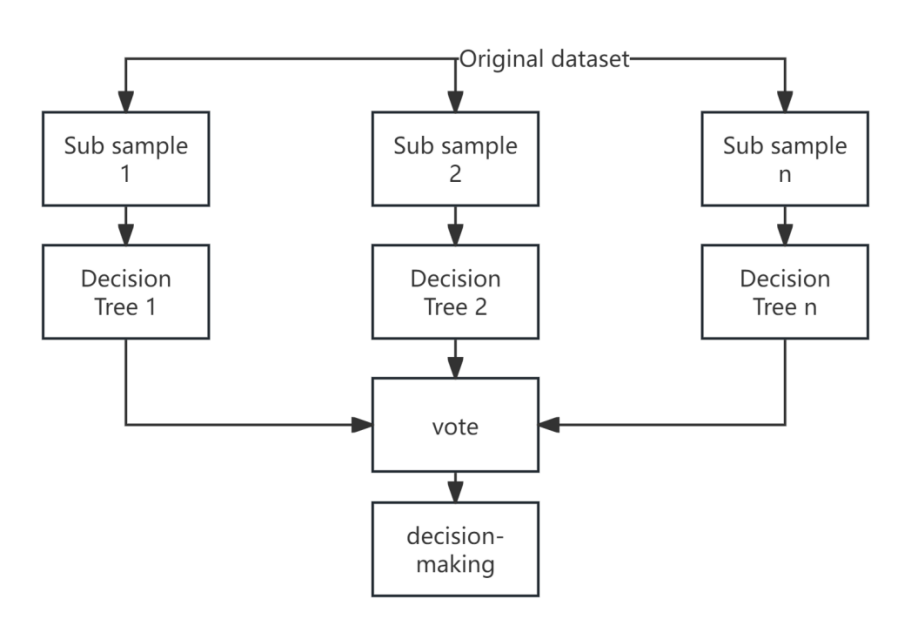
Figure 1: Random Forest Construction
2. Random Forest Algorithm with Parameter Optimization
With the advent of the big data era, the massive amount of data in prediction problems poses challenges to many classic prediction methods. The parameter values of the random forest algorithm will directly affect the accuracy of the algorithm's predictions. Optimizing the important parameters of the random forest algorithm and obtaining the optimal parameter combination is beneficial for improving the model's prediction accuracy.
Parameter 1) The number of decision trees (d_estimators) is the number of decision trees, and its value has a significant impact on the performance of the random forest algorithm. If the value is too small, it will lead to underfitting of the model and poor prediction performance; As its value increases, the accuracy of the algorithm will also improve, but it will lead to problems such as long computation time and low efficiency. If the value is too high, it may even cause overfitting of the model,
2) The maximum depth of a decision tree (x_depth) is closely related to the amount of data and data features. When the amount of data is large and there are many features, the value of x_depth must be considered
3) The minimum number of samples that can be divided into nodes (min_stamples_split) is a key parameter in decision tree generation
4) The minimum sample size of a leaf node (min_stamples_leaf), when the sample size of a node is less than the minimum number of separable samples, the decision tree stops partitioning
5) The maximum number of leaf nodes is a key parameter in decision tree generation
The parameters 2) to 5) mentioned above need to be adjusted for large sample sizes. The process of the random forest algorithm with parameter optimization is shown in Figure 3.
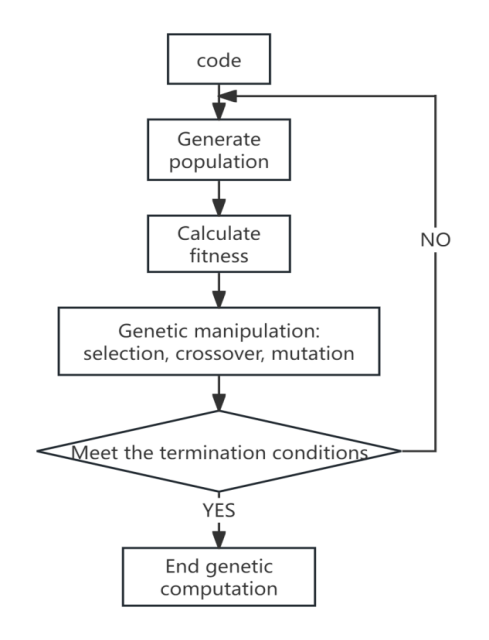
Figure 2: Schematic diagram of genetic algorithm
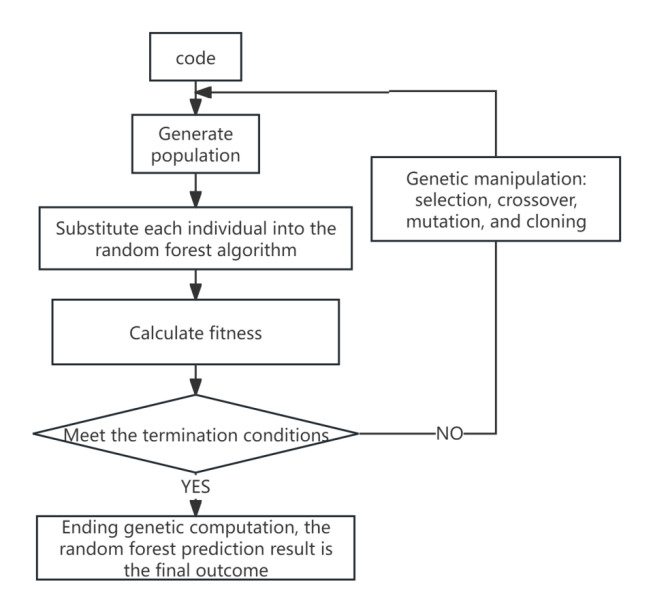
Figure 3: Process of Random Forest Algorithm with Parameter Optimization
The specific process is as follows:
1) Genetically encode the above 5 parameters and generate an initial population;
2) Substitute the parameters of each individual in the population with the random forest algorithm, conduct regression analysis, and obtain prediction results;
3) Adopting a coefficient of determination \( {R^{2}} \) As a fitness measure.
\( {R^{2}}=1-\frac{\sum _{i=1}^{n} ({y_{i}}-f({x_{i}}){)^{2}}}{\sum _{i=1}^{n} ({y_{i}}-\bar{y}{)^{2}}}\ \ \ (2) \)
of which \( {y_{i}} \) For the true value, \( f({x_{i}}) \) To predict the value, \( \bar{y} \) For the true mean value, the closer the coefficient of determination is to 1, the higher the accuracy of the model;
4) Determine whether the termination condition of the genetic algorithm is met. If it is met, end the calculation. The current best random forest prediction result is the final result. Otherwise, select, cross, mutate, and reduce to regenerate a sufficient number of individuals and form a population:
5) Repeat steps 2), 3), and 4)
3. Feature selection and processing
The feature selection of quantitative stock selection strategy can be roughly divided into two aspects: fundamental indicators and technical indicators. The former is represented by multi factor models, while the latter is represented by momentum reversal strategies. Traditional analysis of technical indicators relies on investors' experience[2]. They found that the combined effect of technical indicators was significant. Therefore, this paper established a multi factor model of pure technical indicators. Five pure technical indicators, namely relative strength, rate of change, energy tide, moving average of similarities and differences, and William index, were calculated from raw data as the characteristics of the random forest stock selection model. The meanings and specific calculation steps of the five pure technical indicators can be found in "Technical Analysis A-Z" and Baidu Baike. The technical indicators and classifications used in this article are shown in Table 1.
Table 1: Technical Indicators and Classification
Technical indicator category | Technical indicator name and abbreviation | key parameter |
Directional Movement Index | MACD index smooth moving average | 12,26,9 |
Awesome Oscillator | ROC rate of change indicator | 14 |
Energy index | OBV energy tide | 1 |
Momentum index | Williams% R Williams Indicator | 14 |
Relative Strength | RSI relative strength | 14 |
According to the statistics of each indicator, it can be seen that there are significant differences in data between each indicator, especially OBV, whose average value is often much larger than other indicators. In order to eliminate dimensional errors between scalars, all data features are standardized and data samples containing missing and singular values are removed.
4. Experimental results and analysis
Experiment 1 selected the closing price, opening price, highest price, and lowest price of Vanke Securities, a representative A-share company, for each trading day from April 30, 2021 to June 30, 2023, as the classification samples. Compare the closing price delayed by 14 days with the closing price of the day. If it rises, label it as 1; otherwise, label it as -1. After feature calculation and processing, the final experimental data contains a total of 516 trading days[3].
During the experiment, the dataset was first randomly divided into a training set (345 trading days) and a testing set (171 trading days) in a ratio of approximately 2:1. Then, the training set was used to perform grid searches on the two main parameters of the random forest, namely the number of decision trees and the maximum number of features. The average score of the test set (115 trading days) obtained through 3-fold cross validation was used as the evaluation index, and the highest scoring parameter combination was selected to construct the final random forest stock prediction model. According to the data, the range of tree parameters for the parameter tree is set to 1<n_estimators<345. As it is not very sensitive to the impact on the random forest, the step size is set to 50. The maximum depth range of the tree is 1 ≤ max_depth ≤ 5, and the step size is 1. The visualization of the grid search results is shown in Figure 4.
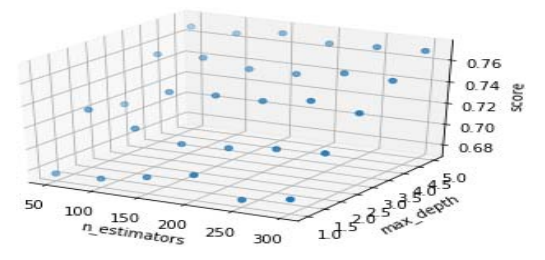
Figure 4: Visualization of Grid Search Results
The optimal parameter value k=150 was obtained through grid search, m=5. It can also be seen from the visualization that as the maximum number of features increases, the model score increases. After determining the model, keep all other variables the same, set the parameters to default values, and then compare the accuracy with the optimal parameter experimental test. The test results are shown in Table 2. The accuracy of the parameter optimized random forest stock prediction model is about 77%, which is about 2% higher than the default value. It can be seen that the classification ability of the parameter optimized random forest algorithm has been improved.
Table 2: Comparison of experimental results before and after parameter optimization
n_estimators | max_depth | accuracy | |
Default value | 10 | 5 | 0.7485 |
optimization | 150 | 5 | 0.7661 |
In 2013, Liu Daowen et al. analyzed the basic principles of support vector machine prediction and determined the optimal regression parameters using cross validation to predict the stock price index. The research results showed that the support vector machine prediction method could accurately reflect the trend of stock price index changes. In order to further test the effect of parameter optimized random forest on stock classification under pure technical indicators, this paper constructs a parameter optimized random forest stock prediction model and compares the experimental results with the original parameters of random forest, decision tree, and support vector machine for stock classification[4].
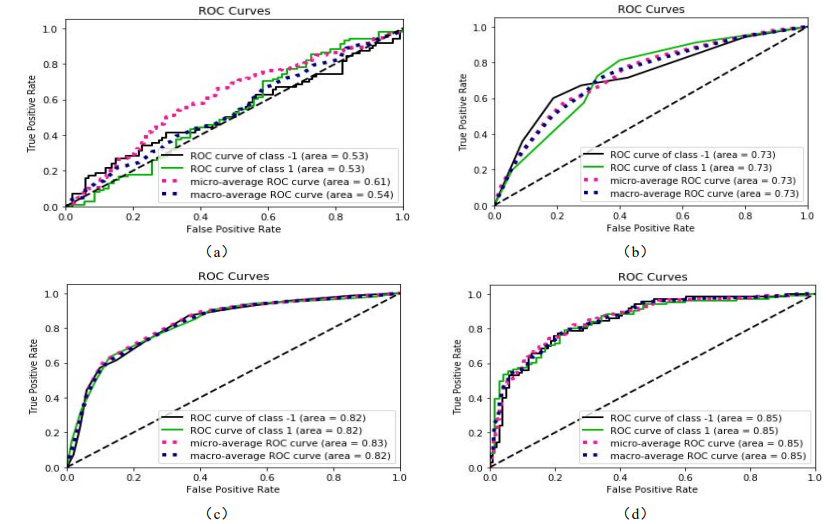
Figure 5: ROC curve
As shown in Figure 5, ROC curves are plotted based on the training results of four different algorithms: support vector machine (a), decision tree (b), original random forest (c), and parameter optimized random forest (d). The horizontal axis represents "false positive rate (FPR)" and the vertical axis represents "true positive rate (TPR)". From Figure 2, it can be roughly seen that when TPR is on the same horizontal line, the parameter optimized random forest predicts the lowest false positive rate, followed by the original random forest, and the support vector machine predicts the worst. Meanwhile, the AUC values of the four are 0.53, 0.73, 0.82, and 0.85, respectively, indicating that under pure technical indicators, the generalization ability of random forest for Vanke Securities prediction is relatively better.
In Experiment 2, in order to demonstrate the effectiveness of parameter optimization of random forest in stock prediction, data from four securities companies, Ping An Bank, Shenzhen Zhenye A, Shenzhou High speed Railway, and Beautiful Ecology, were calculated and obtained for each trading day from April 30, 2021 to June 30, 2023. The rise and fall of the stocks of the five securities companies were predicted separately. Table 3 shows the experimental results of different stock predictions. The results show that all five securities companies achieved high accuracy in the prediction of random forest after parameter optimization, with Ping An Bank having the highest prediction accuracy, about 6% higher than the original random forest prediction accuracy. Under the parameter optimized random forest prediction, the accuracy of other securities companies is higher than that of the original random forest, decision tree, and support vector machine, which further demonstrates the superiority of the random forest stock prediction model and the effectiveness of parameter optimization.
Table 3: Experimental results of different stock predictions
Securities abbreviation | Support vector machine | decision tree | Primitive Random Forest | Parameter optimized random forest |
Ping An Bank | 0.5977 | 0.6568 | 0.7751 | 0.8343 |
vanke | 0.5965 | 0.6316 | 0.7485 | 0.7661 |
Shenzhenye A | 0.5630 | 0.6222 | 0.7333 | 0.7481 |
Shenzhou High Speed Railway | 0.6456 | 0.6392 | 0.7342 | 0.7405 |
Beautiful ecology | 0.6024 | 0.6625 | 0.7108 | 0.7590 |
Finally, based on the predicted results, analyze the rise and fall of the stock. If the classification result is 1, it indicates that the stock will still maintain an upward trend after 14 days, and -1 indicates that the stock will soon decline after 14 days. From the prediction results, it can be concluded that stocks will continue to rise during a certain period of time. For example, the 300-400th data sample represents all trading days in the dataset from July 31, 2022 to December 24, 2022. Therefore, investors can hold positions during the continuous rise of stocks and close them out for profit when they fall[5].
5. Summary
This article proposes a stock price rise and fall prediction model based on random forest for stock prediction problems. Due to the slow update of fundamental indicators and to prevent investment behavior from overly relying on experience, multiple purely technical indicators are constructed for stock prediction. On the other hand, grid search is used to optimize the parameters of the random forest. Ultimately, through experiments on the rise and fall of stock prices for different stocks, it was found that under multiple purely technical indicators, the parameter optimized random forest had relatively more reliable predictive models for stocks, providing good investment references for investors and reflecting the predictability of the stock market. However, as the Chinese stock market continues to develop, the construction and selection of indicators, as well as the optimization of algorithms, still need to be further improved in future research.
References
[1]. Deivendran P , G. C , Suresh B P ,et al.Analysis of Stock Price Fluctuations Accuracy using a Cloud-Based Recurrent Neural Network's Long Short-Term Memory Model[J].International Journal of Electrical and Electronics Engineering, 2023.
[2]. Osu B O , Amadi I U .A Stochastic Analysis of Stock Market Price Fluctuations for Capital Market[J].Journal of Applied Mathematics and Computation, 2023, 6.
[3]. Dong Z , Jia Y , Wang Z ,et al.Research on the Quantitative Causal Transmission of Stock Price Fluctuations of Listed Companies in the Rare Earth Industry Chain[J].International Journal of Energy Research, 2023.
[4]. Kumari B , Patnaik S , Swarnkar T .Feature selection for stock price prediction: a critical review[J].International Journal of Intelligent Enterprise, 2023.
[5]. Wang R , Shao Z , Tian W L .A Dual-View Model for Stock Price Prediction of Internet-of-Thing Enterprises[J].Journal of circuits, systems and computers, 2024, 33(1):1.1-1.17.
Cite this article
Wang,J. (2025). Research on Stock Price Rise and Fall Prediction Based on Optimization Random Forest. Applied and Computational Engineering,133,60-66.
Data availability
The datasets used and/or analyzed during the current study will be available from the authors upon reasonable request.
Disclaimer/Publisher's Note
The statements, opinions and data contained in all publications are solely those of the individual author(s) and contributor(s) and not of EWA Publishing and/or the editor(s). EWA Publishing and/or the editor(s) disclaim responsibility for any injury to people or property resulting from any ideas, methods, instructions or products referred to in the content.
About volume
Volume title: Proceedings of the 5th International Conference on Signal Processing and Machine Learning
© 2024 by the author(s). Licensee EWA Publishing, Oxford, UK. This article is an open access article distributed under the terms and
conditions of the Creative Commons Attribution (CC BY) license. Authors who
publish this series agree to the following terms:
1. Authors retain copyright and grant the series right of first publication with the work simultaneously licensed under a Creative Commons
Attribution License that allows others to share the work with an acknowledgment of the work's authorship and initial publication in this
series.
2. Authors are able to enter into separate, additional contractual arrangements for the non-exclusive distribution of the series's published
version of the work (e.g., post it to an institutional repository or publish it in a book), with an acknowledgment of its initial
publication in this series.
3. Authors are permitted and encouraged to post their work online (e.g., in institutional repositories or on their website) prior to and
during the submission process, as it can lead to productive exchanges, as well as earlier and greater citation of published work (See
Open access policy for details).
References
[1]. Deivendran P , G. C , Suresh B P ,et al.Analysis of Stock Price Fluctuations Accuracy using a Cloud-Based Recurrent Neural Network's Long Short-Term Memory Model[J].International Journal of Electrical and Electronics Engineering, 2023.
[2]. Osu B O , Amadi I U .A Stochastic Analysis of Stock Market Price Fluctuations for Capital Market[J].Journal of Applied Mathematics and Computation, 2023, 6.
[3]. Dong Z , Jia Y , Wang Z ,et al.Research on the Quantitative Causal Transmission of Stock Price Fluctuations of Listed Companies in the Rare Earth Industry Chain[J].International Journal of Energy Research, 2023.
[4]. Kumari B , Patnaik S , Swarnkar T .Feature selection for stock price prediction: a critical review[J].International Journal of Intelligent Enterprise, 2023.
[5]. Wang R , Shao Z , Tian W L .A Dual-View Model for Stock Price Prediction of Internet-of-Thing Enterprises[J].Journal of circuits, systems and computers, 2024, 33(1):1.1-1.17.