


1. Introduction
Colorectal cancer (CRC) is prevalent globally, with significant morbidity and mortality rates in China[1-2]. Most patients are diagnosed at an advanced stage due to subtle early symptoms. The liver is the primary site of CRC metastasis, making early detection critical for treatment and prognosis[3]. Radiomics and machine learning can analyze imaging to predict metastasis risk, while deep learning enhances pathologic diagnosis accuracy. TLS is linked to CRC liver metastasis and patient outcomes. We developed a multimodal model to predict liver metastasis risk in CRC using machine learning feature extraction, offering a novel approach for early prediction.
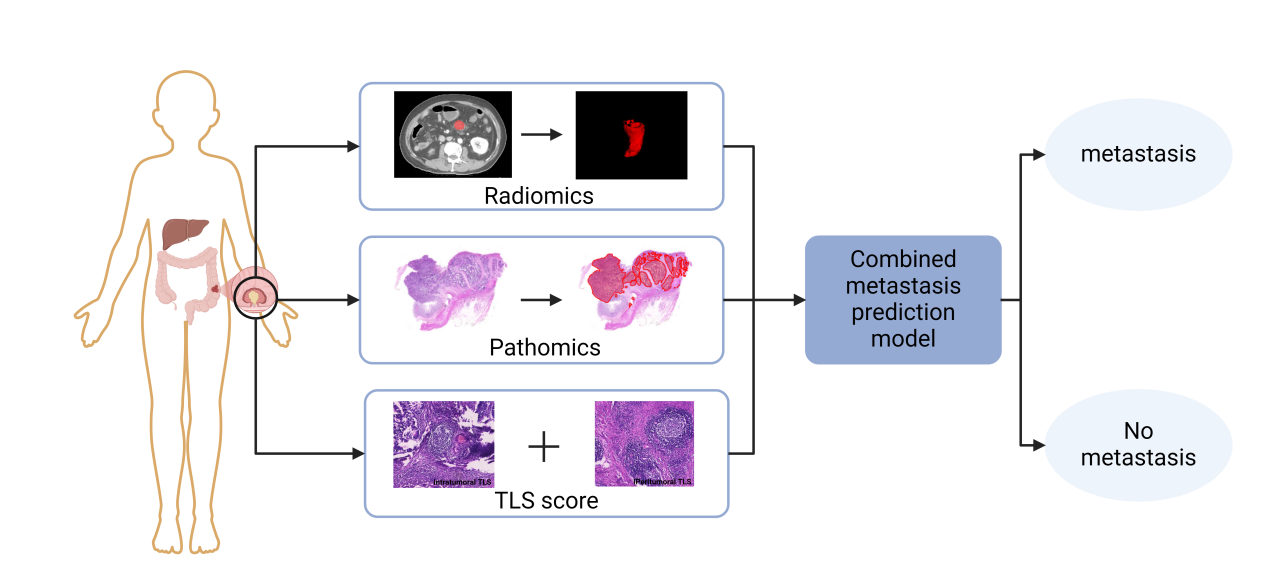
Figure 1: Schematic of the combined predictive model
2. Methods and materials
2.1. Patients and samples
This study involved 167 colorectal cancer patients treated at Zhongda Hospital, Southeast University, from November 2013 to February 2021, who had CT scans and pathology reports. The criteria for inclusion were primary colorectal cancer, radical surgery, no preoperative neoadjuvant or transformative therapy, no other malignancies, and complete data. The study collected CT images and paraffin-embedded tissue samples, and extracted demographic and clinicopathologic data from medical records. Patients were diagnosed with liver metastases following the 2023 Chinese Guidelines and divided into two groups: those with and without liver metastases.
2.2. Machine learning radiomics model development
This study developed a radiomics model to predict liver metastasis risk in CRC patients using pre-surgical CT images. Experts delineated tumors, processed 3D models with 3D-Slicer, and standardized CT images to 1mm voxel spacing. Features were extracted with Pyradiomics, screened via T-test and Lasso regression, and the model was built using eight ML algorithms.
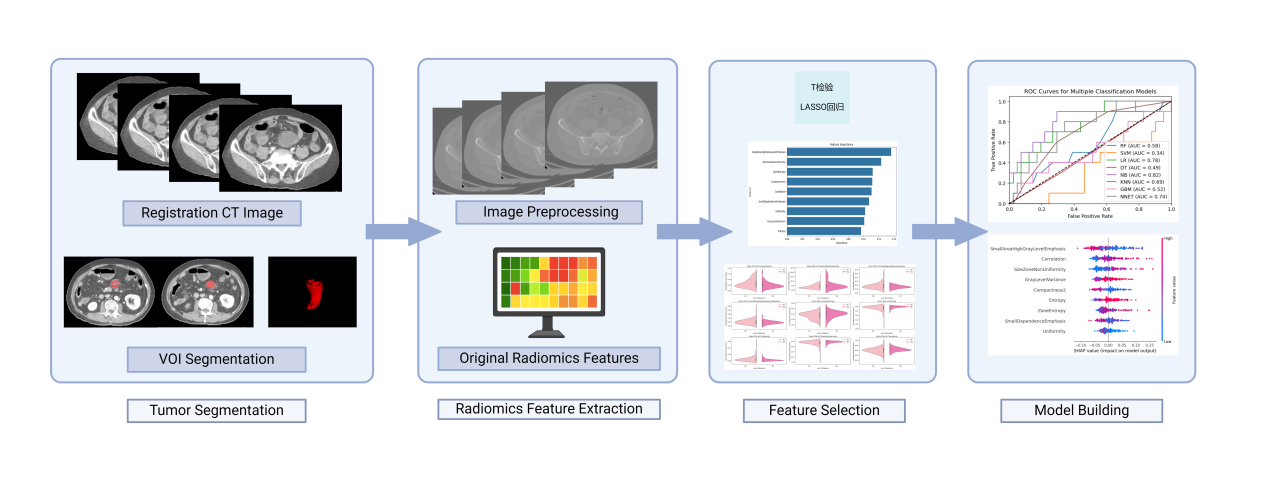
Figure 2: The flowchart of the proposed radiomics model
2.3. Deep learning pathomics signiture construction
In this study, we sectioned colorectal cancer specimens to 5 µm thickness, stained them with Harris hematoxylin and eosin Y, and fixed them on slides. We observed them with a Nikon microscope and scanned them using a HAMAMATSU NanoZoomerS360 and MIRAX Pannoramic MIDT scanner with a Point Grey camera. We collected hematoxylin and eosin-stained images within 7 days post-diagnosis, labeled tumor regions with QuPath, cropped 256×256 pixel patches, preprocessed and normalized colors, modeled with Resnet-18, and developed pathohistological features by plotting histograms of predicted probabilities and labels.[4-7].
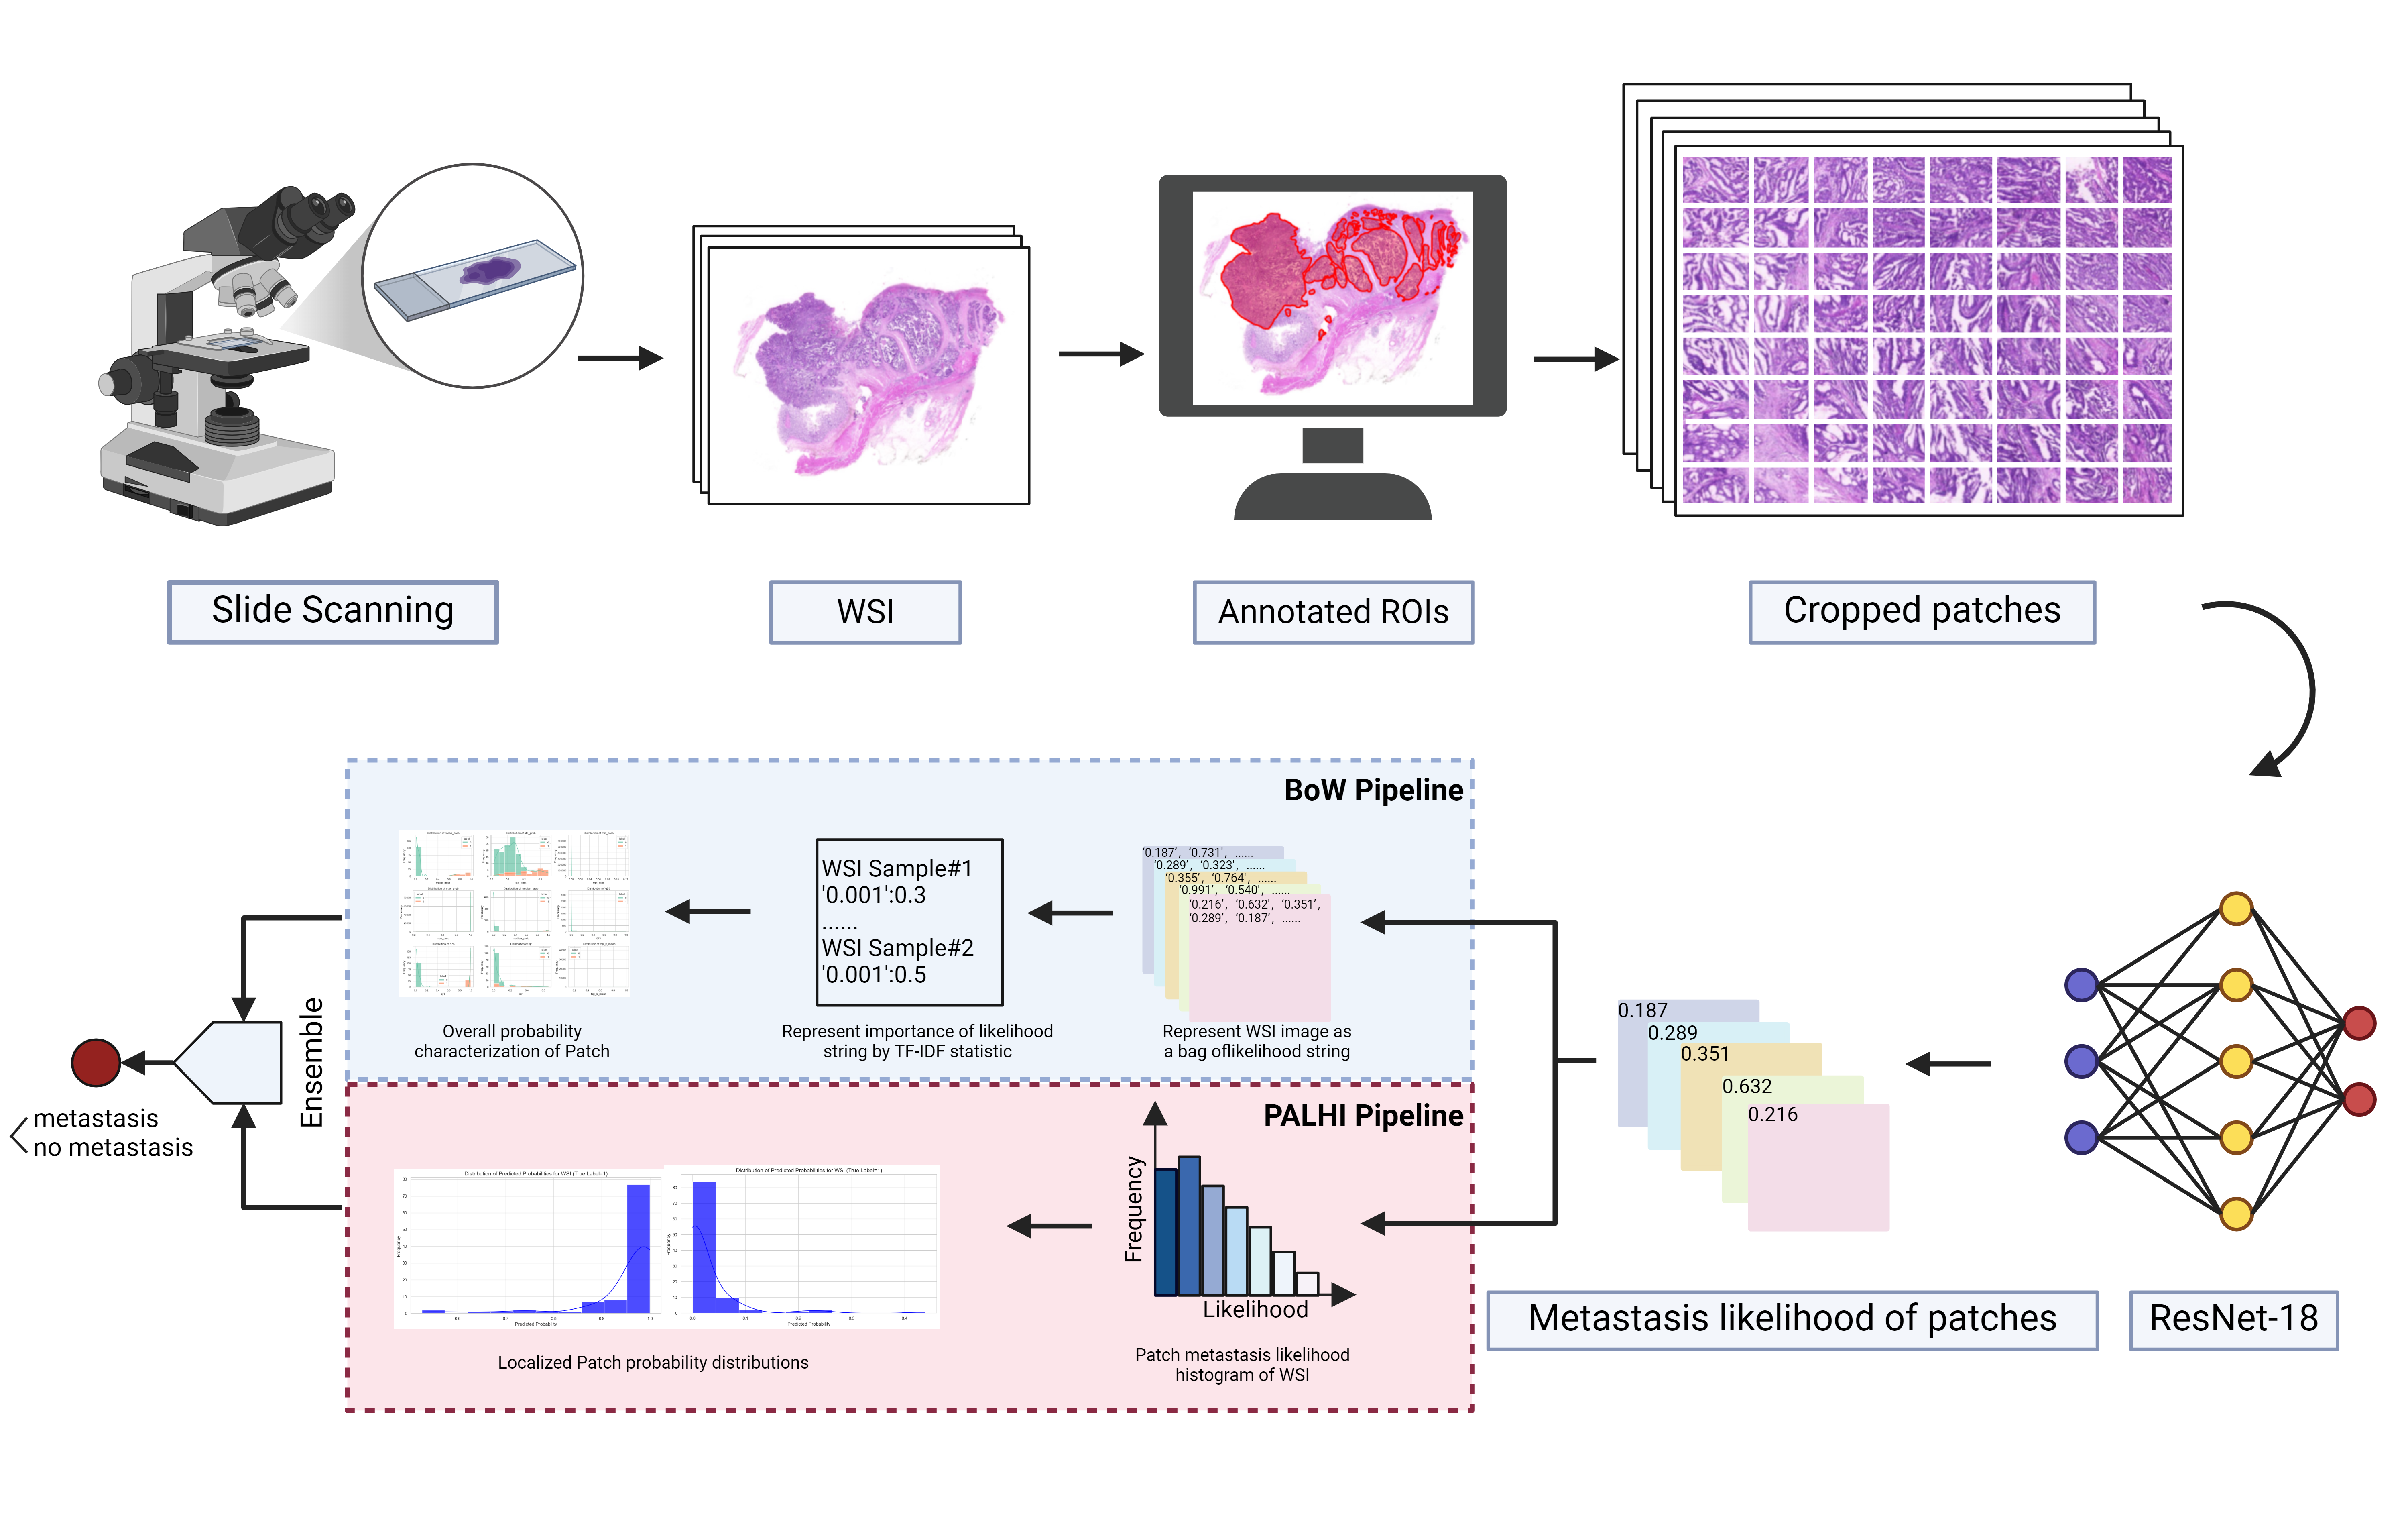
Figure 3: An overview of established WSISA framework
2.4. TLSs classification
TLS presence in tumors was morphologically evaluated on H&E-stained slides[8], with dense lymphocyte clusters identified as TLS. CRC-associated TLS were categorized into five classes based on TLS location and count in the most TLS-dense H&E sections. Two pathologists independently assessed and classified TLS without clinical patient information.
Table 1: The classified criteria of colorectal cancer-associated tertiary lymphoid structures (TLSs)
Peritumoral TLS count | Intratumoral TLS count | |
Grade 0 | 0 | 0 |
Grade 1 | 1-4 | 0 |
Grade 2 | >4 | 0 |
Grade 3 | ND | 1-4 |
Grade 4 | ND | >4 |
(a) (b)
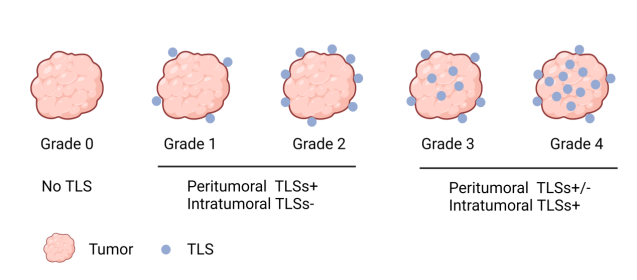
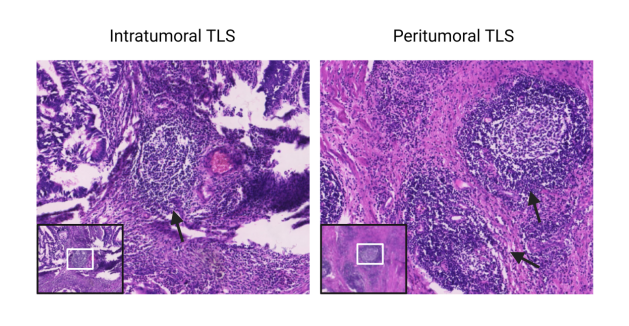
Figure 4: Tertiary lymphoid structures (TLSs) in colorectal cancer(a)TLS score(Grades 0–4) (b)Peritumoral and Intratumoral TLSs (H&E Staining)
2.5. Establishing a multimodal cohort for colorectal cancer to predict the risk of liver metastasis
In the multimodal cohort, standard clinical data showed significant differences between patients with and without liver metastases, yet a classification model based on these (AUC = 0.73) couldn't fully distinguish them. We included CT scans, HE images, and TLS scores to create multimodal biomarkers, integrated the data into a liver metastasis prediction algorithm, and evaluated its predictive performance using tenfold cross-validation.
3. Results
3.1. Clinical characteristics of patients with and without liver metastases from colorectal cancer
The baseline data and known metastatic outcomes of the patients in this study (see Table 2 for cohort characteristics) are referred to as the multimodal cohort.
Table 2: Clinical characteristics of patients with and without liver metastases from colorectal cancer
Clinical characteristics | Liver metastasis (n=37) | No liver metastasis (n=130) | ||
Age, median (range) | 65 | (33-84) | 63 | (33-87) |
Sex, n(%) | ||||
Male | 26 | (70.27) | 74 | (56.92) |
Female | 11 | (29.73) | 56 | (43.08) |
Tumor site, n(%) | ||||
Right | 12 | (32.43) | 49 | (37.69) |
Left | 25 | (67.57) | 81 | (62.31) |
Pathological stage, n(%) | ||||
Ⅰ | 2 | (5.411) | 13 | (10.00) |
Ⅱ | 4 | (10.81) | 58 | (44.62) |
Ⅲ | 31 | (83.78) | 58 | (44.62) |
Ⅳ | 0 | (0.00) | 1 | (0.77) |
Maximum diameter, n(%) | ||||
≥5cm | 21 | (56.76) | 57 | (43.85) |
<5cm | 16 | (43.24) | 73 | (56.15) |
Differentiated degree, n(%) | ||||
Well-differentiated | 0 | (0.00) | 4 | (3.08) |
Moderately differentiated | 31 | (83.78) | 117 | (90.00) |
Poorly differentiated | 6 | (16.22) | 9 | (6.92) |
(a) (b) (c)
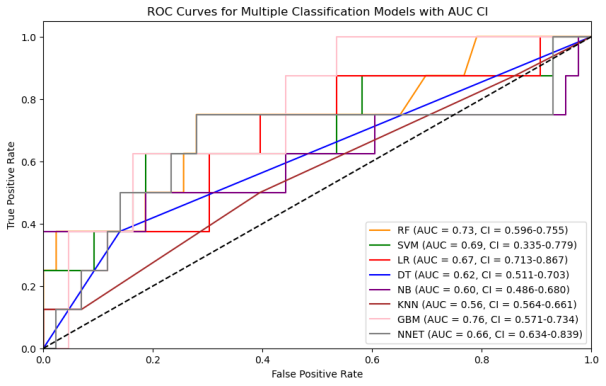
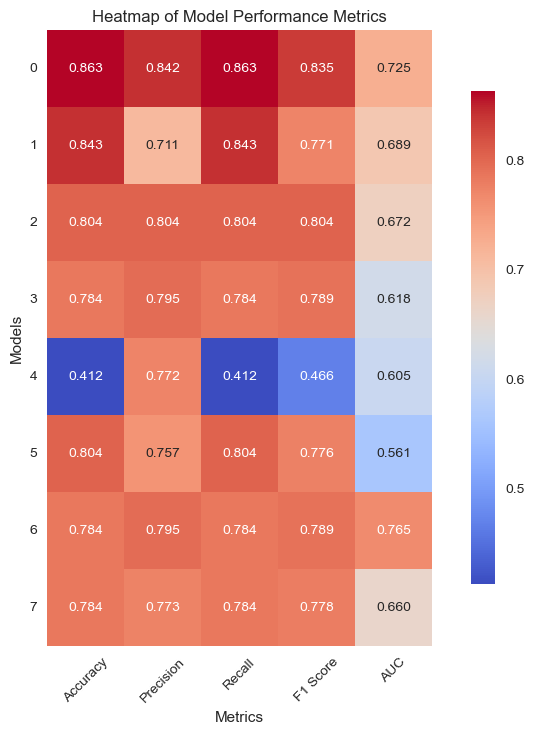
(d) (e)
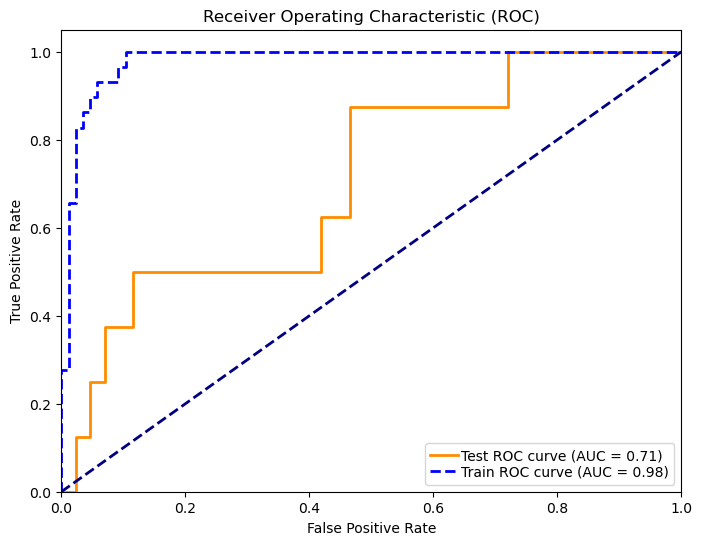
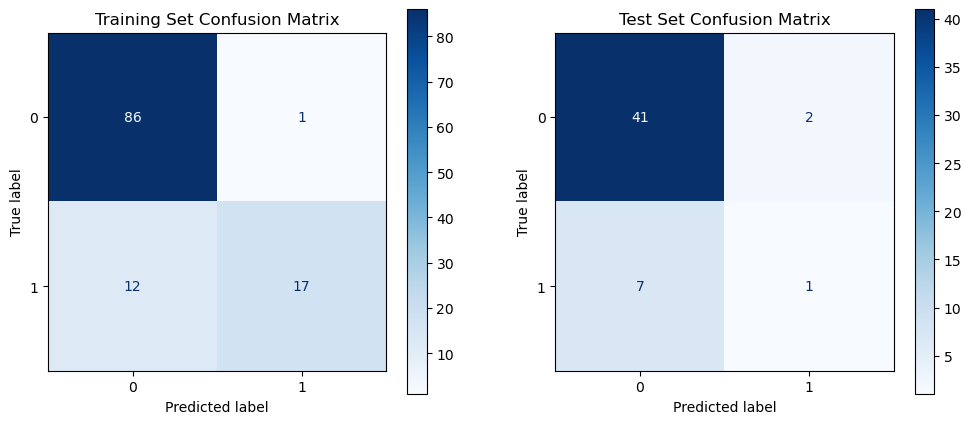
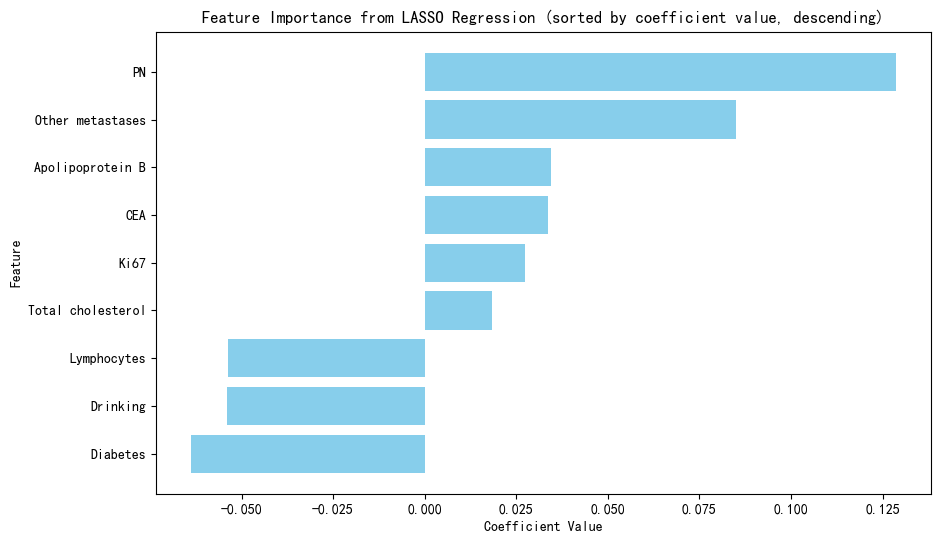
Figure 5: Clinical model performance evaluation(a)ROC curves for multiple classification models (b)Heatmap of model performance metrics(c)Feature importance of selected features (d)ROC curves for RF model(e)Confusion matrix of RF model for train and test
We utilized eight ML algorithms (RF, SVM, LR, DT, GPB, KNN, GBM, and MLP) to develop the prediction model, assessing performance via Accuracy, Precision, Recall, F1 Score, AUC, and its 95% CI. The analysis revealed that the RF model outperformed others with 86.27% accuracy and an AUC of 0.73, proving stable and apt for complex dataset forecasting despite a broad confidence interval (0.655-0.900).
3.2. CT features are only moderately predictive of the risk of liver metastasis
In 167 patients, 75.45% had clear disease contours. We analyzed abdominal + pelvic CT contrast imaging and extracted 1063 features from the radiologist's raw segmented images, including first-order features, shape features, GLCM, GLRLM, GLSZM, GLDM, NGTDM, LOG, and Wavelet features. By T-test and LassoCV, we screened 8 key features. These features show significant differences in patients with different metastatic outcomes and help to construct predictive models. Among the eight machine learning algorithms, the Gaussian plain Bayesian algorithm performed the best with an AUC of 0.85, but the performance varied significantly among algorithms and the stability needs to be improved. This suggests that CT image features can distinguish clinical endpoints, which are influenced by tumor texture features, and lesion-specific features are applied in multimodal models to assess their predictive ability.
(a) (b)
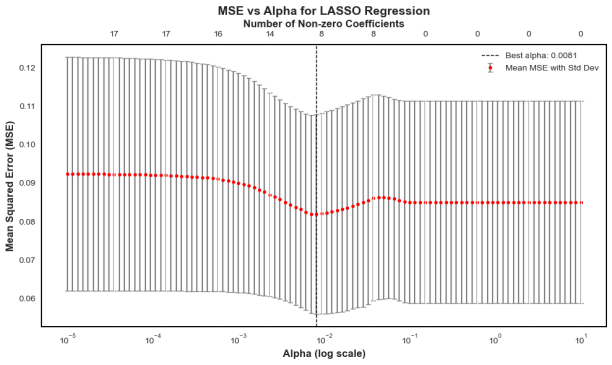
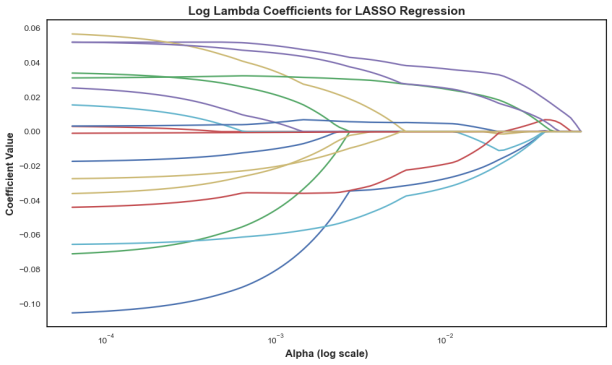
Figure 6: LASSO regression for predictor screening in radiomic models(a)MSE vs.α (b) Coefficient path diagrams
(a) (b) (c) (d)
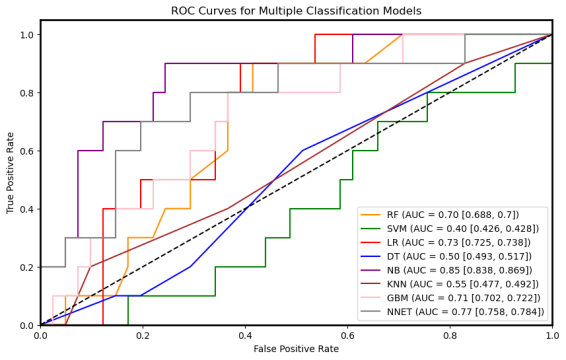
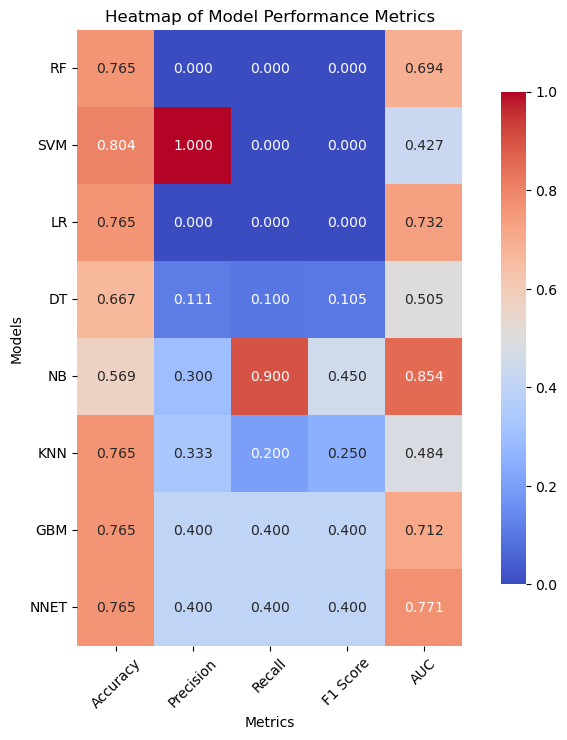
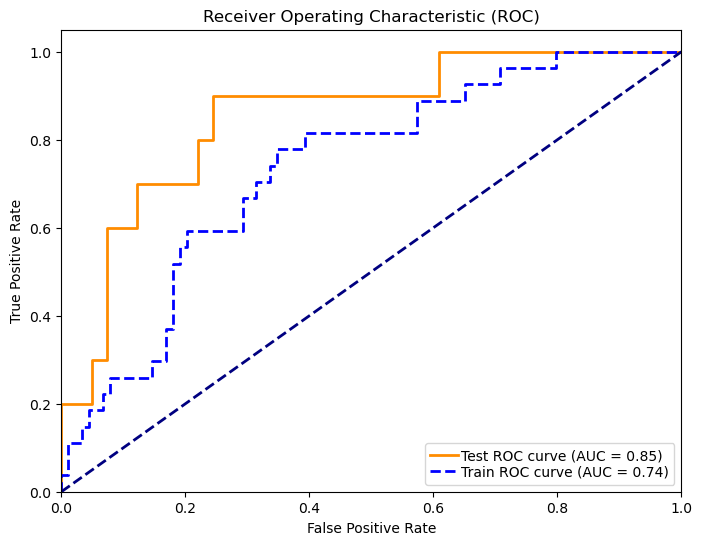
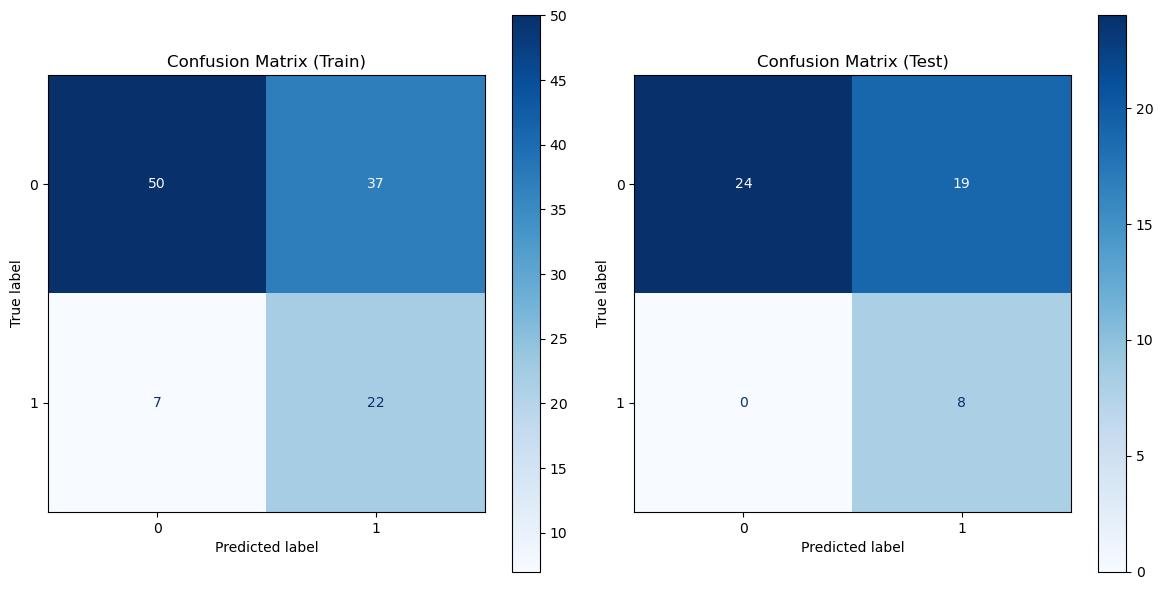
Figure 7: Radiomic model performance evaluation(a)ROC curves for multiple classification models (b)Heatmap of model performance metrics(c)ROC curves for NB model(d)Confusion matrix for training and testing sets of NB model
(a) (b) (c)
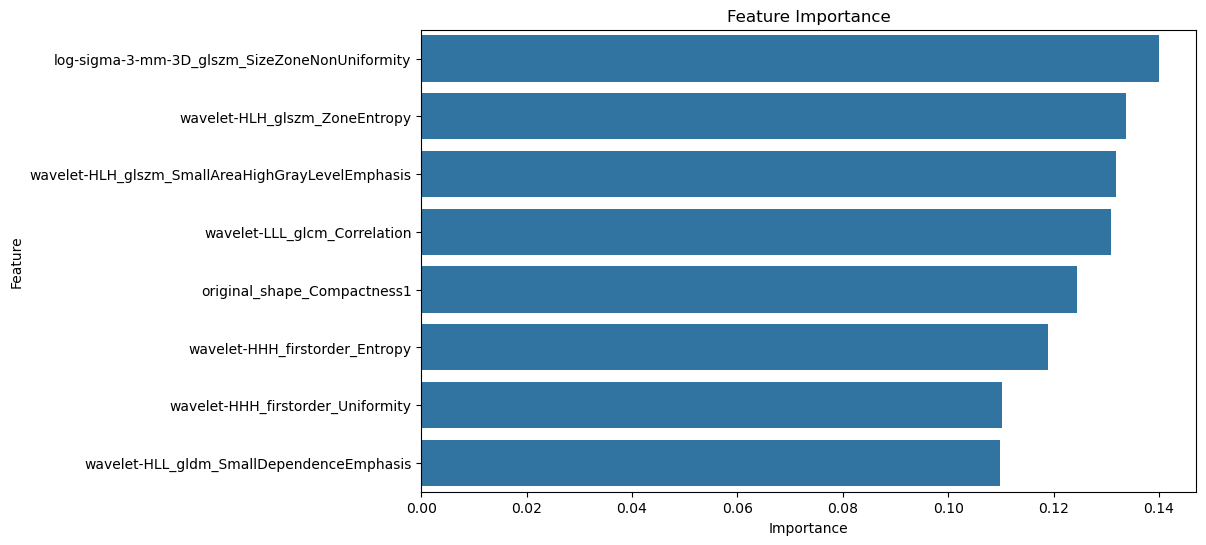
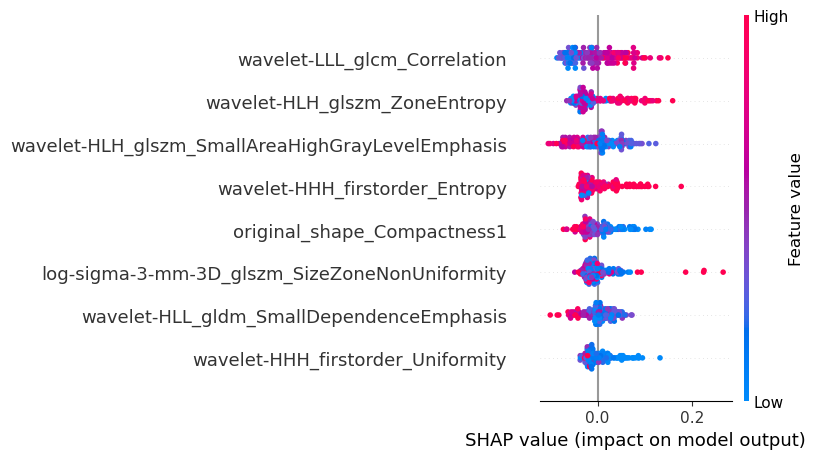
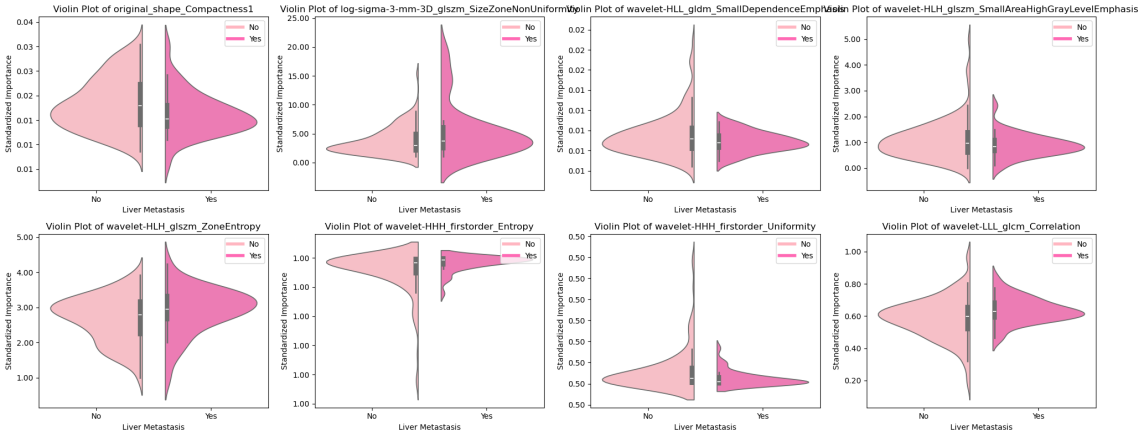
Figure 8: Feature Importance Visualization(a)Feature importance coefficients (b) Interpretable SHAP models(c) Distribution of each feature in the presence or absence of liver metastases
3.3. Deep Learning of Pathohistological Features Can Predict Liver Metastases Well
This study utilized the ResNet-18 model to build a pathology image classifier. Preprocessing involved Excel label integration, data augmentation (random flip, rotation, Gaussian blur), and a 7:3 train-validation split. The model leveraged pre-trained weights, adjusted the fully connected layer for binary classification, and incorporated Dropout. It used cross-entropy loss, Adam optimization, and a Warmup-Cosine Decay learning rate schedule. The model achieved an AUC of 0.88, a 95% CI of 0.874-0.894, and an accuracy of 0.855, indicating good performance.
Table 3: Evaluation metrics of deep learning models for pathology histology
Set | AUC | AUC 95% CI | Accuracy | Precision | Recall | F1 score |
Train Set | 0.97 | 0.970-0.975 | 0.931 | 0.881 | 0.788 | 0.832 |
Test Set | 0.88 | 0.874-0.894 | 0.855 | 0.689 | 0.582 | 0.631 |
(a) (b)
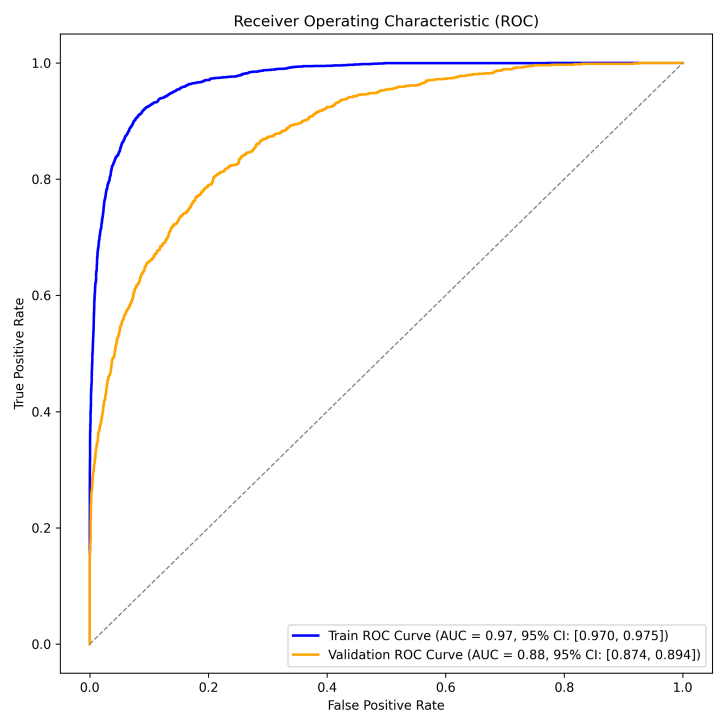
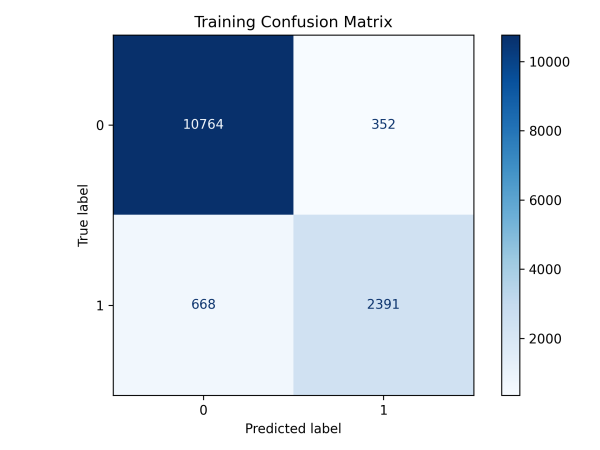
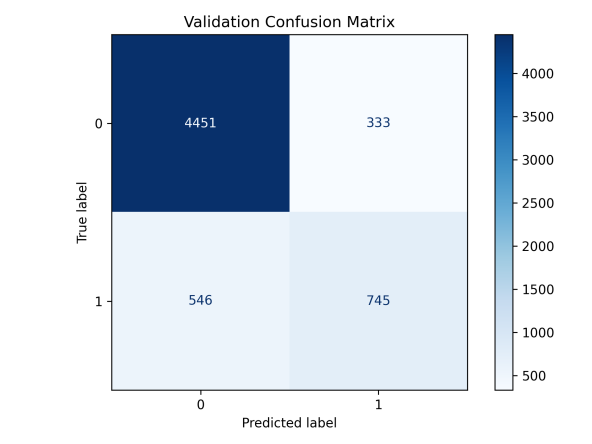
Figure 9: Evaluation of Pathogenomic Model(a)ROC curves for pathohistological modeling(b)Confusion matrix for training and validation sets of pathohistology model
In this study, we analyzed WSI-level feature extraction by aggregating and statistically predicting slice probabilities for clinical analysis. The liver metastasis group had significantly higher mean and max predicted probabilities than the no metastasis group, indicating more prominent tumor metastasis in whole-slice images. The metastasis group's local section probabilities were higher and single-peaked, while the no-metastasis group's were lower with diverse density curves, suggesting less distinct metastatic features locally.
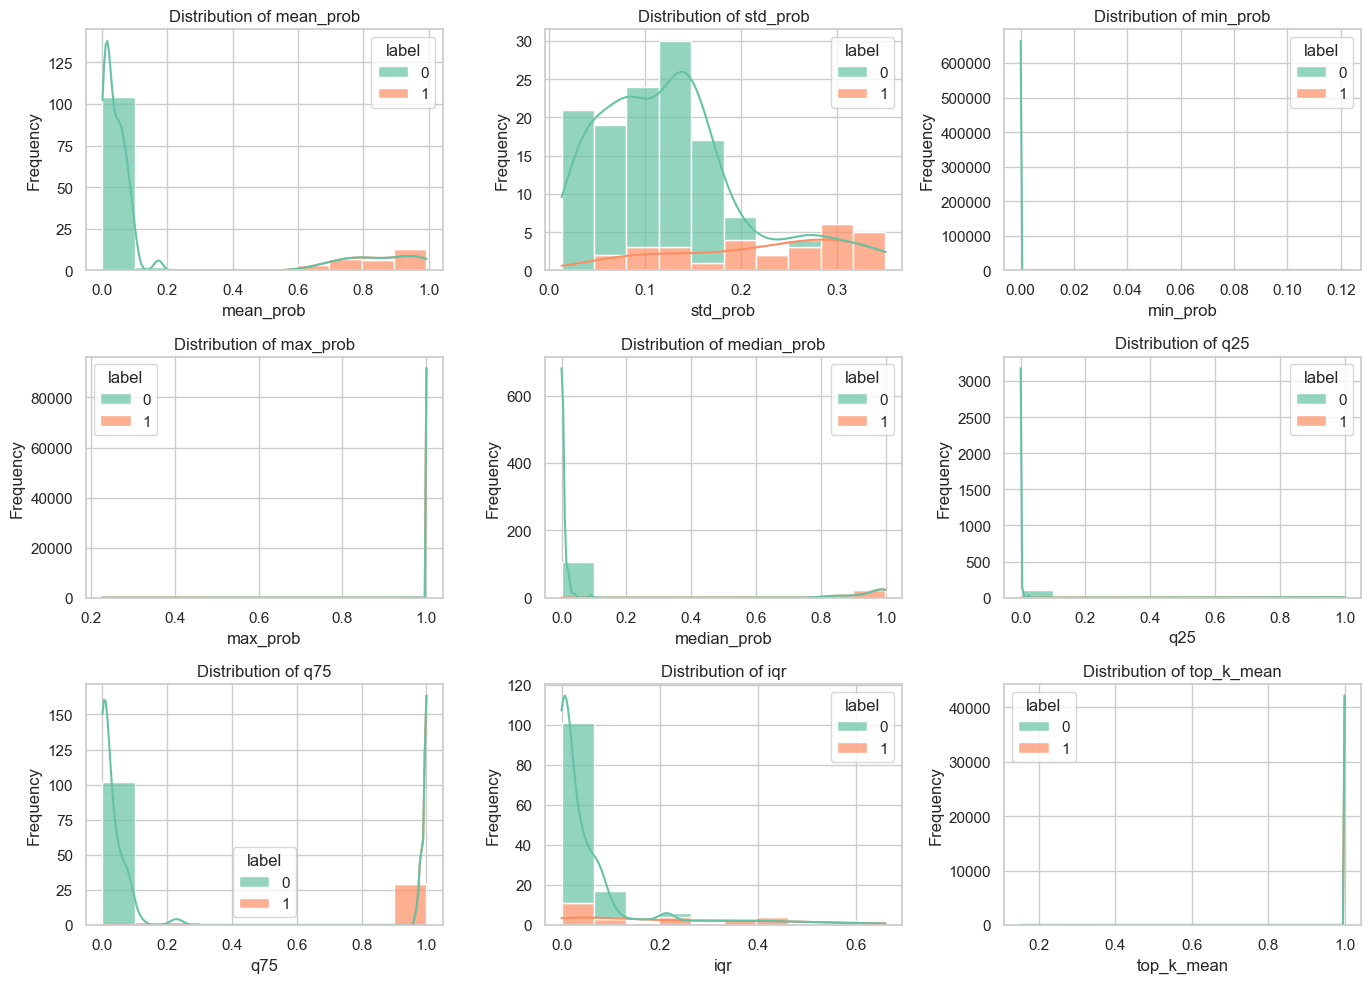
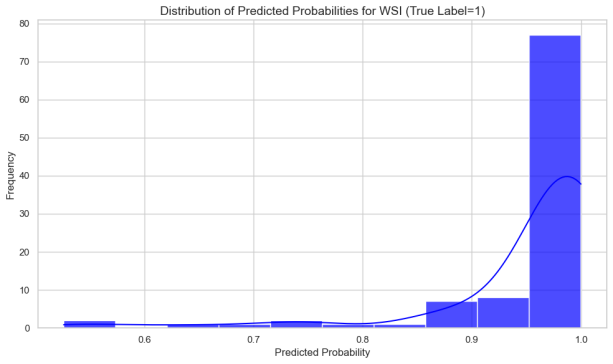
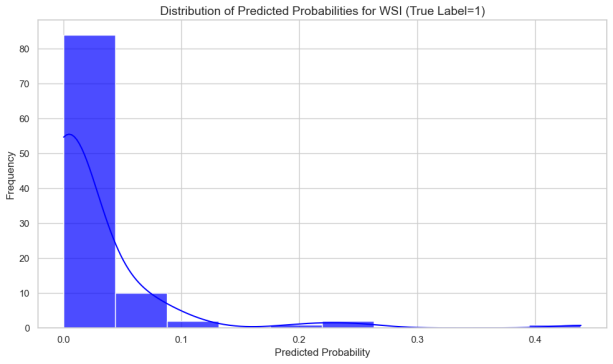
Figure 10: Overall Probability Characterization of Patch
Figure 11: Localized Patch probability distributions in the liver metastasis and no liver metastasis groups
3.4. TLSs signify a favorable prognosis in colorectal cancer
We evaluated TLS in CRC tissues via H&E staining and graded them from 0 to 4. TLS showed no significant correlation with gender, age, tumor site, stage, tumor size, differentiation, or Ki-67 expression but negatively correlated with liver metastasis (P=0.041) and P53 positivity (P=0.029)[9,10], indicating a potential link between intratumoral TLS and liver metastasis and P53 expression in CRC.
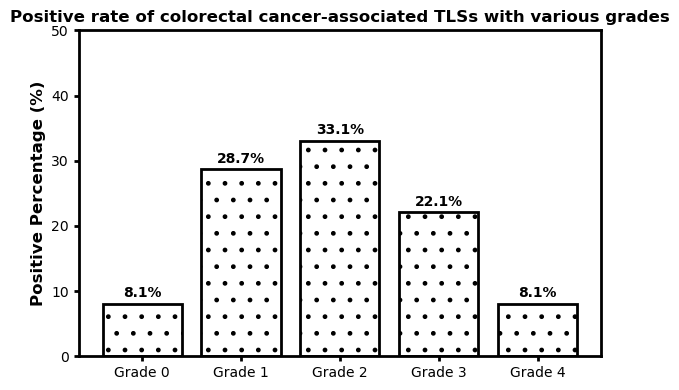
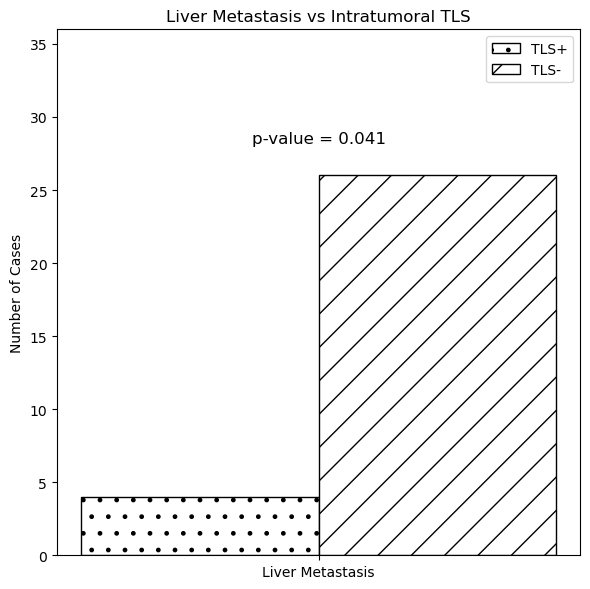
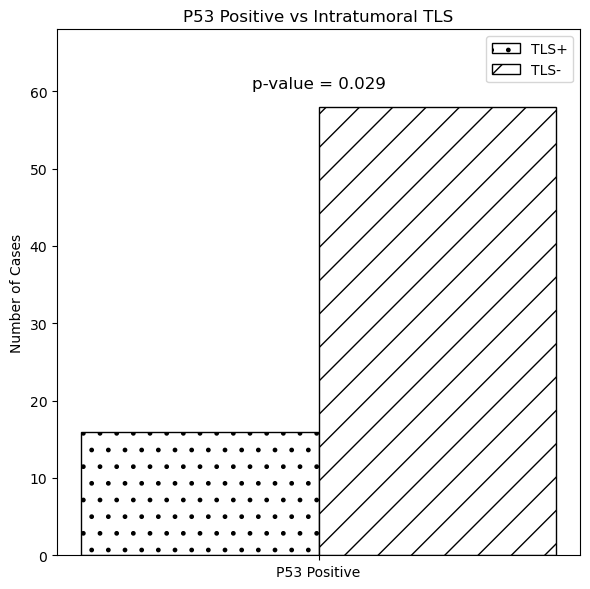
Figure 12: Colorectal cancer-related TLS grading status Fig.13.Relationship between TLS and liver metastasis, P53
3.5. Multimodal integrated model outperforms unimodal and clinical models
We developed a multimodal model using logistic regression with imaging, pathohistology, TLS scores, and gender to predict colorectal cancer liver metastasis. The model had an AUC of 0.944 and a 95% CI of 0.840-1.000, indicating strong classification capabilities. Using column-line plots, we found that lower TLS scores and higher imaging and pathohistology scores correlated with increased metastasis risk. The model could yield predictive probabilities up to 0.99, demonstrating high accuracy.
Table 4: Evaluation metrics for multimodal integration models
Set | AUC | AUC 95% CI | Accuracy | Precision | Recall | F1 score |
Train Set | 0.98 | 0.941-1.000 | 0.979 | 0.950 | 0.950 | 0.950 |
Test Set | 0.94 | 0.840-1.000 | 0.927 | 1.000 | 0.667 | 0.800 |
(a) (b)
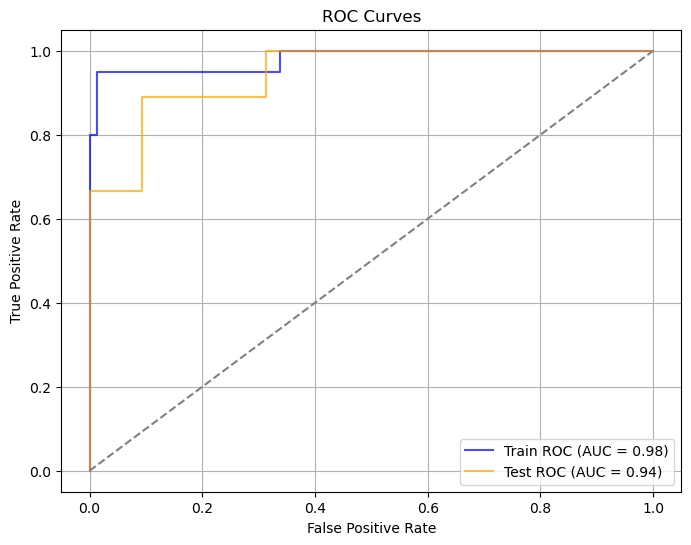
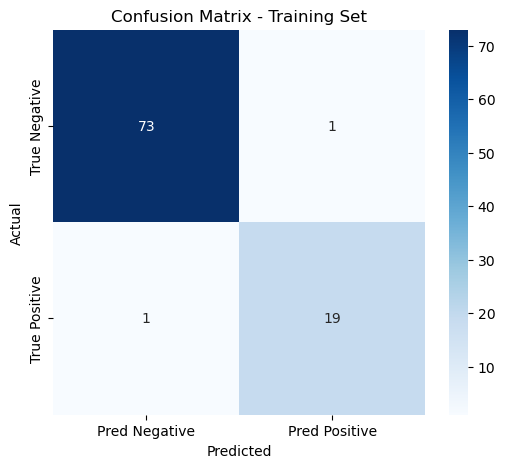
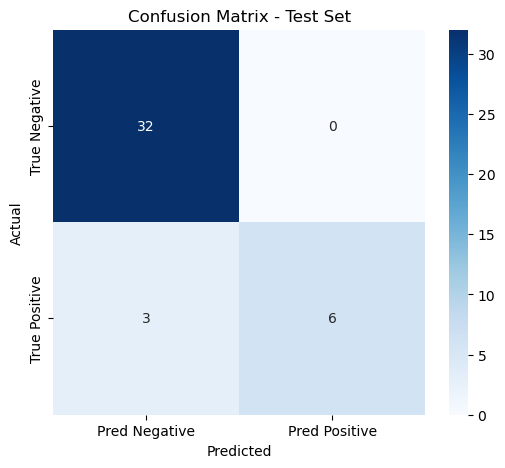
Figure 14: Evaluation of multimodal integrated model(a)ROC curves for multimodal integrated model(b)Confusion matrix for training and validation sets of multimodal integrated model
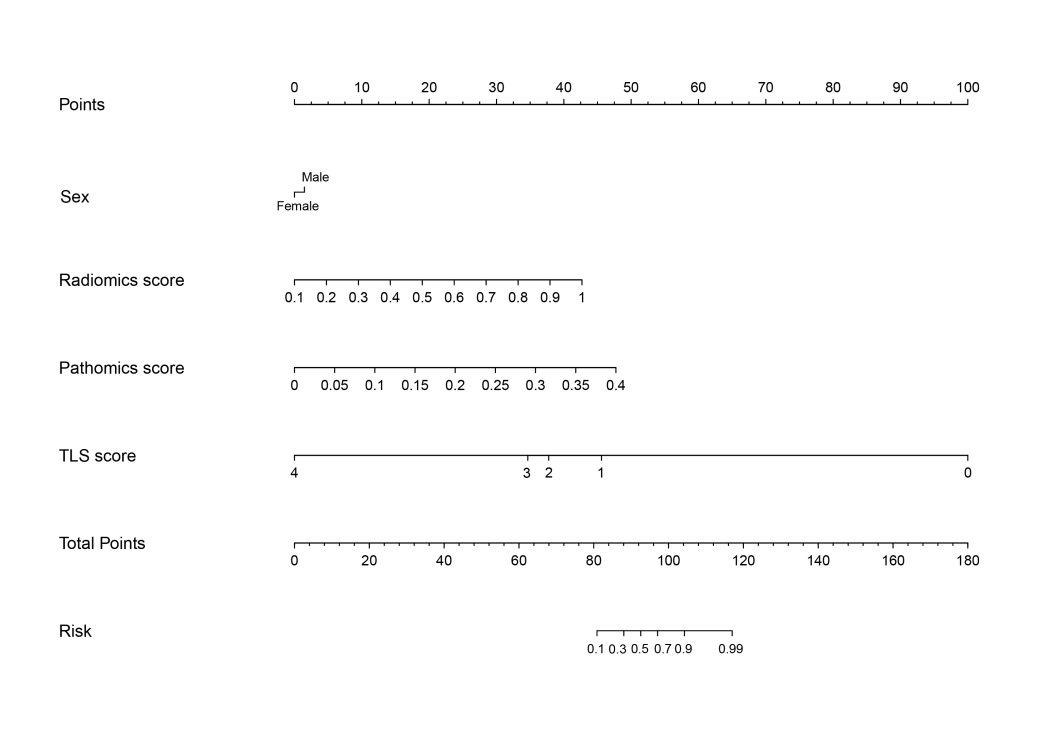
Figure 15: Column line diagram of a multimodal integration model
4. Discussion
This study introduced a multimodal model integrating radiomics, pathomics, and TLS scores for predicting colorectal cancer liver metastasis, outperforming unimodal models with an AUC of 0.94 and accuracy of 0.927. Lower TLS scores and higher imaging and pathomics scores indicated higher metastasis risk. The multimodal model was more accurate, sensitive, and specific than traditional models, highlighting its ability to capture tumor characteristics, especially in challenging cases, and compensating for single-modality limitations. The study underscores the value of combining deep learning and traditional machine learning to offer quantifiable risk scores for early diagnosis, precise treatment, and management of high-risk patients.
References
[1]. Zheng R S, Chen R, Han B F, et al.Analysis of the prevalence of malignant tumors in China in 2022[J]. Chinese Journal of Cancer, 2024. 46 (3):221-231.
[2]. Eng C, Yoshino T, Ruiz-Garcia E, et al. Colorectal cancer[J]. Lancet, 2024. 404 (10449):294-310.
[3]. Siegel R L, Miller K D, Wagle N S, et al. Cancer statistics, 2023[J]. CA Cancer J Clin, 2023. 73 (1):17-48.
[4]. Cao R, Yang F, Ma S C, et al. Development and interpretation of a pathomics-based model for the prediction of microsatellite instability in Colorectal Cancer[J]. Theranostics, 2020. 10 (24):11080-11091.
[5]. Jiang W, Wang H, Dong X, et al. Association of the pathomics-collagen signature with lymph node metastasis in colorectal cancer: a retrospective multicenter study[J]. J Transl Med, 2024. 22 (1):103.
[6]. Chen D, Lai J, Cheng J, et al. Predicting peritoneal recurrence in gastric cancer with serosal invasion using a pathomics nomogram[J]. iScience, 2023. 26 (3):106246.
[7]. Chen D, Fu M, Chi L, et al. Prognostic and predictive value of a pathomics signature in gastric cancer[J]. Nat Commun, 2022. 13 (1):6903.
[8]. Li K, Guo Q, Zhang X, et al. Oral cancer-associated tertiary lymphoid structures: gene expression profile and prognostic value[J]. Clin Exp Immunol, 2020. 199 (2):172-181.
[9]. Zhang Y, Liu G, Zeng Q, et al. CCL19-producing fibroblasts promote tertiary lymphoid structure formation enhancing anti-tumor IgG response in colorectal cancer liver metastasis[J]. Cancer Cell, 2024. 42 (8):1370-1385.
[10]. Calderaro J, Petitprez F, Becht E, et al. Intra-tumoral tertiary lymphoid structures are associated with a low risk of early recurrence of hepatocellular carcinoma[J]. J Hepatol, 2019. 70 (1):58-65.
Cite this article
Xue,J.;Chen,W.;Mao,Q.;Yu,J.;Gu,X. (2025). Development of a Novel Combined Nomogram Model Integrating Deep Learning-Pathomics, Radiomics, and TLS Score to Predict the Risk of Liver Metastasis in Colorectal Cancer Patients. Applied and Computational Engineering,119,30-37.
Data availability
The datasets used and/or analyzed during the current study will be available from the authors upon reasonable request.
Disclaimer/Publisher's Note
The statements, opinions and data contained in all publications are solely those of the individual author(s) and contributor(s) and not of EWA Publishing and/or the editor(s). EWA Publishing and/or the editor(s) disclaim responsibility for any injury to people or property resulting from any ideas, methods, instructions or products referred to in the content.
About volume
Volume title: Proceedings of the 3rd International Conference on Software Engineering and Machine Learning
© 2024 by the author(s). Licensee EWA Publishing, Oxford, UK. This article is an open access article distributed under the terms and
conditions of the Creative Commons Attribution (CC BY) license. Authors who
publish this series agree to the following terms:
1. Authors retain copyright and grant the series right of first publication with the work simultaneously licensed under a Creative Commons
Attribution License that allows others to share the work with an acknowledgment of the work's authorship and initial publication in this
series.
2. Authors are able to enter into separate, additional contractual arrangements for the non-exclusive distribution of the series's published
version of the work (e.g., post it to an institutional repository or publish it in a book), with an acknowledgment of its initial
publication in this series.
3. Authors are permitted and encouraged to post their work online (e.g., in institutional repositories or on their website) prior to and
during the submission process, as it can lead to productive exchanges, as well as earlier and greater citation of published work (See
Open access policy for details).
References
[1]. Zheng R S, Chen R, Han B F, et al.Analysis of the prevalence of malignant tumors in China in 2022[J]. Chinese Journal of Cancer, 2024. 46 (3):221-231.
[2]. Eng C, Yoshino T, Ruiz-Garcia E, et al. Colorectal cancer[J]. Lancet, 2024. 404 (10449):294-310.
[3]. Siegel R L, Miller K D, Wagle N S, et al. Cancer statistics, 2023[J]. CA Cancer J Clin, 2023. 73 (1):17-48.
[4]. Cao R, Yang F, Ma S C, et al. Development and interpretation of a pathomics-based model for the prediction of microsatellite instability in Colorectal Cancer[J]. Theranostics, 2020. 10 (24):11080-11091.
[5]. Jiang W, Wang H, Dong X, et al. Association of the pathomics-collagen signature with lymph node metastasis in colorectal cancer: a retrospective multicenter study[J]. J Transl Med, 2024. 22 (1):103.
[6]. Chen D, Lai J, Cheng J, et al. Predicting peritoneal recurrence in gastric cancer with serosal invasion using a pathomics nomogram[J]. iScience, 2023. 26 (3):106246.
[7]. Chen D, Fu M, Chi L, et al. Prognostic and predictive value of a pathomics signature in gastric cancer[J]. Nat Commun, 2022. 13 (1):6903.
[8]. Li K, Guo Q, Zhang X, et al. Oral cancer-associated tertiary lymphoid structures: gene expression profile and prognostic value[J]. Clin Exp Immunol, 2020. 199 (2):172-181.
[9]. Zhang Y, Liu G, Zeng Q, et al. CCL19-producing fibroblasts promote tertiary lymphoid structure formation enhancing anti-tumor IgG response in colorectal cancer liver metastasis[J]. Cancer Cell, 2024. 42 (8):1370-1385.
[10]. Calderaro J, Petitprez F, Becht E, et al. Intra-tumoral tertiary lymphoid structures are associated with a low risk of early recurrence of hepatocellular carcinoma[J]. J Hepatol, 2019. 70 (1):58-65.