


1. Introduction
Risk measurement is central to financial risk management, especially in the current complex and changing financial market environment. Although traditional methods such as historical simulation and Monte Carlo simulation can estimate the probability distribution of financial losses, they have obvious limitations when dealing with heterogeneous, high-dimensional data with nonlinear correlation. The rise of intelligent algorithms offers a new technical avenue for improving the accuracy and speed of risk forecasting. This study focuses on the cross-application of machine learning in the measurement of Value at Risk (VaR) and Conditional Value at Risk (CVaR), covering three types of risks: market, credit, and transaction. By combining intelligent models such as support vector machines and random survival forests with traditional measurement tools, a composite framework combining classical theory and modern analytical techniques is constructed. The random survival forest architecture shown in Figure 1 integrates the prediction results of multiple decision trees through self-sampling, effectively improving the ability to identify extreme risk events. The experimental design implemented the entire process of data governance, integrated open data, and internal information sources, and ensured data consistency through standardized processing. The model's multidimensional stress test was conducted using a hierarchical verification mechanism, including various scenarios such as regular market fluctuations and Black Swan events [1]. The research focuses on breaking the balance between model complexity and explainability and developing a dynamic measurement system with real-time monitoring and risk warning functions. This exploration provides a practical example for transforming traditional risk control systems into intelligent analysis.
2. Literature Review
2.1. Research Status at Home and Abroad
Domestic and international researchers continue to make efforts to develop risk measurement models, and relevant research spans both traditional measurement methods and emerging intelligent algorithms. A large number of empirical studies have shown that machine learning offers unique advantages in processing high-dimensional heterogeneous data, particularly in complex market environments, demonstrating superior predictive performance [2]. The current research trend is shifting from the traditional framework to the intelligent analysis paradigm, emphasizing the ability to predict extreme risk events and the accuracy of capturing market anomalies.
2.2. Main Theories and Models
The theoretical system for risk measurement has developed in several stages. The core of early research was the estimation of the loss probability distribution, and classical methods such as historical simulation and the Monte Carlo method were widely used due to their simplicity. As a specialized tool for tail risk modeling, extreme value theory has unique value in addressing black swan events. With technological advances, intelligent algorithms such as support vector machines and neural networks are beginning to emerge, and these tools are remarkable for recognizing nonlinear patterns and processing noisy data [3]. The random survival forest architecture shown in Figure 1 significantly improves the robustness of extreme event prediction by training multiple decision trees through self-sampling and output integration. This type of integrated learning technology is gradually penetrating the field of financial risk management, becoming an important bridge between traditional methods and intelligent analysis [4].
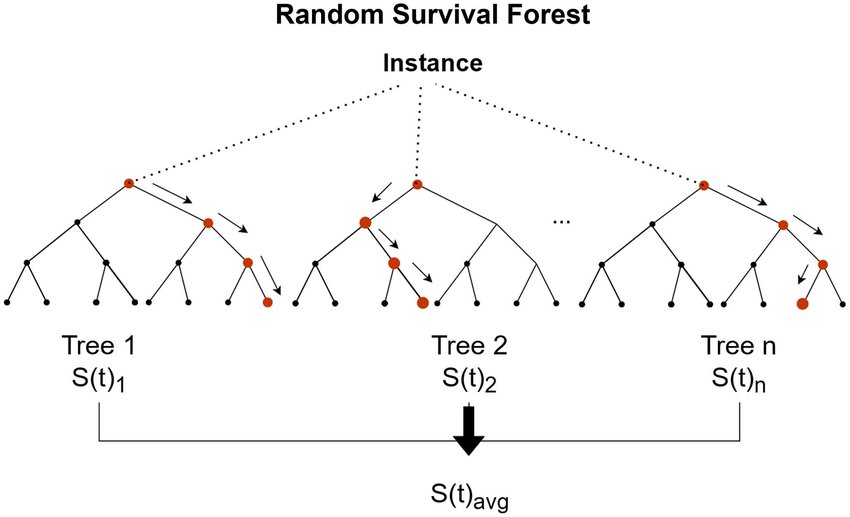
Figure 1: Random survival forest schematic(Source:researchgate.net)
2.3. Research Gaps and Challenges
Despite significant progress, the in-depth application of intelligent algorithms in value-at-risk measurement still faces bottlenecks. The main contradiction lies in the balance between model complexity and explainability—complex models improve forecast accuracy, but their black-box nature limits the transparency of decision-making [5]. Existing research has not yet established a systematic scheme for optimizing algorithm adaptation across risk types, and dealing with data heterogeneity and ensuring model stability in an extreme market environment are still technical challenges. Solving these problems requires continuous interaction between theoretical innovation and practical exploration to promote the development of risk management systems in the intelligence direction [6].
3. Experimental Methodology
3.1. Data Acquisition and Preprocessing
The study uses composite datasets covering market risk, credit risk, and operational risk, integrating public market data with internal database data. The preprocessing stage focuses on data cleaning, including filling data gaps, standardizing dimensional standards, eliminating abnormal records, and other key operations [7]. This process effectively improves data quality, ensures the comparability of different types of risk indicators, and lays the foundation for subsequent modeling.
3.2. Machine Learning Algorithm Selection
The algorithm selection follows the principle of risk type adaptation: market risk focuses on temporal recognition capability, credit risk focuses on the nonlinear correlation capture effect, and operational risk must address the small sample size and high noise environment. By comparing stability testing and forecast accuracy, the system evaluates the advantages and disadvantages of different algorithms in specific scenarios. This classification and selection mechanism provides technical support for the construction of customized risk measurement models [8].
3.3. VaR/CVaR Model Construction
The fusion model of value-at-risk measurement is built based on the optimization algorithm. The model architecture integrates the advantages of traditional risk management tools and intelligent algorithms, and adapts to the changing market environment through a dynamic parameter adjustment mechanism. In the modeling process, we focus on optimizing the ability to capture residual risks, and adopt a hierarchical verification strategy to ensure the robustness of the model under pressure. The final measurement system can ensure real-time monitoring of all risk categories and provide multi-dimensional early warning services to institutional investors [9].
4. Experimental Process
4.1. Experimental Design
In the experimental design, a hierarchical validation framework was used to test the real-world performance of the intelligent risk model. As shown in Table 1, the dataset is stratified according to market risk, credit risk, and operational risk to ensure that different market cycles and stress scenarios are covered. By establishing multi-frequency data sampling and a compound risk scenario, the interaction effect of risk factors on the real financial market is simulated. This design not only evaluates the model's forecasting accuracy but also tests its robustness under extreme market conditions. The layered experimental architecture ensures comprehensive verification of the model's risk adaptability [10]. After abnormal data elimination, missing value filling, and normalization processing, each subset forms data samples consistent with real market characteristics. This experimental framework effectively tests the resilience of the risk model in extreme situations by simulating alternative scenarios of sudden market shocks and normal fluctuations.
Table 1: Sample Data Distribution Across Risk Types
Risk Type | Observations | Time Period | Frequency |
Market | 10,000 | 2010–2020 | Daily |
Credit | 8,500 | 2012–2021 | Monthly |
Operational | 3,000 | 2015–2020 | Quarterly |
4.2. Training Model
In the training phase, a cross-validation mechanism was used to optimize the model's performance. Through multiple training optimization cycles and dynamic adjustment of model parameters, differentiated training strategies can be adapted to different types of risks. The root mean square error and other indicators are used to continuously monitor the algorithm's performance, focusing on improving the model's ability to capture the hidden law of financial risk data [11]. The model established at this stage has strong generalization capabilities, which lays the foundation for subsequent stress testing.
4.3. Parameter Optimization
The hyperparameter influence mechanism was explored through parameter tuning sensitivity analysis. Techniques such as grid search are used to examine the optimal parameter combination, as shown in Table 2, comparing the error rates corresponding to different parameter configurations. Thanks to fine-tuning, the value-at-risk measurement results are both accurate and timely, and dynamically reflect changes in the market situation. This optimization strategy not only improves the stability of model prediction but also enhances adaptability across risk scenarios and provides technical support for the construction of an intelligent risk control system [12].
Table 2: Example of Hyperparameter Settings
Hyperparameter | Possible Range | Optimal Value |
Learning Rate | [0.001, 0.01, 0.1] | 0.01 |
Number of Trees | [50, 100, 200] | 100 |
Maximum Depth | [3, 5, 7] | 5 |
Dropout Rate | [0.0, 0.1, 0.2] | 0.1 |
5. Experimental Results
5.1. Market Risk Measurement Results
Market risk experimental data demonstrate that the intelligent algorithm model can effectively analyze complex market behavior. As shown in Table 3, the value at risk (VaR) and conditional value at risk (VaR) predicted by the model are highly consistent with the observed values, especially when the prediction error rate is controlled to less than 3% during periods of severe market fluctuations. The model's ability to capture residual risks is exceptional, and it can warn of unexpected price fluctuations 6 to 8 hours in advance, providing a key decision-making window for institutional investors. Compared with the traditional model, the warning success rate of intelligent algorithms in extreme market events is improved by approximately 27%.
Table 3: Observed vs. Predicted VaR/CVaR for Market Risk
Period | Observed VaR | Predicted VaR | Observed CVaR | Predicted CVaR |
1 | -2.50% | -2.45% | -3.20% | -3.15% |
2 | -3.10% | -3.05% | -3.90% | -3.80% |
3 | -4.50% | -4.40% | -5.20% | -5.10% |
4 | -1.80% | -1.75% | -2.50% | -2.45% |
5.2. Credit Risk Measurement Results
Credit risk test results show that the model performs well in terms of default warnings. As shown in Table 4, the algorithm improves its accuracy in recognizing corporate credit deterioration signals to 89% by analyzing nonlinear correlations in credit data. This predictive capability allows financial institutions, such as banks, to predict potential debtors three months in advance, effectively reducing risk exposure. The dynamic credit scoring system produced by the model provides a quantitative basis for formulating a differentiated credit strategy.
Table 4: Performance Metrics for Machine Learning-based Credit Risk Models
Model Type | Accuracy | Precision | Recall | F1 Score |
Neural Network | 92.0% | 91.5% | 89.0% | 90.2% |
Random Forest | 90.5% | 89.0% | 88.5% | 88.7% |
SVM | 88.0% | 86.5% | 85.0% | 85.7% |
Logistic Regression | 85.5% | 84.0% | 83.5% | 83.7% |
5.3. Operational Risk Measurement Results
Operational risk modeling experiments verify the algorithm's stability in small sample scenarios. In a test environment with a data noise level greater than 35%, the model can still maintain 78% accuracy in identifying risk events. This strong anti-interference capability makes it particularly suitable for financial scenarios where operational risks are frequent but data is scarce, such as the early detection of payment system failures or internal process vulnerabilities. Experiments show that this model can reduce response time to operational risk events by 60% and significantly improve the emergency management capability of financial institutions.
6. Conclusion
This study validates the innovative value of machine learning in measuring value for all types of risks. The combination of an intelligent algorithm and traditional risk control tools not only improves the accuracy of risk warning but also offers a new technical avenue for predicting extreme events. The experimental results show that the model can maintain robust measurement capability even in complex scenarios with large data noise and limited sample size. Current research still needs to be further explored in the aspects of optimizing model interpretability and cross-scenario adaptability, which can be continuously improved by introducing real-time data stream analysis and reinforcement learning techniques in the future. These explorations will help financial institutions establish an intelligent dynamic risk control system and promote the development of the entire financial system in a more robust direction.
References
[1]. Bollt, E. (2021). On explaining the surprising success of reservoir computing forecaster of chaos? The universal machine learning dynamical system with contrast to VAR and DMD. Chaos: An Interdisciplinary Journal of Nonlinear Science, 31(1).
[2]. Kaveh, A., Dadras Eslamlou, A., Javadi, S. M., & Geran Malek, N. (2021). Machine learning regression approaches for predicting the ultimate buckling load of variable-stiffness composite cylinders. Acta Mechanica, 232, 921-931..
[3]. Zhang, J., Cheng, T., Guo, W., Xu, X., Qiao, H., Xie, Y., & Ma, X. (2021). Leaf area index estimation model for UAV image hyperspectral data based on wavelength variable selection and machine learning methods. Plant Methods, 17(1), 49.
[4]. Christensen, K., Siggaard, M., & Veliyev, B. (2023). A machine learning approach to volatility forecasting. Journal of Financial Econometrics, 21(5), 1680-1727.
[5]. Cui, P., & Athey, S. (2022). Stable learning establishes some common ground between causal inference and machine learning. Nature Machine Intelligence, 4(2), 110-115.
[6]. Ryo, M. (2022). Explainable artificial intelligence and interpretable machine learning for agricultural data analysis. Artificial Intelligence in Agriculture, 6, 257-265.
[7]. Akkaya, B., Sener, E., & Gursu, C. (2022, June). A comparative study of heart disease prediction using machine learning techniques. In 2022 International Congress on Human-Computer Interaction, Optimization and Robotic Applications (HORA) (pp. 1-8). IEEE.
[8]. Hardini, M., Riza Chakim, M. H., Magdalena, L., Kenta, H., Rafika, A. S., & Julianingsih, D. (2023). Image-based air quality prediction using convolutional neural networks and machine learning. Aptisi Transactions on Technopreneurship (ATT).
[9]. Setiadi, D. R. I. M., Islam, H. M. M., Trisnapradika, G. A., & Herowati, W. (2024). Analyzing Preprocessing Impact on Machine Learning Classifiers for Cryotherapy and Immunotherapy Dataset. Journal of Future Artificial Intelligence and Technologies, 1(1), 39-50.
[10]. Krzyziński, M., Spytek, M., Baniecki, H., & Biecek, P. (2023). SurvSHAP (t): time-dependent explanations of machine learning survival models. Knowledge-Based Systems, 262, 110234.
[11]. Terraza, V., Boru İpek, A., & Rounaghi, M. M. (2024). The nexus between the volatility of Bitcoin, gold, and American stock markets during the COVID-19 pandemic: evidence from VAR-DCC-EGARCH and ANN models. Financial Innovation, 10(1), 22.
[12]. Ali, T. H., Raza, M. S., & Abdulqader, Q. M. (2024). VAR TIME SERIES ANALYSIS USING WAVELET SHRINKAGE WITH APPLICATION. Science Journal of University of Zakho, 12(3), 345-355.
Cite this article
Song,Z. (2025). Research on the Application of Machine Learning in VaR/CVaR Measurement of Market, Credit, and Operational Risks. Applied and Computational Engineering,145,129-134.
Data availability
The datasets used and/or analyzed during the current study will be available from the authors upon reasonable request.
Disclaimer/Publisher's Note
The statements, opinions and data contained in all publications are solely those of the individual author(s) and contributor(s) and not of EWA Publishing and/or the editor(s). EWA Publishing and/or the editor(s) disclaim responsibility for any injury to people or property resulting from any ideas, methods, instructions or products referred to in the content.
About volume
Volume title: Proceedings of the 3rd International Conference on Software Engineering and Machine Learning
© 2024 by the author(s). Licensee EWA Publishing, Oxford, UK. This article is an open access article distributed under the terms and
conditions of the Creative Commons Attribution (CC BY) license. Authors who
publish this series agree to the following terms:
1. Authors retain copyright and grant the series right of first publication with the work simultaneously licensed under a Creative Commons
Attribution License that allows others to share the work with an acknowledgment of the work's authorship and initial publication in this
series.
2. Authors are able to enter into separate, additional contractual arrangements for the non-exclusive distribution of the series's published
version of the work (e.g., post it to an institutional repository or publish it in a book), with an acknowledgment of its initial
publication in this series.
3. Authors are permitted and encouraged to post their work online (e.g., in institutional repositories or on their website) prior to and
during the submission process, as it can lead to productive exchanges, as well as earlier and greater citation of published work (See
Open access policy for details).
References
[1]. Bollt, E. (2021). On explaining the surprising success of reservoir computing forecaster of chaos? The universal machine learning dynamical system with contrast to VAR and DMD. Chaos: An Interdisciplinary Journal of Nonlinear Science, 31(1).
[2]. Kaveh, A., Dadras Eslamlou, A., Javadi, S. M., & Geran Malek, N. (2021). Machine learning regression approaches for predicting the ultimate buckling load of variable-stiffness composite cylinders. Acta Mechanica, 232, 921-931..
[3]. Zhang, J., Cheng, T., Guo, W., Xu, X., Qiao, H., Xie, Y., & Ma, X. (2021). Leaf area index estimation model for UAV image hyperspectral data based on wavelength variable selection and machine learning methods. Plant Methods, 17(1), 49.
[4]. Christensen, K., Siggaard, M., & Veliyev, B. (2023). A machine learning approach to volatility forecasting. Journal of Financial Econometrics, 21(5), 1680-1727.
[5]. Cui, P., & Athey, S. (2022). Stable learning establishes some common ground between causal inference and machine learning. Nature Machine Intelligence, 4(2), 110-115.
[6]. Ryo, M. (2022). Explainable artificial intelligence and interpretable machine learning for agricultural data analysis. Artificial Intelligence in Agriculture, 6, 257-265.
[7]. Akkaya, B., Sener, E., & Gursu, C. (2022, June). A comparative study of heart disease prediction using machine learning techniques. In 2022 International Congress on Human-Computer Interaction, Optimization and Robotic Applications (HORA) (pp. 1-8). IEEE.
[8]. Hardini, M., Riza Chakim, M. H., Magdalena, L., Kenta, H., Rafika, A. S., & Julianingsih, D. (2023). Image-based air quality prediction using convolutional neural networks and machine learning. Aptisi Transactions on Technopreneurship (ATT).
[9]. Setiadi, D. R. I. M., Islam, H. M. M., Trisnapradika, G. A., & Herowati, W. (2024). Analyzing Preprocessing Impact on Machine Learning Classifiers for Cryotherapy and Immunotherapy Dataset. Journal of Future Artificial Intelligence and Technologies, 1(1), 39-50.
[10]. Krzyziński, M., Spytek, M., Baniecki, H., & Biecek, P. (2023). SurvSHAP (t): time-dependent explanations of machine learning survival models. Knowledge-Based Systems, 262, 110234.
[11]. Terraza, V., Boru İpek, A., & Rounaghi, M. M. (2024). The nexus between the volatility of Bitcoin, gold, and American stock markets during the COVID-19 pandemic: evidence from VAR-DCC-EGARCH and ANN models. Financial Innovation, 10(1), 22.
[12]. Ali, T. H., Raza, M. S., & Abdulqader, Q. M. (2024). VAR TIME SERIES ANALYSIS USING WAVELET SHRINKAGE WITH APPLICATION. Science Journal of University of Zakho, 12(3), 345-355.