


1. Introduction
With the emerging development of deep learning based method [1, 2, 3, 4], many method with novel backbones are proposed, such as AlexNet [5], VGG [6], ResNet [7], DenseNet [8] and inception [9] network. Measuring quality of life is a challenging task because of the context-sensitivity of its different possible definitions and factors. However, if the degree of influence of each factor can be analyzed and observed, it is easy to carry out results and some practical operations. To this end, in this paper, the authors aim to predict the happiness index of different countries. It is also the reason why this dataset is suitable for the goal. The studies examine the current state of happiness in the globe and demonstrate how the personal and regional variations in happiness are explained by the new science of happiness. Data from the Gallup World Poll [10] is used to calculate the happiness scores and rankings. Based on responses to the main life evaluation question in the survey, the results are calculated. Thus, this dataset is totally plausible. Additionally, the six components that make up happiness—economic productivity, social support, life expectancy, freedom, lack of corruption, and generosity—are separately estimated in the columns that follow the happiness score. Those factors can help to predict the next year’s world happiness index, and get a clear view of people’s life quality nowadays. People can continue future research and take concrete steps by using the datasets the authors analyzed to explain why certain countries rank higher than others. In order to extract spatial features from remote sensing pictures for the prediction of water resources, the model in [11] consists of a number of structure learning assisted feature fusion layers. They compared the computational outcomes of their method with those of other methods (such as DeepLabv3+, VGG, NDWI, SegNet, DenseNet, and ResNet) in order to validate the prediction performance of their approach. They eventually come to the conclusion that there is a strong association between the farmer's degree of wellbeing and the availability of water resources at that specific location. In summary, additional social factors including urban development, food security, and many others are correlated with people's levels of happiness. A supervised machine-learning analytical model that forecasts the life satisfaction score of any particular country based on these provided parameters is presented in this research paper [12]. This work is a layered generalization based on a novel method that integrates various machine learning techniques to provide a meta machine learning model that further helps to maximize prediction accuracy. This test reveals one unexpected result, which is that even though a nation is developed, it does not necessarily imply that its citizens are content. This study [13] examines the relationship between the daily happy sentiment (DHS) and the Singapore Straits Times Index (STI) stock performance indicator utilizing the newly developed Twitter happiness index, VAR regression, and linear and nonlinear Granger causality tests. The empirical findings demonstrate that DHS significantly predicts STI returns in the future. For realized volatility, on the other hand, no strong predictive power is found. The authors used SVM and naive Bayes for prediction. First, the authors completed data normalization, and next, the authors tested each method on a public dataset using both methods. Then, the authors got the results that the SVM model for prediction got 92% accuracy in the test set. And the naive Bayes model prediction achieves 87% accuracy. At last, they created a confusion matrix based on this data. Additionally, the result showed that the economy and health play the most critical role in the happiness index.
2. Method
2.1. Support Vector Machine (SVM)
Support Vector Machine is a powerful learning technique that can often be used in binomial classification problems. Support vector machines combine data based on type, with data of the same type being stored in a hyperplane to facilitate classification tasks. It is a type of supervised learning algorithm and can correctly classify unseen data. Because of its high processing speed and remarkable performance, it can be used for learning small fractions of data. In addition, it can be applied to complex predictions due to its flexible data requirements.
2.2. Naive bayes
Naive Bayes is another classification algorithm that can consistently classify data. Its model can handle scarce data, while reducing the importance of missing values in the data. Naive Bayes is a conditional probability model which is conditional on a number of feature variables. Due to dimensionality constraints, these eigenvariables are calculated independently of each other. The algorithm is based on a stable formula, which allows it to classify more complex data. In the prediction of the happiness index, the classification of different features reflects its stability.
3. Experiments
3.1. Dataset description
The data used in this work was obtained from the website Kaggle. And consisted of a total of 156 countries' happiness indices for the years 2015 to 2019, based on six factors, including economic status, educational status and health. There is only one missing value in the data.To improve the accuracy of the data, the data was pre-processed by a combination of data from all years into a common table with the happiness index and its influencing factors from 2015 to 2019. The only missing values in this dataset were also replaced with mean values. The table is arranged by happiness index, while all data are normalized. It was also binary classified according to the size of the happiness index.
3.2. Comparison results
The forecasts are based on different models, which demonstrate different levels of accuracy. As this model is a long-term trend forecast. The accuracy achieved through both the support vector machine (SVM) and Naïve Bayes models is relatively high. The accuracy is listed in Table 1.
Table 1. Accuracy of the utilized methods.
Model names | Accuracy rate |
support vector machine (SVM) | 91.67% |
Naïve Bayes | 86.54% |
These forecasts were all achieved with high accuracy because of the binomial classification. The higher accuracy achieved by the support vector machine method due to the fact that it is a form of supervised learning, as different factors have a more random effect on themselves and trends change, whereas Naïve Bayes is slower to respond to such. It can be observed that support vector machine (SVM) is accurate enough to predict future trends based on its very high accuracy rate.
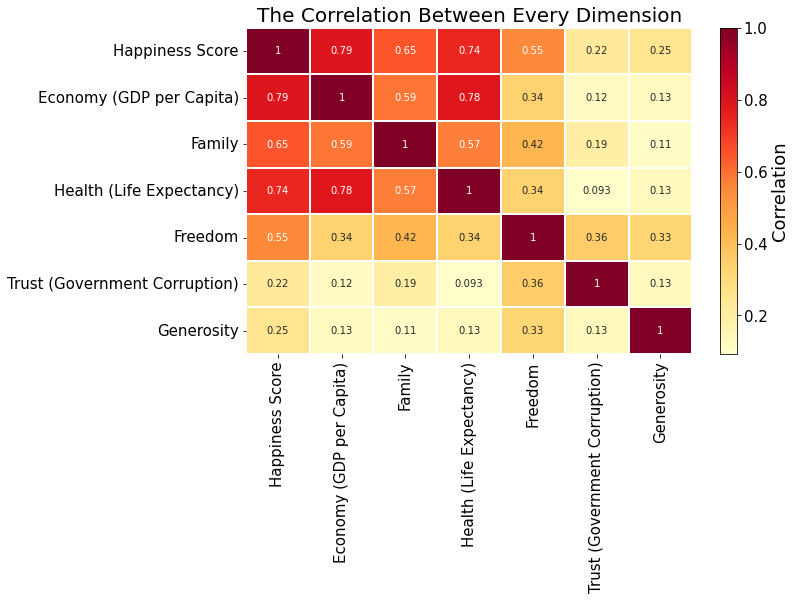
3.3. Feature correlation on happiness index prediction
This work has classified the different influences into three categories: significant, influential and minimal. In the graph, the correlation between economic 0.79 and life expectancy 0.74 was classified as significant. Then the correlation between social support (family) 0.65 and freedom 0.55 was classified as influential. Finally, trust in government and generosity with a correlation of less than 0.25 were classified in the last category, as these factors have little to no impact on the happiness index. These data also show another fact: the correlation between trust in government and generosity and other factors is also very low. The feature selection is shown in Figure 1.
|
Figure 1. Illustration of feature correlation. |
4. Conclusion
Since happiness is such an important thing for every country in the world, people always said that only people who live happily can show the real strength of the country. Thus, this paper is very important for the whole world's development. From the images the authors identify before, the authors learned that economy and health had the largest effect on happiness, while generosity and trust had the least effect. The authors chose CSV and Naive Bases as our methods since both of them give straightforward results for the dataset. The authors can find from the experiment that SVM can get better results, and the final result is 92% accuracy. After analysing those data and images, the authors came up with lots of thoughts. For future work, the conclusion is that which factors have the greatest impact on happiness, the authors can continue to study them and do what the authors can to help. The authors can encourage the community to donate more and organize some charities to do effective outreach. In addition, the authors can do more research on other factors and think about how people can effectively increase these factors to effectively increase the world's happiness in more ways than a few.
References
[1]. Goodfellow, I., Bengio, Y., & Courville, A. (2016). Deep learning. MIT press.
[2]. LeCun, Y., Bengio, Y., & Hinton, G. (2015). Deep learning. nature, 521(7553), 436-444.
[3]. Pouyanfar, S., Sadiq, S., Yan, Y., Tian, H., Tao, Y., Reyes, M. P., ... & Iyengar, S. S. (2018). A survey on deep learning: Algorithms, techniques, and applications. ACM Computing Surveys (CSUR), 51(5), 1-36.
[4]. Shrestha, A., & Mahmood, A. (2019). Review of deep learning algorithms and architectures. IEEE Access, 7, 53040-53065.
[5]. Krizhevsky, A., Sutskever, I., & Hinton, G. E. (2012). Imagenet classification with deep convolutional neural networks. Advances in neural information processing systems, 25, 1097-1105.
[6]. Simonyan, K., & Zisserman, A. (2014). Very deep convolutional networks for large-scale image recognition. arXiv preprint arXiv:1409.1556.
[7]. He, K., Zhang, X., Ren, S., & Sun, J. (2016). Deep residual learning for image recognition. In Proceedings of the IEEE conference on computer vision and pattern recognition (pp. 770-778).
[8]. Huang, G., Liu, Z., Van Der Maaten, L., & Weinberger, K. Q. (2017). Densely connected convolutional networks. In Proceedings of the IEEE conference on computer vision and pattern recognition (pp. 4700-4708).
[9]. Szegedy, C., Vanhoucke, V., Ioffe, S., Shlens, J., & Wojna, Z. (2016). Rethinking the inception architecture for computer vision. In Proceedings of the IEEE conference on computer vision and pattern recognition (pp. 2818-2826).
[10]. Resource from https://www.kaggle.com/datasets/unsdsn/world-happiness
[11]. Afaq, Y., & Manocha, A. (2021). Happiness Index Determination by Analyzing Satellite Images for Urbanization. Applied Artificial Intelligence, 35(15), 1466-1489.
[12]. Zhao, R. (2019). Quantifying the correlation and prediction of daily happiness sentiment and stock return: The Case of Singapore. Physica A: Statistical Mechanics and its Applications, 533, 122020.
[13]. Prashanthi, B., & Ponnusamy, R. (2019). Future Prediction of World Countries Emotions Status to Understand Economic Status using Happiness Index and SVM Kernel. Future, 6(11).
Cite this article
Liu,A.;Zhang,Y. (2023). Happiness index prediction using machine learning algorithms. Applied and Computational Engineering,5,386-389.
Data availability
The datasets used and/or analyzed during the current study will be available from the authors upon reasonable request.
Disclaimer/Publisher's Note
The statements, opinions and data contained in all publications are solely those of the individual author(s) and contributor(s) and not of EWA Publishing and/or the editor(s). EWA Publishing and/or the editor(s) disclaim responsibility for any injury to people or property resulting from any ideas, methods, instructions or products referred to in the content.
About volume
Volume title: Proceedings of the 3rd International Conference on Signal Processing and Machine Learning
© 2024 by the author(s). Licensee EWA Publishing, Oxford, UK. This article is an open access article distributed under the terms and
conditions of the Creative Commons Attribution (CC BY) license. Authors who
publish this series agree to the following terms:
1. Authors retain copyright and grant the series right of first publication with the work simultaneously licensed under a Creative Commons
Attribution License that allows others to share the work with an acknowledgment of the work's authorship and initial publication in this
series.
2. Authors are able to enter into separate, additional contractual arrangements for the non-exclusive distribution of the series's published
version of the work (e.g., post it to an institutional repository or publish it in a book), with an acknowledgment of its initial
publication in this series.
3. Authors are permitted and encouraged to post their work online (e.g., in institutional repositories or on their website) prior to and
during the submission process, as it can lead to productive exchanges, as well as earlier and greater citation of published work (See
Open access policy for details).
References
[1]. Goodfellow, I., Bengio, Y., & Courville, A. (2016). Deep learning. MIT press.
[2]. LeCun, Y., Bengio, Y., & Hinton, G. (2015). Deep learning. nature, 521(7553), 436-444.
[3]. Pouyanfar, S., Sadiq, S., Yan, Y., Tian, H., Tao, Y., Reyes, M. P., ... & Iyengar, S. S. (2018). A survey on deep learning: Algorithms, techniques, and applications. ACM Computing Surveys (CSUR), 51(5), 1-36.
[4]. Shrestha, A., & Mahmood, A. (2019). Review of deep learning algorithms and architectures. IEEE Access, 7, 53040-53065.
[5]. Krizhevsky, A., Sutskever, I., & Hinton, G. E. (2012). Imagenet classification with deep convolutional neural networks. Advances in neural information processing systems, 25, 1097-1105.
[6]. Simonyan, K., & Zisserman, A. (2014). Very deep convolutional networks for large-scale image recognition. arXiv preprint arXiv:1409.1556.
[7]. He, K., Zhang, X., Ren, S., & Sun, J. (2016). Deep residual learning for image recognition. In Proceedings of the IEEE conference on computer vision and pattern recognition (pp. 770-778).
[8]. Huang, G., Liu, Z., Van Der Maaten, L., & Weinberger, K. Q. (2017). Densely connected convolutional networks. In Proceedings of the IEEE conference on computer vision and pattern recognition (pp. 4700-4708).
[9]. Szegedy, C., Vanhoucke, V., Ioffe, S., Shlens, J., & Wojna, Z. (2016). Rethinking the inception architecture for computer vision. In Proceedings of the IEEE conference on computer vision and pattern recognition (pp. 2818-2826).
[10]. Resource from https://www.kaggle.com/datasets/unsdsn/world-happiness
[11]. Afaq, Y., & Manocha, A. (2021). Happiness Index Determination by Analyzing Satellite Images for Urbanization. Applied Artificial Intelligence, 35(15), 1466-1489.
[12]. Zhao, R. (2019). Quantifying the correlation and prediction of daily happiness sentiment and stock return: The Case of Singapore. Physica A: Statistical Mechanics and its Applications, 533, 122020.
[13]. Prashanthi, B., & Ponnusamy, R. (2019). Future Prediction of World Countries Emotions Status to Understand Economic Status using Happiness Index and SVM Kernel. Future, 6(11).