


1. Introduction
Currently, the world faces the looming threat of energy scarcity. Traditional fossil fuel reserves are steadily depleting, and their prices are subject to extreme volatility [1]. Concurrently, environmental pollution has reached alarming levels, with vehicle emissions being a major contributor. Pure electric vehicles (EVs), powered by electricity, offer a promising solution to mitigate energy shortages and significantly reduce exhaust emissions. Research in this field is a critical step toward overcoming the dual challenges of energy insecurity and environmental degradation, paving the way for sustainable development [2-3].
Leveraging the advanced simulation capabilities of AVL-Cruise and the analytical power of MATLAB, I developed and refined a mathematical equation to describe the relationship between key parameters and the overall performance of pure electric vehicles [4]. This study integrates comprehensive data analysis and model fitting techniques, providing deeper insights into the factors that influence EV performance. This study is to offer valuable knowledge that can guide the optimization of EV design, ultimately fostering the development of more efficient and environmentally friendly vehicles [5-6].
2. Dynamic simulation
2.1. Quation of motion for automobiles
The driving force of an electric vehicle during operation is derived from the torque output by the electric motor. It is transmitted to the wheels through the transmission device, and the friction between the tires and the ground propels the vehicle forward. Models equipped with high - power motors can achieve high - performance acceleration. Even when fully loaded or climbing slopes, they can handle these situations with ease, meeting diverse power requirements for travel. The power performance of an electric vehicle is still evaluated by three indicators: maximum speed, acceleration performance, and climbing performance [7].
In a pure electric vehicle, the driving force of the drive motor on the driving wheel can be expressed as.
\( {F_{t}}=\frac{{T_{e}}{i_{t}}{η_{t}}}{r} \)
In the formula, \( {F_{t}} \) represents the driving force of the electric vehicle, \( {T_{e}} \) represents the output torque of the motor, \( {i_{t}} \) represents the overall transmission ratio of the transmission system, \( {η_{t}} \) represents the efficiency of the transmission system, and \( r \) represents the rolling radius of the tire.
When a vehicle is traveling at a constant speed on a horizontal road, it must overcome the rolling resistance from the ground and the air resistance from the air. These two resistances exist under any driving conditions. When the vehicle is traveling on an incline or accelerating, it also needs to overcome the grade resistance and acceleration resistance.
According to the above four equations of vehicle resistance, the vehicle driving equation can be obtained as \( {F_{t}}={F_{f}}+{F_{w}}+{F_{i}}+{F_{j}} \) , that is
\( {F_{t}}=\frac{{T_{e}}{i_{t}}{η_{t}}}{r}=mgfcos{α}+\frac{{C_{D}}Αu_{a}^{2}}{21.15}+mgsin{α}+δm\frac{du}{dt} \)
When a vehicle is traveling at a constant speed, the power required to be provided by the motor is.
\( {P_{m}}=\frac{1}{{η_{Τ}}}(\frac{mgf{u_{a}}}{3600}+\frac{{C_{D}}Αu_{a}^{3}}{76140}) \)
Among them, \( {η_{Τ}} \) is the efficiency of the transmission system, and \( {u_{a}} \) is the vehicle's driving speed.
Therefore, the electric energy consumed by the electric drive system during the constant-speed driving time \( {t_{t}} \) is.
\( {Q_{t}}=\frac{1}{3.6}\int _{0}^{{t_{t}}}\frac{{P_{m}}}{{η_{b}}{η_{m}}}dt \)
At the same time, the cruising range of an electric vehicle under the constant - speed driving condition of the vehicle is.
\( {s_{t}}=\frac{{u_{a}}}{3600}{t_{t}} \)
When the vehicle is accelerating uniformly, in addition to overcoming the rolling resistance and air resistance, the drive motor also needs to provide the power consumed to overcome the acceleration resistance. Therefore, the power provided by the motor is.
\( {P_{m}}=\frac{1}{{η_{Τ}}}(\frac{mgf{u_{a}}}{3600}+\frac{{C_{D}}Αu_{a}^{3}}{76140}+\frac{δm{u_{a}}}{3600}\frac{du}{dt}) \)
Among them, the acceleration is \( \frac{du}{dt} \) .
The acceleration time when the vehicle is accelerating at a constant rate is.
\( {t_{a}}=\frac{{u_{a2}}-{u_{a1}}}{3.6\frac{du}{d{t_{a}}}} \)
It can be obtained that the energy consumption of the electric drive system during the constant - acceleration driving time \( {t_{a}} \) can be expressed as.
\( {Q_{a}}=\frac{1}{3.6}\int _{0}^{{t_{a}}}\frac{{P_{m}}}{{η_{b}}{η_{m}}}dt \)
At the same time, the driving distance under the constant - acceleration condition is.
\( {s_{a}}=\frac{u_{a2}^{2}-u_{a1}^{2}}{25.92\frac{du}{dt}} \)
When the vehicle is decelerating, part of the braking energy can be recovered as the motor operates in the power - generation state, stored in the power battery, and reused. The braking - energy - recovery power of the motor is.
\( {P_{m}}=\frac{φ}{{η_{Τ}}}(\frac{mgf{u_{a}}}{3600}+\frac{{C_{D}}Αu_{a}^{3}}{76140}+\frac{δm{u_{a}}}{3600}\frac{du}{dt}) \)
Among them, \( \frac{du}{dt} \) is the deceleration, \( φ \) is the braking energy recovery proportion coefficient, where \( 0≤φ≤1 \) , which means the ratio of the braking energy recovered by the motor to the total braking energy.
The deceleration time is.
\( {t_{d}}=\frac{{u_{a2}}-{u_{a3}}}{3.6\frac{du}{dt}} \)
Within \( {t_{d}} \) , the electrical energy recovered by the electric drive system during decelerated driving is.
\( {Q_{d}}=\frac{1}{3.6}\int _{0}^{{t_{d}}}{P_{m}}{η_{b}}{η_{m}}dt \)
Under the decelerated - driving condition, the driving distance of the electric vehicle is.
\( {S_{a}}=\frac{u_{a2}^{2}-u_{a3}^{2}}{25.92\frac{du}{d{t_{d}}}} \)
When an electric vehicle is stationary, the energy consumption \( {Q_{s}} \) of the drive system is zero.
Under the FTP72 cycle operating conditions, the energy consumption of the entire test cycle is...
\( {Q_{z}}=\sum {Q_{t}}+\sum {Q_{a}}-\sum {Q_{d}}+\sum {Q_{s}} \)
2.2. Select electric vehicle parameters
The vehicle model and selected vehicle parameters are shown in Figure 1 and Table 1
Table 1: the parameters of the electric vehicle model.
Drive parameters | |
projects | values |
Kerb mass kg | 1980kg |
Gross weight kg | 2430kg |
tire friction coefficient | Dry land 0.6-0.7 wetland 0.4-0.5 |
Coefficient of air resistance | 0.195 |
Frontal area m² | 2.86m² |
Wheelbase mm | 3000mm |
Reference wheel load N | The kerb mass ranges from 1980 kg to 2250 kg, and the gross vehicle mass ranges from 2430 kg to 2655 kg. |
Static rolling radius mm(specifications 235/55 R19 ) | 330mm-350mm |
Static Rolling Radius mm | 340mm-360mm |
Automobile battery | 101kWh |
Initial cost | 80% |
Rated voltage V | 400V |
Maximum voltage V | 800V |
Minimum voltage V | 300V |
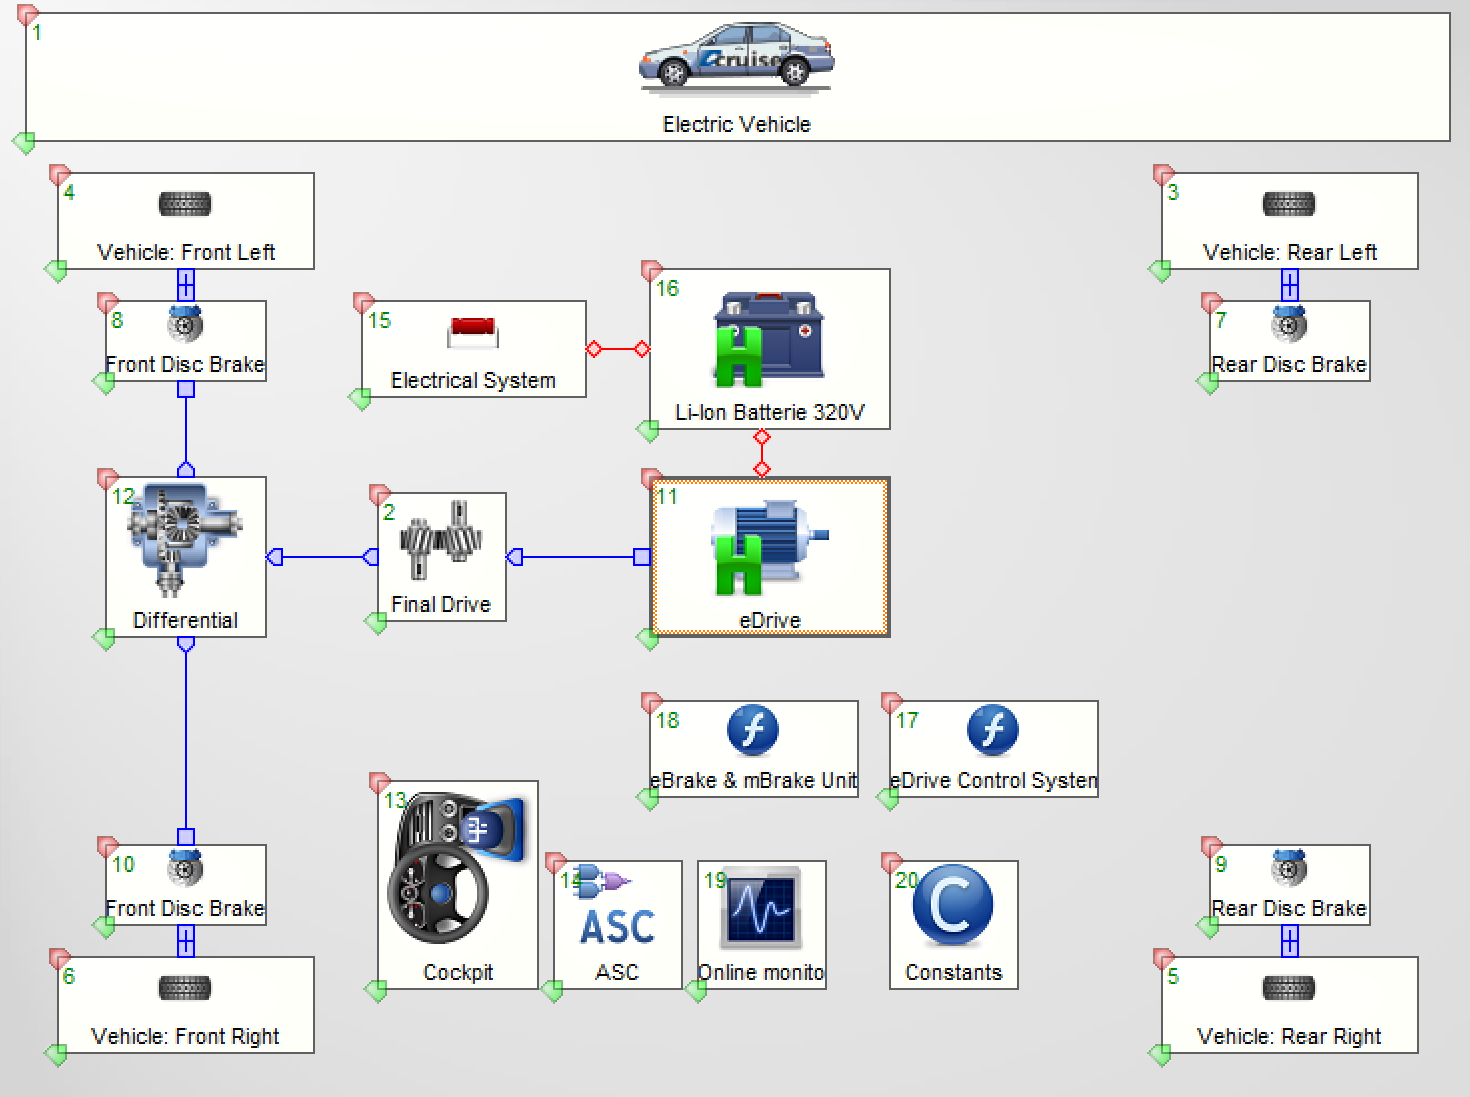
Figure 1: presents the cycle simulation of the electric vehicle.
2.3. Analysis of Simulation Results
In order to deepen understanding of the vehicle's performance, this study conducted simulation tests on acceleration, maximum speed, and climbing ability in a suitable environment and based on specific vehicle conditions.
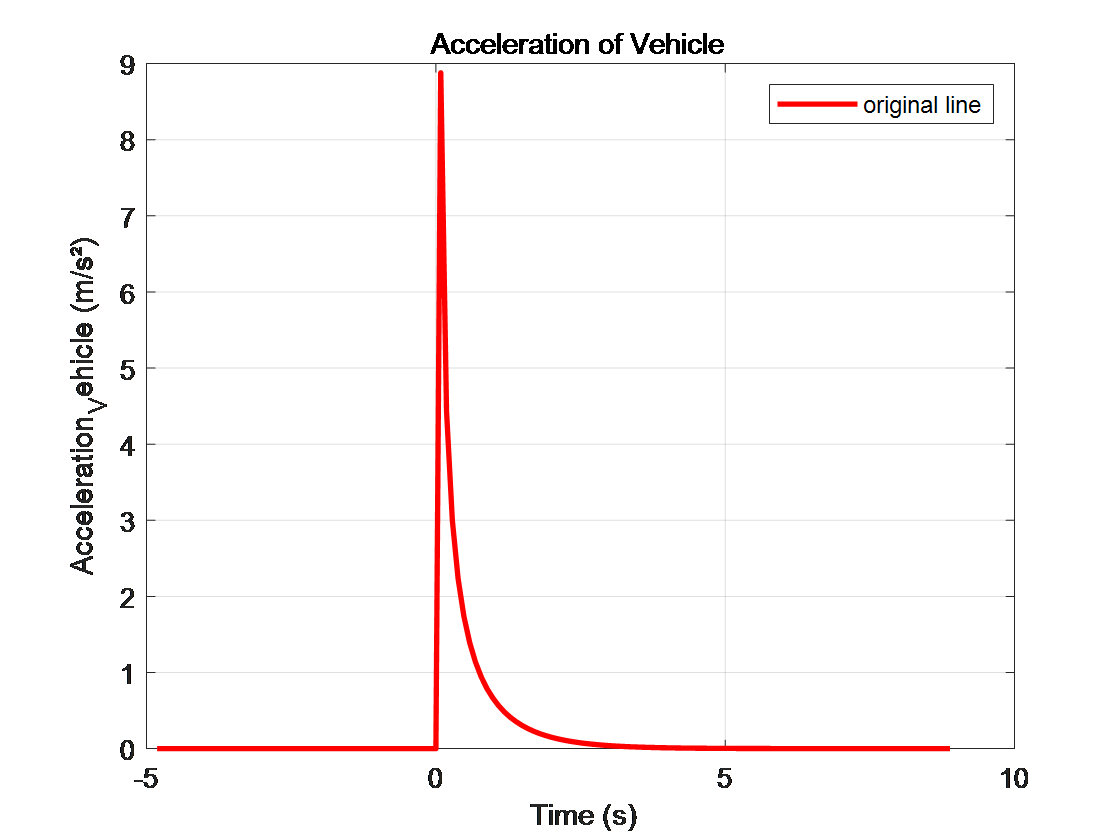
Figure 2: Acceleration Performance Simulation
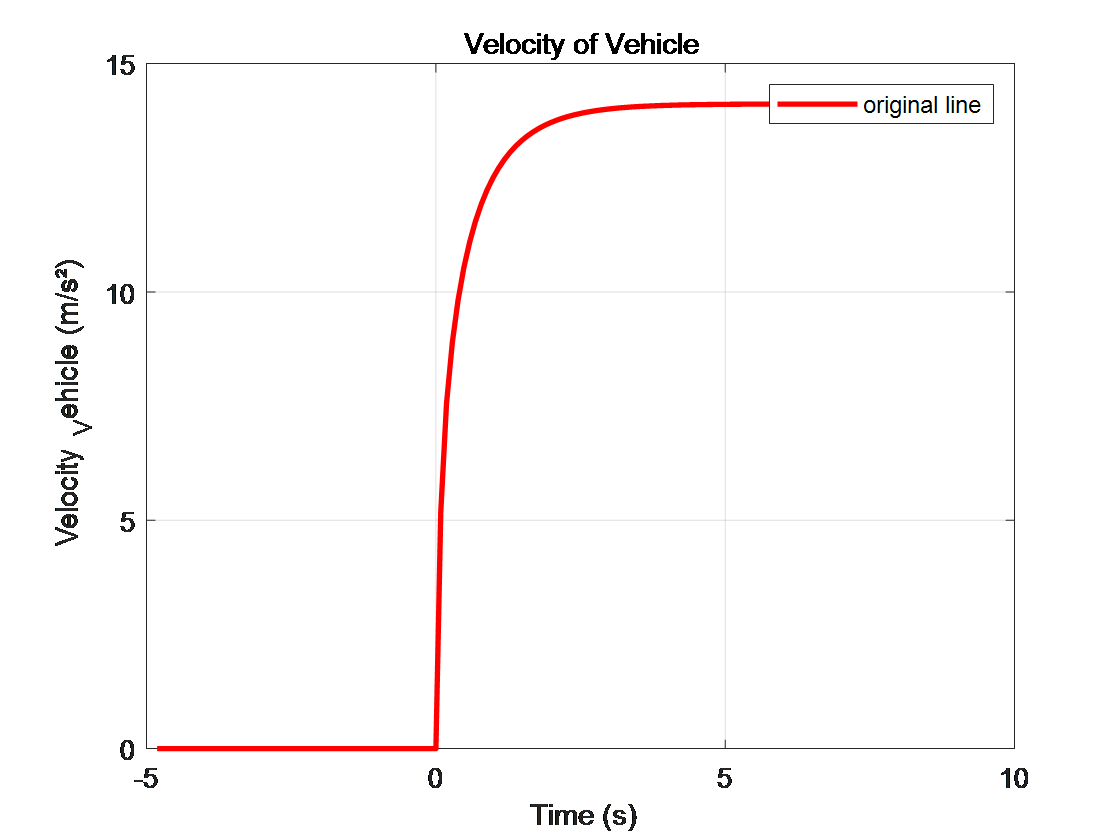
Figure 3: Maximum Speed Acceleration
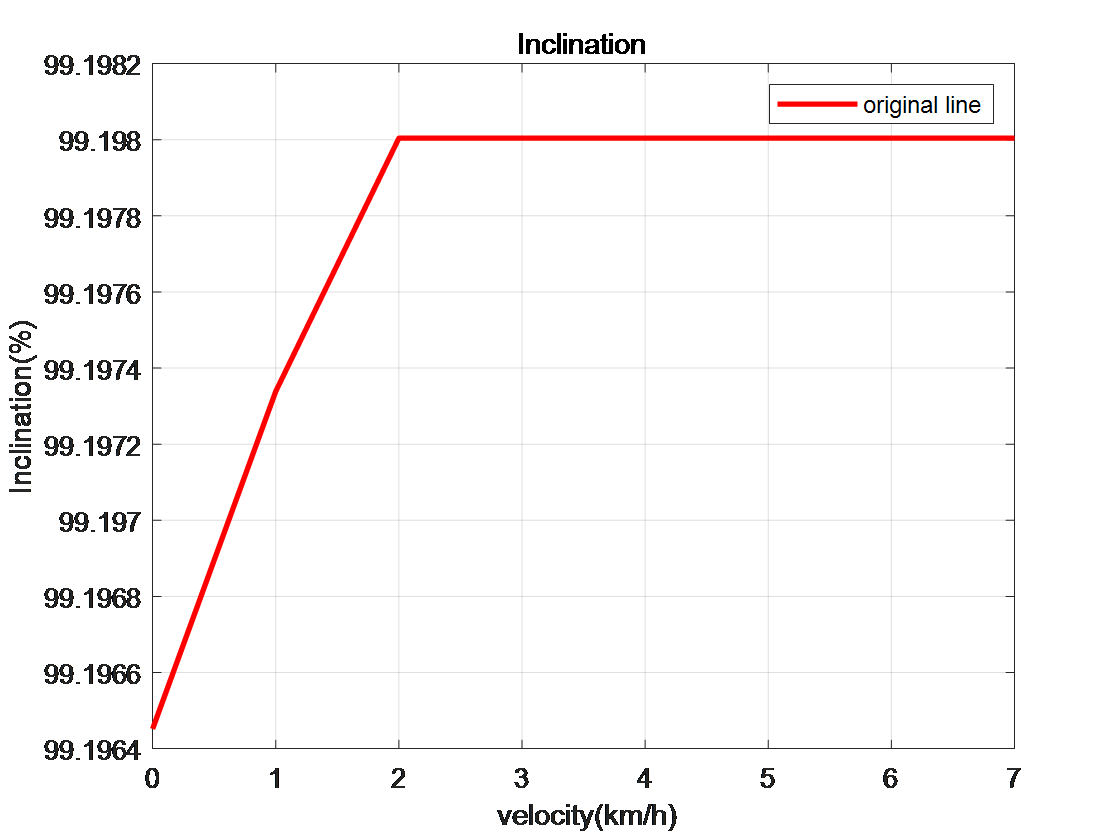
Figure 4: Climbing Performance
As can be seen from Figures 2, 3 and 4 obtained through simulation, the maximum acceleration of this pure electric vehicle model is approximately 14m/s², and the acceleration time from 0 to 100 km/h is about 9 seconds. Moreover, when the speed exceeds 2 km/h, the gradeability remains stable above 99%.
The maximum acceleration of approximately 14m/s² is a rather excellent figure, which means that the vehicle can generate a strong sense of pushing back during the starting and acceleration processes, with a very rapid power response. It also stands out in terms of power performance among pure electric vehicles of the same type.
The acceleration time from 0 to 100 km/h of about 9 seconds is at a medium level. The fact that this pure electric vehicle model can achieve a gradeability of over 99% indicates that it can easily cope with even very steep slopes, demonstrating its powerful power output and torque performance.
3. Simulation and Optimization of FTP72 Cycle Performance
3.1. FTP72 Cycle Simulation
In order to have a better understanding of the energy consumption and process of this electric vehicle model, this study carried out the following simulation under the FTP72 cycle which in Figure 5 operating condition cycle:
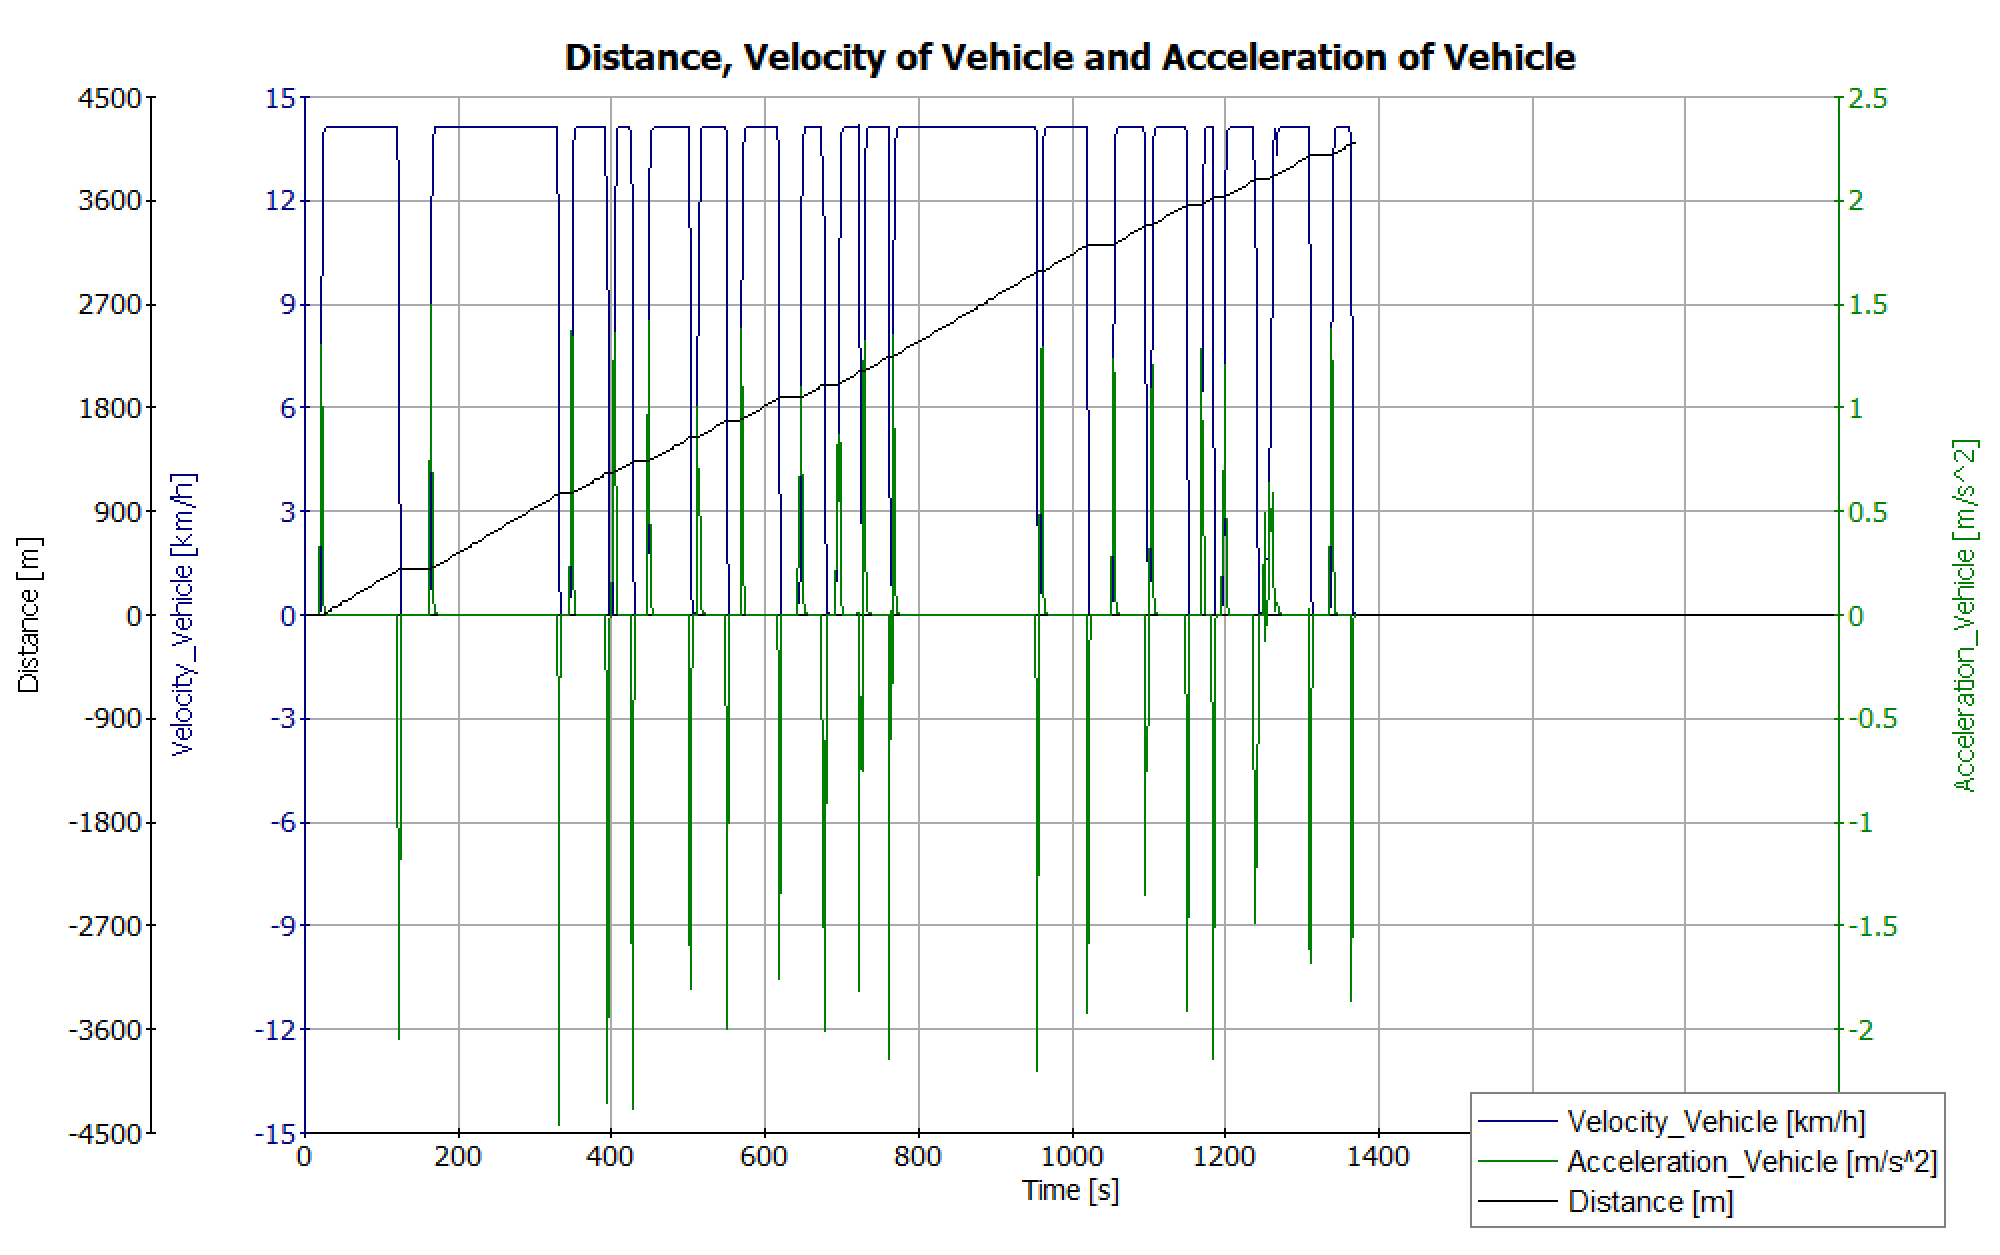
Figure 5: FTP-72-Cycle Simulation of Distance,Velocity andAcceleration
The following is the simulation data of a pure electric vehicle based on AVL-Cruise. Figure 5 shows the distance of the vehicle. The energy consumption is closely related to various factors, and we can only optimize it better after understanding these factors.
3.2. Analysis of Influeluencing Factors of Energy Consumption Cycle Operating Conditions of Pure Electric Vehicles
3.2.1. Mass and Energy Consumption
As can be seen from Figure 8, when the simulation is carried out under appropriate conditions, through the energy relationship obtained by changing the mass of the vehicle, it can be shown that there is an approximate linear correlation between the vehicle mass and the energy consumption. By using Matlab for relevant analysis, the equation between the mass and the energy consumption is obtained as follows:
\( E=0.0039M+3.1732 \)
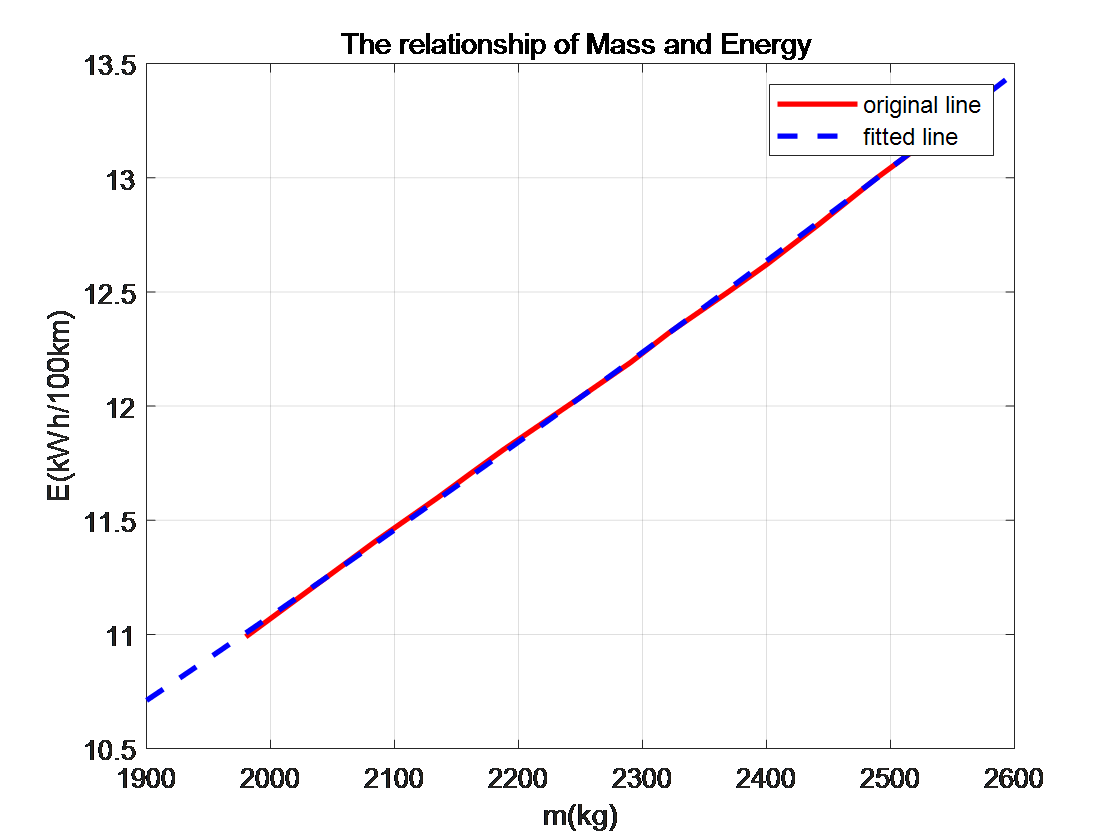
Figure 6: Relationship between Mass and Power
In addition, Figure 6 shows the residual analysis, and all the data are within the confidence interval. Therefore, when the mass is reduced by 100 kg (it should be noted that the expression "reduced by -100 kg" is incorrect in logic, here it is corrected to a normal reduction expression), the energy consumption can be reduced by approximately 400 KJ. Thus, energy consumption can be reduced by reducing mass. Using lightweight materials, optimizing structural design, optimizing the battery system, and selecting lightweight components are all excellent choices.
3.2.2. Drag Coefficient and Energy Consumption
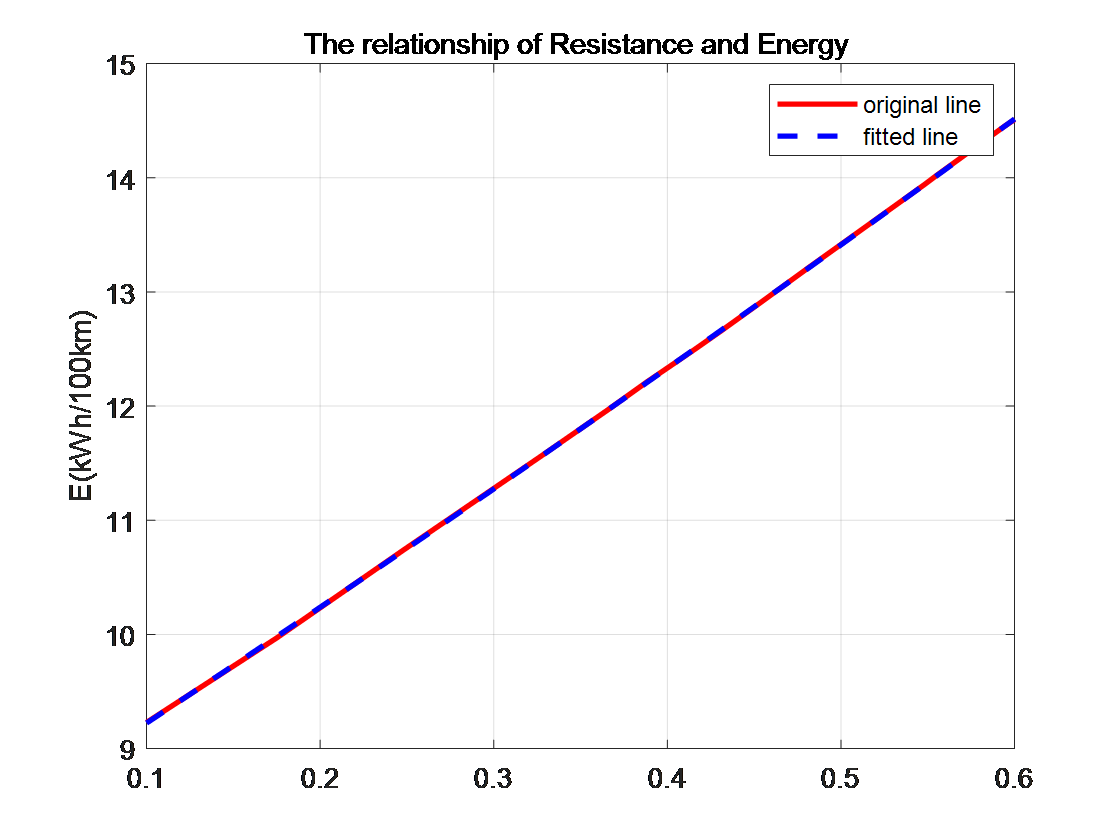
Figure 7: Relationship between Drag Coefficient and Power
Similarly, by adjusting the drag coefficient in Figure7, we can obtain the corresponding energy consumption data in a suitable environment. According to the fitting results, the relationship between the drag coefficient and the power consumption is:
\( E=10.6154C+8.1111 \)
From this, we can know that the effect of reducing energy consumption brought about by reducing the aerodynamic drag of the car is also very significant. For example, optimizing the body shape design to make it smoother, using rearview mirrors and wheels with low aerodynamic drag, rationally designing the chassis to make it flatter, and reducing the protrusions on the car body, etc.
3.2.3. Motor Power and Energy Consumption
Power is a direct factor influencing energy consumption. This study carried out simulation studies from two aspects: series control and parallel control, specifically exploring the influence of the number of batteries in these two aspects on energy consumption.
When the number of parallel-connected batteries is kept constant and only the number of series-connected batteries is changed
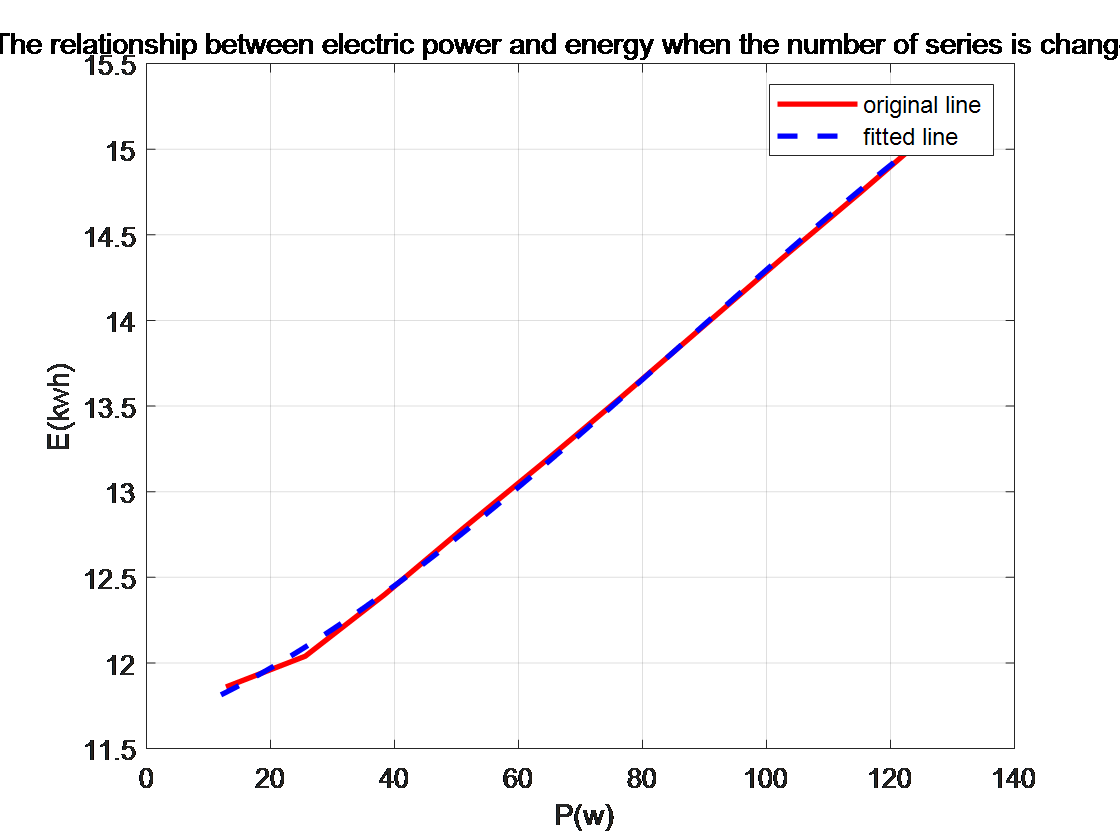
Figure 8: The relationship between electric power and energy when the number of series is change
According to the fitting results from Figure8, the relationship between the number of series-connected batteries and energy consumption is:
\( E=0.0295P+11.3280 \)
It can be seen from this linear relationship formula that the energy consumption is positively correlated with the number of series-connected batteries. Therefore, we can reduce the number of series-connected batteries within an appropriate range to reduce the energy consumption.
When the number of series-connected batteries is kept constant and only the number of parallel-connected batteries is changed.
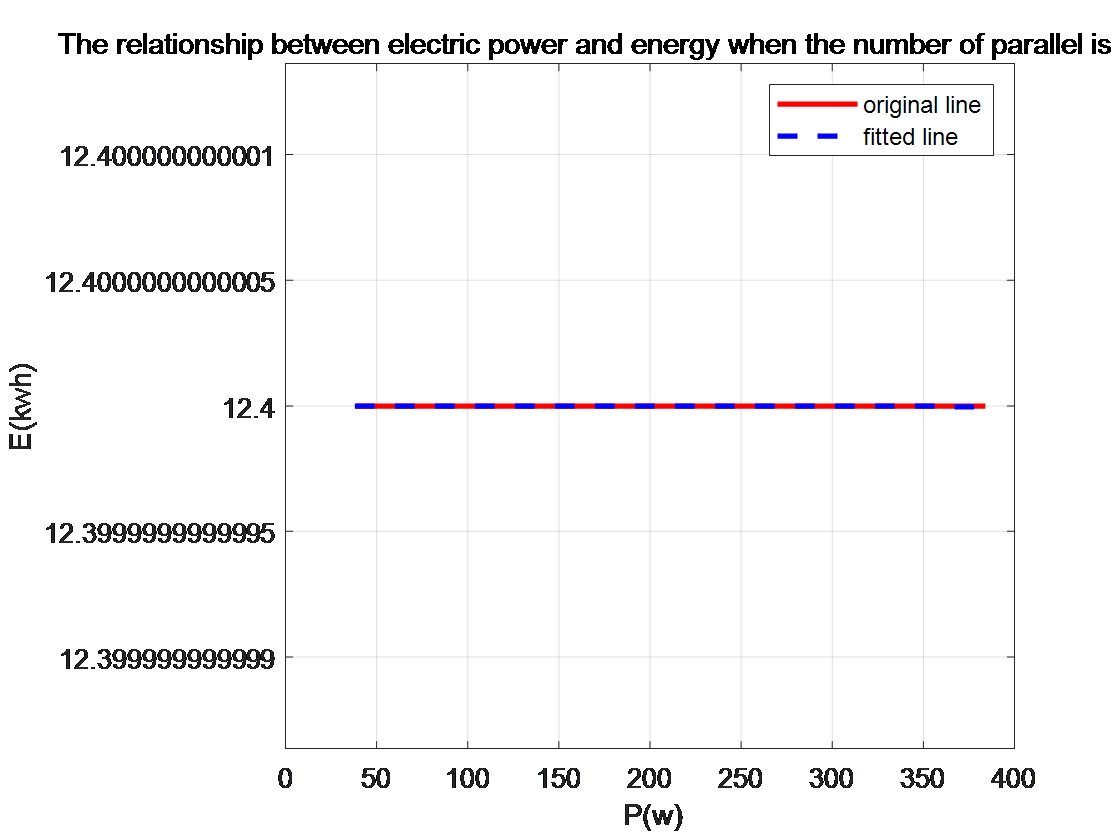
Figure 9: The relationship between electric power and energy when the number of parallel is changed
It can be seen from the fitting diagram of the simulation data from Figure 9 that the amount of energy consumption has nothing to do with the number of parallel-connected batteries. Therefore, we can arrange as few parallel-connected batteries as possible for pure electric vehicles to avoid unnecessary battery consumption and space consumption.
The influences of connecting batteries in series and in parallel on energy consumption are different. When the output power is fixed and only the arrangement forms of the series-connected and parallel-connected batteries are changed, the energy consumption situation is shown in the following table.2
Table 2: The arrangement mode of batteries connected in series and in parallel
The arrangement mode of batteries connected in series and in parallel | energy consumption |
Two batteries are connected in series, and four batteries are connected in parallel | 12.04kwh |
Four batteries are connected in series, and two batteries are connected in parallel | 12.78kwh |
One battery is connected in series, and eight batteries are connected in parallel | 11.86kwh |
Eight batteries are connected in series, and one battery is connected in parallel. | 14.35kwh |
From this data, it can be found that the fewer the series-connected batteries, the lower the energy consumption. This is consistent with the conclusion drawn from our series-parallel fitting. Under the same output power, if the number of series-connected batteries is reduced, the energy consumption will decrease. In the follow-up, the arrangement of batteries can be optimized according to this rule.
3.3. Transmission Ratio and Energy Consumption
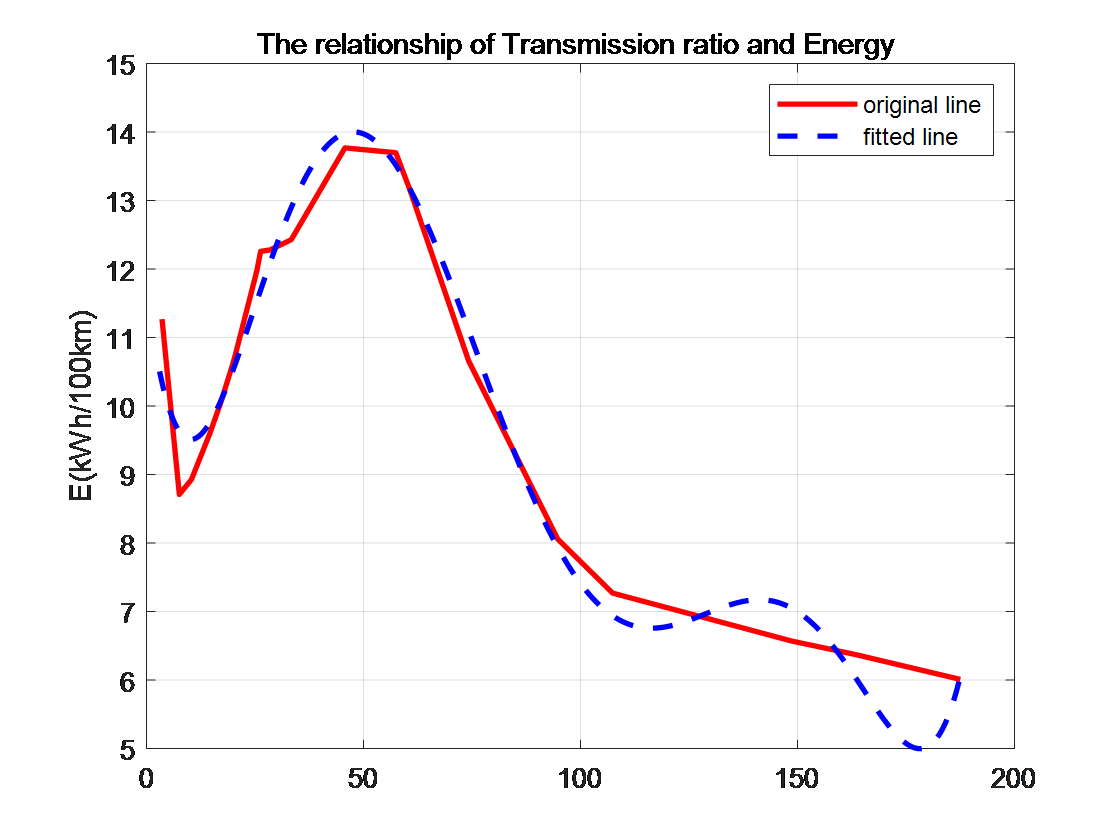
Figure10 The relationship of Transmission ratio and Energy
According to the fitting results from Figure 10, the relationship between the transmission ratio and energy consumption is:
\( E=8.7519+0.6405cos{(0.0292i)}+3.4272sin{(0.0292i)}-1.1731cos{(0.0584i)}+0.3412sin{(0.0584i)} \)
When the transmission ratio is around 60, the energy consumption climbs to its peak. At this point, whether the transmission ratio is increased or decreased, the energy consumption of the vehicle will decrease accordingly. When the transmission ratio is higher than 60, the energy consumption gradually decreases. However, when the transmission ratio is reduced to around 8, the energy consumption will reach a minimum value close to the surrounding data. If the transmission ratio is further decreased, the energy consumption will increase again.
We can optimize the structure in specific scenarios according to this fitting rule to achieve a better effect of reducing energy consumption.
4. Conclusion
In conclusion, this study presents a comprehensive simulation model for pure electric vehicles developed using AVL-Cruise software, complemented by MATLAB-based data analysis and curve fitting. The research successfully established fundamental equations of motion to characterize the dynamic behavior of electric vehicles. Through systematic simulations conducted under controlled conditions, we evaluated critical performance metrics that demonstrate the vehicle's compliance with essential performance standards. The simulation results reveal that the prototype pure electric vehicle model exhibits superior performance characteristics, with a maximum acceleration of 14 m/s² and an impressive 0-100 km/h acceleration time of approximately 9 seconds. Notably, the vehicle maintains exceptional gradeability performance, sustaining stability above 99% when the speed exceeds 2 km/h. These findings not only confirm the vehicle's adherence to basic performance requirements but also highlight its exceptional capabilities in acceleration and climbing performance, underscoring the significant potential of electric vehicle technology. A thorough investigation of energy consumption factors during the FTP72 cycle yielded insightful findings. The study demonstrates that a 100 kg reduction in vehicle mass can lead to approximately 400 KJ decrease in energy consumption, establishing a clear correlation between mass optimization and energy efficiency. Residual analysis further validated the reliability of these findings, with all data points consistently falling within the confidence interval. The research also examined the relationship between aerodynamic efficiency and energy consumption, revealing that reducing the drag coefficient directly correlates with decreased power consumption. Additionally, the study established a significant relationship between motor power configuration and energy efficiency, particularly noting that reducing the number of series-connected batteries while maintaining the same output power results in lower energy consumption. Furthermore, the derived correlation equation between transmission ratio and energy consumption provides valuable insights for structural optimization. This simulation model has generated substantial data and analytical insights that contribute to the ongoing development of electric vehicle technology. The findings offer significant potential for optimizing pure electric vehicle design, expanding their technological boundaries, and enhancing their viability as a sustainable transportation solution. The study's comprehensive approach and robust results provide a solid foundation for future research and development in the field of electric vehicle technology.
References
[1]. Nemes, D., & Hajdu, S. (2023). Vehicle Dynamics Modelling of the Mercedes-Benz REFORM 501 LE Urban Bus by Using AVL Cruise Software. Lecture Notes in Mechanical Engineering, 793–798. https://doi.org/10.1007/978-3-031-15211-5_65
[2]. Kui, H.-L., Wang, Z.-Z., Zhang, J.-Z., & Liu, Y. (2022). Transmission ratio and energy management strategy of fuel cell vehicle based on AVL⁃Cruise. Jilin Daxue Xuebao (Gongxueban)/Journal of Jilin University (Engineering and Technology Edition), 52(9), 2119–2129. https://doi.org/10.13229/j.cnki.jdxbgxb20220016
[3]. Ongun, M. A., Kiran, U., & Sakalli, A. (2020). System Design and Simulation of a Human Electric Hybrid Vehicle in AVL CRUISE. ISSE 2020 - 6th IEEE International Symposium on Systems Engineering, Proceedings. https://doi.org/10.1109/ISSE49799.2020.9272232
[4]. Yu, K., Song, C. Q., Fan, L. Y., & Qin, H. (2013). Simulation and analysis of the hybrid bus performance based on AVL-cruise. Advanced Materials Research, 712–715, 1221–1225. https://doi.org/10.4028/www.scientific.net/AMR.712-715.1221
[5]. Magarotto, E., Ahmed-Ali, T., & Haddad, M. (2024). An Hybrid Observer for a two-branch Supercapacitor Model : voltages estimation for SOH and SOC under NEDC and WLTP cycles. 10th 2024 International Conference on Control, Decision and Information Technologies, CoDIT 2024, 1028–1033. https://doi.org/10.1109/CoDIT62066.2024.10708190
[6]. Paval, P. S., Chandrakanth, B., Mallisetty, P. K., Sharma, T. K., Suresh, B., & Ansari, M. M. (2025). Experimental assessment of a hybrid radiator for pure electric vehicle traction system: a 4E approach (energy, exergy, environment and economy). Journal of Thermal Analysis and Calorimetry. https://doi.org/10.1007/s10973-025-14086-y
[7]. Magarotto, E., Dorléans, P., & Ahmed-Ali, T. (2023). Sampled-Data Observer for Supercapacitor Parameters Estimation with NEDC cycles. 9th 2023 International Conference on Control, Decision and Information Technologies, CoDIT 2023, 245–250. https://doi.org/10.1109/CoDIT58514.2023.10284331
Cite this article
Shan,E. (2025). Based on Pure Electric Vehicle Dynamics Simulation and Economic Cycle Power Consumption Factor Analysis. Applied and Computational Engineering,142,88-98.
Data availability
The datasets used and/or analyzed during the current study will be available from the authors upon reasonable request.
Disclaimer/Publisher's Note
The statements, opinions and data contained in all publications are solely those of the individual author(s) and contributor(s) and not of EWA Publishing and/or the editor(s). EWA Publishing and/or the editor(s) disclaim responsibility for any injury to people or property resulting from any ideas, methods, instructions or products referred to in the content.
About volume
Volume title: Proceedings of MSS 2025 Symposium: Automation and Smart Technologies in Petroleum Engineering
© 2024 by the author(s). Licensee EWA Publishing, Oxford, UK. This article is an open access article distributed under the terms and
conditions of the Creative Commons Attribution (CC BY) license. Authors who
publish this series agree to the following terms:
1. Authors retain copyright and grant the series right of first publication with the work simultaneously licensed under a Creative Commons
Attribution License that allows others to share the work with an acknowledgment of the work's authorship and initial publication in this
series.
2. Authors are able to enter into separate, additional contractual arrangements for the non-exclusive distribution of the series's published
version of the work (e.g., post it to an institutional repository or publish it in a book), with an acknowledgment of its initial
publication in this series.
3. Authors are permitted and encouraged to post their work online (e.g., in institutional repositories or on their website) prior to and
during the submission process, as it can lead to productive exchanges, as well as earlier and greater citation of published work (See
Open access policy for details).
References
[1]. Nemes, D., & Hajdu, S. (2023). Vehicle Dynamics Modelling of the Mercedes-Benz REFORM 501 LE Urban Bus by Using AVL Cruise Software. Lecture Notes in Mechanical Engineering, 793–798. https://doi.org/10.1007/978-3-031-15211-5_65
[2]. Kui, H.-L., Wang, Z.-Z., Zhang, J.-Z., & Liu, Y. (2022). Transmission ratio and energy management strategy of fuel cell vehicle based on AVL⁃Cruise. Jilin Daxue Xuebao (Gongxueban)/Journal of Jilin University (Engineering and Technology Edition), 52(9), 2119–2129. https://doi.org/10.13229/j.cnki.jdxbgxb20220016
[3]. Ongun, M. A., Kiran, U., & Sakalli, A. (2020). System Design and Simulation of a Human Electric Hybrid Vehicle in AVL CRUISE. ISSE 2020 - 6th IEEE International Symposium on Systems Engineering, Proceedings. https://doi.org/10.1109/ISSE49799.2020.9272232
[4]. Yu, K., Song, C. Q., Fan, L. Y., & Qin, H. (2013). Simulation and analysis of the hybrid bus performance based on AVL-cruise. Advanced Materials Research, 712–715, 1221–1225. https://doi.org/10.4028/www.scientific.net/AMR.712-715.1221
[5]. Magarotto, E., Ahmed-Ali, T., & Haddad, M. (2024). An Hybrid Observer for a two-branch Supercapacitor Model : voltages estimation for SOH and SOC under NEDC and WLTP cycles. 10th 2024 International Conference on Control, Decision and Information Technologies, CoDIT 2024, 1028–1033. https://doi.org/10.1109/CoDIT62066.2024.10708190
[6]. Paval, P. S., Chandrakanth, B., Mallisetty, P. K., Sharma, T. K., Suresh, B., & Ansari, M. M. (2025). Experimental assessment of a hybrid radiator for pure electric vehicle traction system: a 4E approach (energy, exergy, environment and economy). Journal of Thermal Analysis and Calorimetry. https://doi.org/10.1007/s10973-025-14086-y
[7]. Magarotto, E., Dorléans, P., & Ahmed-Ali, T. (2023). Sampled-Data Observer for Supercapacitor Parameters Estimation with NEDC cycles. 9th 2023 International Conference on Control, Decision and Information Technologies, CoDIT 2023, 245–250. https://doi.org/10.1109/CoDIT58514.2023.10284331