


1. Introduction
In recent years, the continuous investment in new energy and the expansion of the scale of grid interconnection have led to the inability to achieve better improvement in the accuracy of power system security and stability analysis [1]. With the gradual advancement of the power market construction, the dynamic characteristics of the power system have become more complex, and the risk of transient instability has also increased [2-3]. This indicates that efficient assessment of the power system state is an important guarantee for maintaining the reliable operation of the power system.
With the rapid development of the power industry, traditional power grid analysis methods have exposed certain limitations. Traditional power system stability analysis methods mainly rely on manual operations and empirical judgments, which limit the accuracy and efficiency of power grid stability analysis to some extent [4]. Therefore, by leveraging machine learning algorithms and big data, the characteristics of high-efficiency, speed, and accuracy of artificial intelligence can be effectively utilized to assess the security and stability of the power grid [5-6].
The method presented in this paper analyzes the power grid stability based on the Convolutional Neural Network(CNN). Firstly, we preprocess the power grid operation data to obtain the final input data. Then, we build a model by leveraging the spatial structure of the CNN. Finally, by comparing the algorithmic performance of the CNN with that of the Multi-Layer Perceptron(MLP), we verify the accuracy and efficiency of the CNN in analyzing the power grid stability.
2. Stability Analysis Based on Convolutional Neural Network
2.1. Problem Description of Power Grid Stability Analysis
The 3 types of data are important for analyzing power grid stability:
1.tau[x]: This parameter represents the reaction time of participants and reflects the response speed of relevant devices or control mechanisms when a fault occurs in the system. A rapid response can isolate the fault in a timely manner, reduce the impact on the power grid, and is important for maintaining the stability of the power grid.
2.p[x]: This parameter represents the nominally consumed power(negative value)or the absorbed and generated power(positive value). Power balance is fundamental to the stable operation of the power grid. The fluctuation range of power may lead to instability in the power grid frequency and voltage, thereby affecting the stability of the entire power grid.
3.g[x]: This parameter is a coefficient(γ)proportional to the price elasticity. It reflects the regulatory effect of prices on power supply and demand in the power market and indirectly influences the operating state of the power grid.
We use the three data preprocessing features, tau[x], p[x] and g[x], as the inputs of the model. The stable state of the power grid is used as the output and defined as a binary classification variable, namely "stable" and "unstable". We can analyze the power grid stability effectively by continuously increasing the number of epochs.
2.2. Construction of Convolutional Neural Network
Typical neural networks consist of an input layer, hidden layers, and an output layer. Neurons in each layer are interconnected through weights and biases. The learning process of a neural network involves adjusting these weights and biases aiming to better fit the training data.
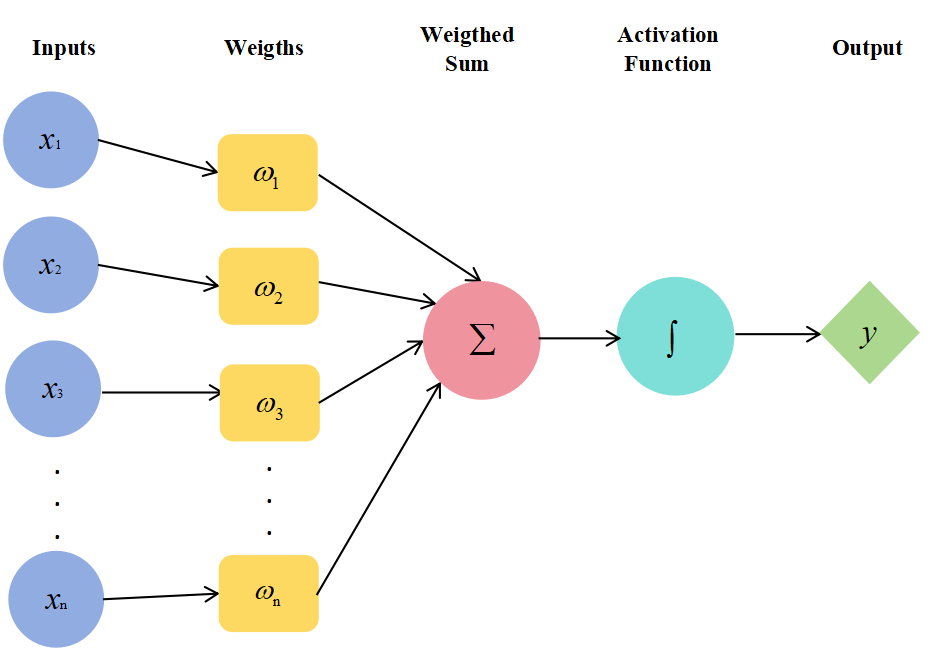
Figure 1: A simple neural network with an activation function
MLP is a type of neural networks, which is composed of an input layer, hidden layers and an output layer. To model the power grid stability problem as a classification problem, we need to determine appropriate inputs and outputs. It is a common fully connected neural network. Fully connected means that neurons in adjacent layers of the network are all interconnected, enabling full information transfer among neurons. However, when dealing with data having a spatial structure, it often encounters issues such as excessive parameters and large computational loads.
Convolutional Neural Networks(CNN) is mainly composed of convolutional layer, pooling layer and fully connected layer [7]. CNN has unique advantages in processing data with spatial structures and is suitable for power grid stability analysis. The convolution operation can be expressed by the following formula:
\( y[i,j]=\sum _{m=0}^{M-1}\sum _{n=0}^{N-1}x[i+m,j+n]\cdot ω[m,n]+b \) (1)
Where, \( x[i+m,j+n] \) represents the input data, \( ω[m,n] \) represents the weights of the convolution kernel, \( y[i,j] \) represents the output result, b represents the bias。
The convolutional layer is a core component of CNN. The convolutional kernels perform convolutional operations on the input data through sliding windows [8-9]. Each convolutional kernel can be regarded as a feature extractor, which is capable of capturing specific types of local features. As the number of network layers increases, the high-level convolutional layers combine the simple features from the low-level layers into more complex and abstract features.
The pooling layer serves the purpose of data downsampling. Its function is to decrease the data dimension and computational load. During this process, it retains crucial features. It improves the computational efficiency and generalization ability of the model and prevents overfitting. Commonly, the max-pooling method is chosen [10]. In this study, we also adopted the max-pooling method to tackle the aforementioned issues. Once the convolutional layer has extracted the features of the data, the data is transferred to the pooling layer for downsampling. Then, the data is flattened and fed into the fully - connected layer. The max-pooling method can be represented by the following formula:
\( y[i,j]=max{\lbrace x[i:i+s,j:j+s]\rbrace } \) (2)
Where, \( y[i,j] \) represents the output of pooling operation, \( x[i:i+s,j:j+s] \) represents a local region of \( s×s \) size in the input data。
The fully connected layer can synthesize the features extracted from the previous layers and outputting the classification results. In the analysis of power grid stability, it integrates the features extracted by the convolutional layer and the pooling layer. It maps the input into a new feature space and outputs the probability that the power grid is in a stable or unstable state by calculating the weight matrix and bias terms [11]. Its output can be expressed by the following formula:
\( Z={W_{fc}}\cdot {Y_{pool}}+{b_{fc}} \) (3)
Where, Z represents the output of the fully connected layer, \( {W_{fc}} \) represents the weights of the fully connected layer, \( {b_{fc}} \) represents the bias of the fully connected layer, \( {Y_{pool}} \) represents the output of pooling layer.
When training the CNN model, We need to configure the structural parameters of the network rationally. These parameters include the size and number of convolutional kernels, the type of pooling layer, the number of network layers and the number of neurons in the fully connected layer, etc. Meanwhile, an appropriate loss function and optimization algorithm should be selected. The purpose is to minimize the prediction error of the model, enhance the generalization ability of the model and improve the prediction accuracy of the model [10].
The model proposed in this paper utilizes 2 one-dimensional convolutional layers to extract features from the input data. There is a ReLU activation function following each convolutional layer. After each convolutional layer, we employ the max-pooling method for downsampling. Subsequently, a flattening layer is used to convert the data into a one-dimensional vector, which is then passed as input to the fully connected layer. A Sigmoid activation function is applied to process the data and obtain the final output result.
RELU activation function is a kind of piecewise linear function. It makes the negative part of inputs value to 0 and maintain the positive part of inputs. It can be used in the hidden layers of neural networks. RELU activation function can be expressed by the following formula:
\( f(x)=\begin{cases} \begin{array}{c} x,x \gt 0 \\ 0,x≤0 \end{array} \end{cases} \) (4)
Sigmoid activation function is widely used in the output layers of binary classification tasks. It can compress the input data into the range of (0,1). Sigmoid activation function can be expressed by the following formula:
\( S(x)=\frac{1}{1+{e^{-x}}} \) (5)
Where, x represents a scalar, a vector or a metrix.
3. Case Analysis
3.1. Introduction to Dataset
The dataset we used contains 10000 samples. Each sample includes three input parameters, namely tau[x], p[x] and g[x], as well as output labels of "stable" and "unstable":
1.tau[x]: It is a real number with a range of (0.5,10)s. tau[1] represents the reaction time of power producers.
2.p[x]: For a power system with a four-star motif, it can be expressed by using the power balance formula as follows:
\( p[1]=-(p[2]+p[3]+p[4]) \) (6)
Where, p[1] is the injection power at node 1(usually positive, representing the output power of a generator), and p[2], p[3] and p[4] are the injection powers at nodes 2, 3, 4 respectively(usually negative, representing the power consumption of loads).
3.g[x]: g[1] is the value of power producers, and its actual value is taken from the range of [0.05,1] s-1.
3.2. Data Preprocessing
Aiming to ensure the dataset accurate and useful, we need to preprocess the dataset, including initially data cleaning by removing duplicate data, handling missing values and outlierse. And then, data conversion is carried out. Finally, we prevent the excessive difference in the valued range of input parameters by normalization method. We compress the raw data into the range of (0,1) by taking min-max normalization method [12]. It can be expressed by the following formula:
\( x \prime =\frac{x-{x_{min}}}{{xmin_{max}}} \) (7)
Where, x represents the raw data, \( {x_{min}} \) represents the minimum value of the raw data, \( {x_{max}} \) represents the maximum value of the raw data, \( x \prime \) represents the value after data preprocessing.
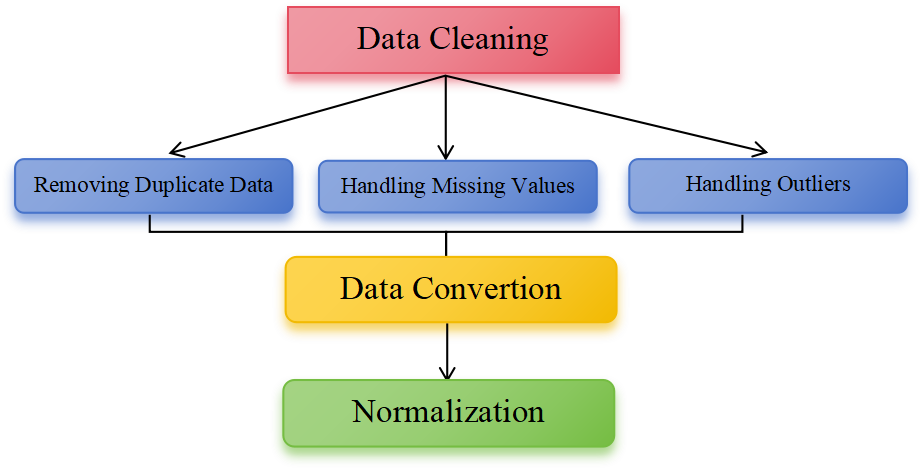
Figure 2: Data preprocessing procedure
3.3. Comparison of Algorithm Effects
In order to evaluate the effect of the power grid stability by using CNN comprehensively, we set up a fully connected control group, which uses MLP as the model. In the experiment, the same preprocessed tau[x], p[x] and g[x] data were put into the CNN model and MLP model respectively. We can priortize the effect of the models by adjusting the number of network layers, the number of neurons and learning rate (In this paper, we make the learning rate equal to 0.01). The confusion matrix was employed to illustrate the relationship between the actual class and the predicted class. Moreover, based on the confusion matrix, metrics such as accuracy, error rate, precision, recall, and F1-Score were compared to analyze the advantages and disadvantages of the two models in handling power grid stability classification problems [13].
The confusion matrix is a tool used to evaluate the performance of classification models. The details of it are expressed by the following figure:
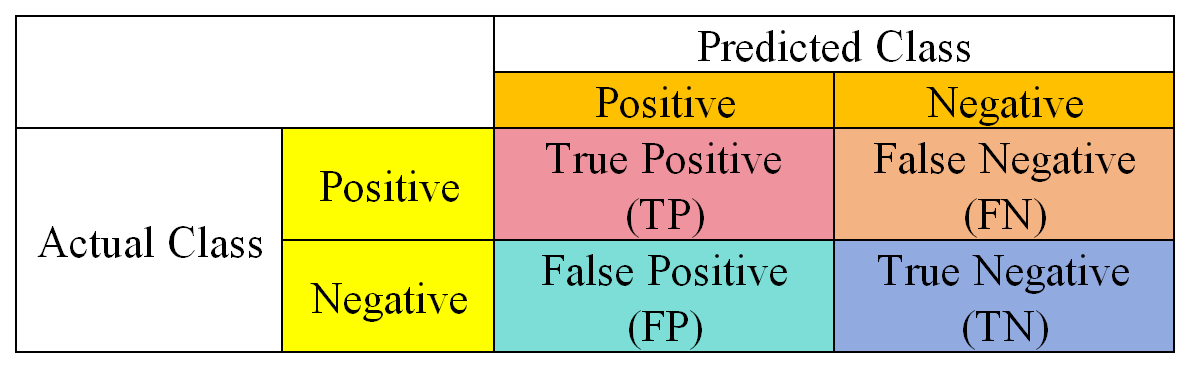
Figure 3: Confusion Matrix Diagram
In Figure 3, it is shown that TP represents the true class is positive, and it is correctly predicted as positive; TN represents the true class is negative, and it is correctly predicted as negative; FP represents the true class is negative, but it is wrongly predicted as positive; FN represents the true class is positive, but it is wrongly predicted as negative.
Meanwhile, we need to know the detailed meaining of accuracy, error rate, precision, recall and F1-Score.
Accuracy refers to the proportion of correctly predicted samples to the total number of samples [14], it can be expressed by the following formula:
\( Accuracy=\frac{TP+TN}{TP+TN+FP+FN} \) (8)
Error rate refers to the proportion of wrongly predicted samples to the total number of samples, it can be expressed by the following formula:
\( Error rate=\frac{FP+FN}{TP+TN+FP+FN} \) (9)
Precision refers to the proportion of actually positive samples among those predicted as positive, it can be expressed by the following formula:
\( Precision=\frac{TP}{TP+FP} \) (10)
Recall refers to the proportion of successfully predicted as positive among those actully positive samples [15], it can be expressed by the following formula:
\( Recall=\frac{TP}{TP+FN} \) (11)
F1-Score refers to the harmonic mean of Precision and Recall. It is used to evaluate the overall accuracy and completeness of the model, it can be expressed by the following formula:
\( F1-Score=2×\frac{Precision×Recall}{Precision+Recall} \) (12)
In this experiment, we set the number of training epochs for both the MLP and CNN to 2000, the stride to 1 and the batch to 32. The index we need to notice including accuracy, error rate, precision, recall and F1-Score. The results of MLP and CNN are presented in the following table:
Table 1: Example Analysis Comparison Table
Type | MLP | CNN |
Accuracy | 0.861 | 0.966 |
Error rate | 0.139 | 0.034 |
Precision | 0.831 | 0.956 |
Recall | 0.773 | 0.95 |
F1-Score | 0.801 | 0.953 |
From Tab.1, it is shown that CNN performs higher accuracy, precision, recall and F1-Score than MLP, and makes less mistake than MLP, which both mean CNN can identify more exactly in uncertain issue. The result can prove that using CNN to analyze power grid stability is a better choice.
4. Conclusion
In this paper, we propose a power grid stability analysis method based on CNN. Firstly, the power grid operation data needs to be preprocessed to extract key features. After being preprocessed, the dataset is fed into both MLP and CNN. Specifically, in CNN, local features are extracted by the convolutional layers, downsampling operation is carried out by the pooling layers and classification is performed by the fully connected layers to convert into output. Finally, in the test cases, we compare the performance between MLP and CNN, which has shown that CNN performs better on the issue we mentioned. The method we proposed can improve the accuracy in the power grid stability to a great extent, which will provide an effective and stable means.
References
[1]. Liang Xiurui, Liu Daowei, Yang Hongying, et al. (2020) Data - Driven Static Voltage Stability Situation Assessment of Power Systems [J]. Electric Power Construction, 41(1), 126 - 132.
[2]. Zhang C, Li Y, Yu Z, et al. (2016) A Weighted Random Forest Approach to Improve Predictive Performance for Power System Transient Stability Assessment [C]//2016 IEEE PES Asia - Pacific Power and Energy Conference. Xi'an: IEEE, 1259 - 1263.
[3]. Tan Bendong, Yang Jun, Lai Qiupin, et al. (2019) A Sample Enhancement Method for Power System Transient Stability Assessment Based on Improved CGAN [J]. Automation of Electric Power Systems, 43(1), 9 - 15.
[4]. Lu Rendao. (2024) Research on the Application of Automation and Control Systems in Power Grid Stability Analysis [J]. China Computer & Communication, (13), 16 - 18.
[5]. Shi Ruoyuan. (2021) Research on Power Grid Stability Analysis Method Based on Machine Learning [D]. Yichang: China Three Gorges University.
[6]. Cheng, M., Zhai, J.X., Ma, J., et al. (2024) A Short-Term Power Load Forecasting Method Based on Transfer Learning of CNN-GRU. Journal of Wuhan University (Engineering Science Edition), 57(6), 812 - 820.
[7]. Sun, Y., Wang, Z.Y., Zheng, F.Z., et al. (2024) Data Security Evaluation Model of Digital Intelligent Power Station Based on Convolutional Neural Network. Techniques of Automation & Applications, 43(12), 16 - 24. DOI:10.20033/j.1003-7241.(2024)12-0016-05
[8]. Jing, H.T., Han, L., Gao, Z.Y. (2021) Wind Power Ramp Forecast Based on Feature Extraction Using Convolutional Neural Network. Automation of Electric Power Systems, 45(4), 98-105
[9]. Li, P.L., Cheng, B., Yang, J., et al. (2023) A Method for Power Grid Fault Identification Based on Convolutional Neural Network. Electronic Test, 507, 58-61.
[10]. Zhang Zhe, Qin Boyu, Gao Xin, et al. (2023) Emergency Control Strategy for Power Grid Voltage Stability Based on CNN - LSTM Network [J]. Automation of Electric Power Systems, 47(11), 60 - 67.
[11]. Zhao, Y.T., Li, Z., Liu, X.L., et al. (2025) Load recognition method based on convolutional neural network and attention mechanism. ElectricPowerEngineeringTechnology, 44(1), 227-235.
[12]. Fang, L.Z., Cao, X.Y. (2025) Research on Intelligent Data Cleaning and Preprocessing Algorithms in University Information Systems. Computer Programming Skills & Maintenance, 2025(1), 115-117.
[13]. R. Sahoo, S. Panigrahy and S. Karmakar, "Classification of Electrical Tree Growth Stages in XLPE Cable Insulation Using CNN and Pre-Trained CNNs," 2024 IEEE 7th International Conference on Condition Assessment Techniques in Electrical Systems (CATCON), Kolkata, India, 2024, pp. 67-71, doi: 10.1109/CATCON60527.2024.10831858.
[14]. Chen, M.L., Lu, Z.X., Xie, G.Q., et al. (2024) Collaborative Detection for Security Threats to Distributed Generator Regulation Based on Semi-supervised Federated Learning. Automation of Electric Power Systems, 48(22), 199-209.
[15]. Tao, Y., Zhang, H., Huang, Z.H., et al. (2025) Accurate identification of thermal faults for typical components of distribution network. CAAI Transactions on Intelligent Systems.
Cite this article
Pu,X. (2025). A Power Grid Stability Analysis Method Based on CNN. Applied and Computational Engineering,149,20-26.
Data availability
The datasets used and/or analyzed during the current study will be available from the authors upon reasonable request.
Disclaimer/Publisher's Note
The statements, opinions and data contained in all publications are solely those of the individual author(s) and contributor(s) and not of EWA Publishing and/or the editor(s). EWA Publishing and/or the editor(s) disclaim responsibility for any injury to people or property resulting from any ideas, methods, instructions or products referred to in the content.
About volume
Volume title: Proceedings of CONF-MSS 2025 Symposium: Automation and Smart Technologies in Petroleum Engineering
© 2024 by the author(s). Licensee EWA Publishing, Oxford, UK. This article is an open access article distributed under the terms and
conditions of the Creative Commons Attribution (CC BY) license. Authors who
publish this series agree to the following terms:
1. Authors retain copyright and grant the series right of first publication with the work simultaneously licensed under a Creative Commons
Attribution License that allows others to share the work with an acknowledgment of the work's authorship and initial publication in this
series.
2. Authors are able to enter into separate, additional contractual arrangements for the non-exclusive distribution of the series's published
version of the work (e.g., post it to an institutional repository or publish it in a book), with an acknowledgment of its initial
publication in this series.
3. Authors are permitted and encouraged to post their work online (e.g., in institutional repositories or on their website) prior to and
during the submission process, as it can lead to productive exchanges, as well as earlier and greater citation of published work (See
Open access policy for details).
References
[1]. Liang Xiurui, Liu Daowei, Yang Hongying, et al. (2020) Data - Driven Static Voltage Stability Situation Assessment of Power Systems [J]. Electric Power Construction, 41(1), 126 - 132.
[2]. Zhang C, Li Y, Yu Z, et al. (2016) A Weighted Random Forest Approach to Improve Predictive Performance for Power System Transient Stability Assessment [C]//2016 IEEE PES Asia - Pacific Power and Energy Conference. Xi'an: IEEE, 1259 - 1263.
[3]. Tan Bendong, Yang Jun, Lai Qiupin, et al. (2019) A Sample Enhancement Method for Power System Transient Stability Assessment Based on Improved CGAN [J]. Automation of Electric Power Systems, 43(1), 9 - 15.
[4]. Lu Rendao. (2024) Research on the Application of Automation and Control Systems in Power Grid Stability Analysis [J]. China Computer & Communication, (13), 16 - 18.
[5]. Shi Ruoyuan. (2021) Research on Power Grid Stability Analysis Method Based on Machine Learning [D]. Yichang: China Three Gorges University.
[6]. Cheng, M., Zhai, J.X., Ma, J., et al. (2024) A Short-Term Power Load Forecasting Method Based on Transfer Learning of CNN-GRU. Journal of Wuhan University (Engineering Science Edition), 57(6), 812 - 820.
[7]. Sun, Y., Wang, Z.Y., Zheng, F.Z., et al. (2024) Data Security Evaluation Model of Digital Intelligent Power Station Based on Convolutional Neural Network. Techniques of Automation & Applications, 43(12), 16 - 24. DOI:10.20033/j.1003-7241.(2024)12-0016-05
[8]. Jing, H.T., Han, L., Gao, Z.Y. (2021) Wind Power Ramp Forecast Based on Feature Extraction Using Convolutional Neural Network. Automation of Electric Power Systems, 45(4), 98-105
[9]. Li, P.L., Cheng, B., Yang, J., et al. (2023) A Method for Power Grid Fault Identification Based on Convolutional Neural Network. Electronic Test, 507, 58-61.
[10]. Zhang Zhe, Qin Boyu, Gao Xin, et al. (2023) Emergency Control Strategy for Power Grid Voltage Stability Based on CNN - LSTM Network [J]. Automation of Electric Power Systems, 47(11), 60 - 67.
[11]. Zhao, Y.T., Li, Z., Liu, X.L., et al. (2025) Load recognition method based on convolutional neural network and attention mechanism. ElectricPowerEngineeringTechnology, 44(1), 227-235.
[12]. Fang, L.Z., Cao, X.Y. (2025) Research on Intelligent Data Cleaning and Preprocessing Algorithms in University Information Systems. Computer Programming Skills & Maintenance, 2025(1), 115-117.
[13]. R. Sahoo, S. Panigrahy and S. Karmakar, "Classification of Electrical Tree Growth Stages in XLPE Cable Insulation Using CNN and Pre-Trained CNNs," 2024 IEEE 7th International Conference on Condition Assessment Techniques in Electrical Systems (CATCON), Kolkata, India, 2024, pp. 67-71, doi: 10.1109/CATCON60527.2024.10831858.
[14]. Chen, M.L., Lu, Z.X., Xie, G.Q., et al. (2024) Collaborative Detection for Security Threats to Distributed Generator Regulation Based on Semi-supervised Federated Learning. Automation of Electric Power Systems, 48(22), 199-209.
[15]. Tao, Y., Zhang, H., Huang, Z.H., et al. (2025) Accurate identification of thermal faults for typical components of distribution network. CAAI Transactions on Intelligent Systems.