


1. Introduction
In recent years, current CFD simulation research on Venturi flowmeters has witnessed significant progress, with numerous scholars making in - depth explorations from different perspectives.
Zhang Yongsheng et al. initiated the use of FLUENT to simulate the transient flow field of Venturi flowmeters and constructed a corresponding mathematical model [1]. Building on this foundation, Liu et al. turned their attention to small - diameter cryogenic Venturi flowmeters. They studied the performance of such flowmeters and explored effective optimization methods [2]. In the context of nuclear power plants, Zhao Erlei et al. addressed the practical problem of measurement fluctuations of Venturi flowmeters in low - flow scenarios and put forward an optimized design [3]. When it comes to the study of multiphase flow, Deng Rong et al. analyzed the water - air two - phase flow in double Venturi tubes using the Eulerian multiphase flow model, enriching the research on the multiphase flow characteristics of Venturi flowmeters [4]. In addition, Yang Jie et al. concentrated on the long - term operation issues of Venturi flowmeters in nuclear power plants. They specifically studied the wear of the main feed water Venturi flowmeters in nuclear power plants [5]. Beyond the traditional research on flowmeters themselves, Zhang Xinwei et al. combined Venturi flowmeters with practical engineering applications. They designed water - fertilizer integration equipment and used CFD to analyze the mixing uniformity in the equipment, expanding the application scope of Venturi flowmeters [6]. Pan, J. et al. analyzed solid-liquid two-phase flow erosion in hydraulic machinery using CFD, focusing on Venturi tubes under varying velocities and sediment conditions, providing erosion prediction insights [7].
Currently, research on the Venturi effect mainly focuses on the measurement of two-phase flow and the Practical Application of Venturi Flowmeters. This paper extends existing research by focusing on single-phase fluid flow in pipeline systems, specifically exploring how pipeline section length, Venturi tube throat diameter, and structural deviations impact flowmeter accuracy. The study emphasizes how roughness and welding flaws affect measurement, contributing to the understanding of Venturi flowmeter behavior.
2. Numerical simulation of venturi tube flow
2.1. Pre-processing on geometric modeling
The Venturi flowmeter is a common differential pressure flowmeter with a variable diameter tube structure, including a throat and two tapered tubes. The structure size is shown in Figure 1 (a).
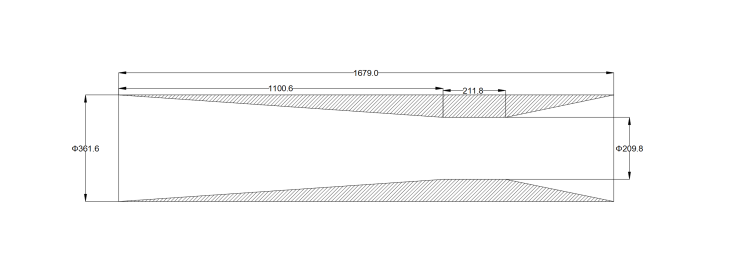
Size diagram of venturi tube (b) Numerical simulation size diagram
Figure 1: Venturi tube schematic diagram
The inlet pressure measuring point is P1, and the outlet is P2, with the pressure difference ∆P. So, measuring ∆P between P1 and P2 can determine the flow rate.
Due to the influence of resistance loss,C is introduced to represent the ratio between the actual flow and the theoretical flow. Basing on the Venturi tube in this study, it can be obtained:
\( {q_{m}}=0.03745C\sqrt[]{2ΔPρ} \) (1)
The pressure difference coefficient can be obtained by selecting the fluid density ρ and the average flow velocity v1 as the basic quantities:
\( {C_{ΔP}}=ΔP/\frac{1}{2}ρv_{1}^{2} \) (2)
When fluid passes through the throat of a Venturi flowmeter, the cross - section shrinks, causing the Venturi effect: increased flow rate and pressure drop. To ensure accurate measurement, the flowmeter design considers sufficient fluid flow distance and wall roughness. An established 3D model, five times the size of the Venturi tube like Figure 1 (b), helps simulate roughness better.
Once the model is set up, the geometric domain is discretized through meshing. For the simple structured Venturi tube, CFD software generates structured tetrahedral meshes. Due to the large and complex flow field in the throat area, boundary-layer meshing is applied to the throat and near-wall surfaces to improve experimental accuracy and reliability. Figure 2 (a) shows the quality of generated tetrahedral and hexahedral meshes, indicating good - quality grids.
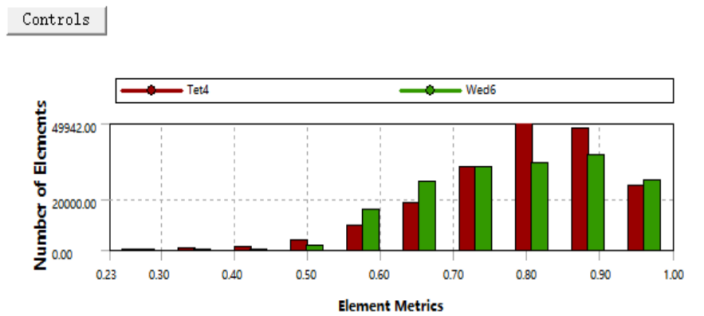
Grid quality diagram (b) Grid independence verification
Figure 2: Grid quality diagram
Before numerical simulation, grid size and quantity independence must be verified to ensure experimental accuracy. This study conducted grid independence analysis based on the Venturi flowmeter's throat center velocity. Figure 2 (b) shows throat center velocity changes across grid numbers, revealing stability after a certain threshold, with errors below 0.13%. Approximately 420,000 grids were selected, with refinement in central and near-wall regions to enhance simulation reliability.
2.2. Venturi tube flow field simulation
Numerical simulations of the Venturi tube flow field under various loads were conducted, calculating the outflow and pressure difference coefficients. Figure 3 analysis indicates that as flow rate increases, the outflow coefficient exhibits a nonlinear growth pattern. The growth rate of the outflow coefficient and the reduction rate of the pressure difference coefficient decelerate and stabilize over time, especially at low flow rates.
The change of outflow coefficient (b) The change of pressure difference coefficient
Figure 3: C and CΔP under different working conditions
2.3. Effect of wall roughness
The roughness has a significant effect on the flow field which will increase the flow resistance loss, resulting in an increase in the pressure difference, causing the reading to appear falsely high.
Table 1: Roughness value diagram
Material | Condition | K | Rα |
Steel | New stainless steel tube | ≤0.03 | <0.01 |
New Seamless Steel Pipe | ≤0.1 | ≤0.03 | |
slight corrosion | 0.10,0.20 | 0.03,0.06 | |
corrosion | 0.20,0.30 | 0.06,0.10 |
The roughness height parameter of the inner surface of the pipe can be Ra or K. In
Table 1: Roughness value diagram, Ra represents the arithmetic mean deviation from the measured (roughness) profile, which can be measured by the electronic average surface roughness instrument. K represents the equivalent uniform roughness in unit length mm. When selecting different Roughness Height parameters, the Roughness Constant is usually set to 0.5 by default.
Figure 4 shows that the pressure difference coefficient and discharge coefficient of the flowmeter change under different roughness and load conditions. The increase of roughness leads to the decrease of pressure an the increase of flow velocity. In particular, the roughness varies significantly in the range of 0 to 0.1 mm.
Figure 5 shows that the roughness of the inner wall of the pipeline increases, the pressure difference measured by the flowmeter increases, and the outflow coefficient decreases. The pressure difference coefficient is the opposite. The roughness has a significant effect on the outflow coefficient in the range of 0 to 0.05 mm. The increase of roughness leads to the increase of flow resistance and pressure difference, and the measurement reading may be inflated. However, the error is only 1.993 %, and the error decreases with the increase of Reynolds number, and the deviation is acceptable.
(a) Roughness height 0mm (b) Roughness height 0.1mm (c) Roughness height 0.3mm
Figure 4: Effect of roughness on velocity distribution
Variation curve of outflow coefficient (b) Pressure difference coefficient curve
Figure 5: The influence curve of roughness on C and CΔP
2.4. Influence of pipeline connection on measurement accuracy
Installation of flowmeters and pipe welding may cause deviations that affect measurement. The results show that the different structural parameters of the ratio of the height of the annular baffle to the radius of the pipeline will affect the flow characteristics, pressure difference characteristics and system performance of the Venturi tube, and the mechanism of the structural parameters on the flow characteristics is deeply understood.
Lower than the pipe diameter (b) Higher than the pipe diameter
Figure 6: Structure diagram of flowmeter and pipeline parameter variation
Figure 6 shows the structure of the flowmeter when the pipe diameter is greater than or less than the pipe diameter, and the numerical simulation is carried out.
The unsmooth welding at the pipeline-flowmeter junction increases local flow resistance, disrupting flow field uniformity, leading to higher pressure differences and elevated flowmeter readings. Figure 7 and Figure 8 indicate that a flowmeter diameter smaller than the straight pipe's raises local resistance, particularly at the contraction section's annular baffle. As pipe diameter grows, the flowmeter's throat velocity rises significantly, greatly affecting measurement accuracy.
(a) Lower than the pipe diameter (b) Higher than the pipe diameter
Figure 7: Pressure contour
(c) Lower than the pipe diameter (d) Higher than the pipe diameter
Figure 8: Velocity contour
The data in Figure 9 show that the pressure difference before and after the flowmeter does not change much in the small diameter pipeline. However, in large-diameter pipelines, the pressure difference increases exponentially, mainly due to the increasing influence of local resistance on the flow field. As the height of the pipeline deviation increases, the reading deviation also increases, highlighting the importance of the matching of the pipeline diameter and the flowmeter to measurement accuracy.
(a) Pressure difference diagram (b) C,ΔP diagram
Figure 9: Numerical simulation of flow meter and pipeline structure change
3. Conclusion
Analysis suggests multiple factors lower the outflow coefficient, yet experimental data do not consistently show high readings. Possible reasons include model deviations, insufficient data analysis, and single-factor limitations. The apparent high flowmeter reading may stem from flow rate and wall roughness, but discrepancies between the model and actual results limit the observed degree of false elevation.
To reduce the impact of wall friction and imprecise welding on the readings of a Venturi flow meter, the design should optimize the inner wall material and geometric structure. Selecting smooth materials or applying polishing and coatings to reduce the inner wall roughness and friction, thereby enhancing measurement accuracy. Additionally, optimizing the shape and angle of the converging and diverging sections of the Venturi tube to promote smooth fluid flow, reducing eddies and energy loss. Furthermore, assess the impact of the welding process on measurement accuracy and design specific welding structures and interfaces to ensure precise welding, reducing fluid disturbance and measurement errors. To ensure flowmeter accuracy and reliability, future research should consider more influencing factors and explore comprehensive analysis methods, Like establishing a mathematical compensation model to reduce the interference of different influencing factors on the measurement results, in order to improve the measurement accuracy.
References
[1]. Zhang, Yongsheng, Zhang, Yizhi and Wang, Peng. (2019) Utilizing fluid simulation to study the transient flow model of Venturi flowmeters. Metrology and Measurement Technology, 01, 10 - 13.
[2]. Liu, Gengtian, Li, Junjie, Ouyang, Zhengrong, Shi, Lei, Kuang... and Chen, Xuheng. (2021) Numerical analysis of the flow performance of small - diameter cryogenic Venturi flowmeters. Cryogenics, 02, 41 - 46.
[3]. Zhao, Erlei, Li, Linkun, Wang, Guangjin, Chen, Deqi and Xu, Jianjun. (2022) Design optimization of Venturi flowmeters based on CFD analysis. Atomic Energy Science and Technology, 06, 1196 - 1203.
[4]. Deng, Rong, Hu, Kun, Liang, Dong and Hu, Tingting. (2021) Simulation and analysis of double Venturi tubes based on CFD. Science - Technology and Industry, 06, 183 - 188.
[5]. Yang, Jie and Deng, Debing. (2023) Numerical study on the influence of wear and damage of the main feedwater Venturi flowmeter in nuclear power plants. China Nuclear Power, 01, 102 - 106.
[6]. Zhang, Xinwei, Yang, Huimin, Chen, Yifei, Ma, Yan and Wang, Xuenong. (2021) Design and experiment of water - fertilizer integration equipment. Journal of Agricultural Mechanization Research, 09, 98 - 104.
[7]. Pan, J., Guang, W., Liu, Q., Lu, J., Tao, R., Zhu, D., and Xiao, R. (2024). Numerical simulation of sand erosion in Venturi tube under different flow characteristics and sand content. Journal of Physics: Conference Series, 2752(1), 012206.
Cite this article
Yan,H. (2025). Research on Flow Field Characteristics of Pipeline Flow Control Device Based on CFD. Applied and Computational Engineering,149,135-140.
Data availability
The datasets used and/or analyzed during the current study will be available from the authors upon reasonable request.
Disclaimer/Publisher's Note
The statements, opinions and data contained in all publications are solely those of the individual author(s) and contributor(s) and not of EWA Publishing and/or the editor(s). EWA Publishing and/or the editor(s) disclaim responsibility for any injury to people or property resulting from any ideas, methods, instructions or products referred to in the content.
About volume
Volume title: Proceedings of CONF-MSS 2025 Symposium: Automation and Smart Technologies in Petroleum Engineering
© 2024 by the author(s). Licensee EWA Publishing, Oxford, UK. This article is an open access article distributed under the terms and
conditions of the Creative Commons Attribution (CC BY) license. Authors who
publish this series agree to the following terms:
1. Authors retain copyright and grant the series right of first publication with the work simultaneously licensed under a Creative Commons
Attribution License that allows others to share the work with an acknowledgment of the work's authorship and initial publication in this
series.
2. Authors are able to enter into separate, additional contractual arrangements for the non-exclusive distribution of the series's published
version of the work (e.g., post it to an institutional repository or publish it in a book), with an acknowledgment of its initial
publication in this series.
3. Authors are permitted and encouraged to post their work online (e.g., in institutional repositories or on their website) prior to and
during the submission process, as it can lead to productive exchanges, as well as earlier and greater citation of published work (See
Open access policy for details).
References
[1]. Zhang, Yongsheng, Zhang, Yizhi and Wang, Peng. (2019) Utilizing fluid simulation to study the transient flow model of Venturi flowmeters. Metrology and Measurement Technology, 01, 10 - 13.
[2]. Liu, Gengtian, Li, Junjie, Ouyang, Zhengrong, Shi, Lei, Kuang... and Chen, Xuheng. (2021) Numerical analysis of the flow performance of small - diameter cryogenic Venturi flowmeters. Cryogenics, 02, 41 - 46.
[3]. Zhao, Erlei, Li, Linkun, Wang, Guangjin, Chen, Deqi and Xu, Jianjun. (2022) Design optimization of Venturi flowmeters based on CFD analysis. Atomic Energy Science and Technology, 06, 1196 - 1203.
[4]. Deng, Rong, Hu, Kun, Liang, Dong and Hu, Tingting. (2021) Simulation and analysis of double Venturi tubes based on CFD. Science - Technology and Industry, 06, 183 - 188.
[5]. Yang, Jie and Deng, Debing. (2023) Numerical study on the influence of wear and damage of the main feedwater Venturi flowmeter in nuclear power plants. China Nuclear Power, 01, 102 - 106.
[6]. Zhang, Xinwei, Yang, Huimin, Chen, Yifei, Ma, Yan and Wang, Xuenong. (2021) Design and experiment of water - fertilizer integration equipment. Journal of Agricultural Mechanization Research, 09, 98 - 104.
[7]. Pan, J., Guang, W., Liu, Q., Lu, J., Tao, R., Zhu, D., and Xiao, R. (2024). Numerical simulation of sand erosion in Venturi tube under different flow characteristics and sand content. Journal of Physics: Conference Series, 2752(1), 012206.