


1. Introduction
Data visualization, machine learning, and deep learning are some of the popular artificial intelligence technologies that are continually breaking new ground and improving due to the quick growth of national technology and the increase in computer speed. The merging of artificial intelligence with medical data is currently a prominent study area since at the same time, industrial information in the medical field has also been fed with a big amount of data[1][2]. A growing number of diseases can now be anticipated by AI algorithms or early disease prediction, enabling patients to prepare both physically and mentally for the sickness. Support vector machines, decision trees, and neural networks—all of which are completely theoretical—remain the present mainstays of research methodology[3-5].
Predicting early sickness severity risk has many advantages, including lowering mortality rates, utilizing fewer hospital resources, and helping doctors make decisions. The causes of this increase in cases include the high frequency of COVID-19, delayed detection, and a shortage of resources in a lot institutions to combat this epidemic[6]. Therefore, determining the severity risk of COVID-19 patients is a crucial work with huge benefits, like ensuring that each patient receives the appropriate level of medical care based on their severity, efficiently using hospital resources by giving the dangerous
patient top priority, and helping physicians in making choices which would likely to improve the patient's health[7].
As the amount of patients who died in the result of COVID-19 virus rises globally, researchers are working nonstop to develop technology solutions to assist medical people in their day-to-day work[8]. In order to help clinicians anticipate a patient's severity and mortality risk, artificial intelligence (AI) tools that are quick and precise are needed. Early patient severity prediction could assist conserve hospital resources and lower patient mortality by recommending early pharmacological interventions.
The genetic algorithm, which draws inspiration from nature, is used to solve optimization and search issues[9]. It is predicated on the concepts of crossover, mutation, and natural selection. With this technique, a population of distinct chromosomes is created[10]. A gene within a chromosome represents the characteristics of a solution, while a chromosome itself symbolizes one possible solution to a problem[11]. We can determine the accuracy of a solution by looking at the fitness that each individual solution has. The fitness changes depending on the problem. Our goal is to evolve a population to the appropriate accuracy level. By choosing the best people from the population and breeding them together to create new populations, evolution is accomplished. To sustain diversity in the population, some people have also undergone mutations.
Support A highly well-liked supervised machine learning algorithm for classification and regression analysis is called Vector Machine. SVM creates a collection of hyperplanes that can be applied to classification. SVM can be applied to multiclass and binary classification.
However, due to the complexity and variability of symptoms of miscellaneous diseases, there is still deficiency in the information and intellectual technology, particularly in the application of machine learning in clinical care. Thus, a utilitarian model for disease prediction is crucial for humanity to take a step further in medicine.
2. Method
2.1. Method design
In this section, we show our research method in detail.
| |
Figure 1. Neural research method. | |
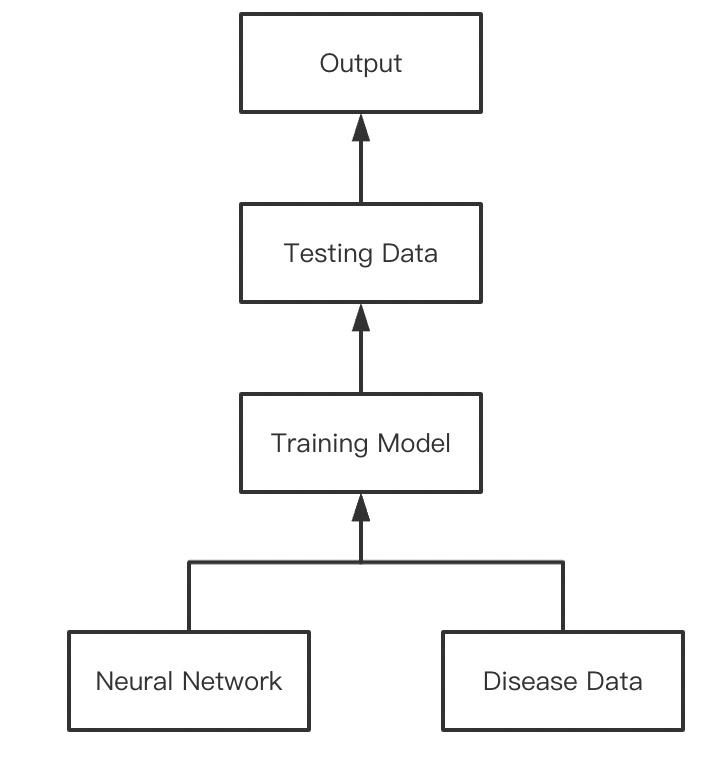
1.1.1. Neural network. Figure 1 is our Neural research method. The most authentic aspect of deep learning is training our neural network, which involves learning the values of our parameters. We may think of this learning process in a neural network as an iterative process of "going and returning" by the layers of neurons. Information is propagated forward and backward when "going" and "returning," respectively.
The network is exposed to training data during the initial phase of forward propagation, and these data are then distributed across the whole neural network to compute predictions (labels). This entails transferring the input data across the network in a way that all the neurons transform the data they receive from the neurons in the layer below before delivering it to the neurons in the layer above. Once the data has passed through all the layers and all of the neurons have completed their computations, the final layer will be reached with the label prediction outcome for those input cases.
In order to assess and evaluate how well or poorly our forecast performed in comparison to the actual outcome, we will then apply a loss function to estimate the loss.
This information is propagated backwards once the loss has been computed. So, back propagation gets its name. All of the hidden layer's neurons that provide directly to the output layer that receive this loss information starting from the output layer.
| |
Figure 2. SVM research method. | |
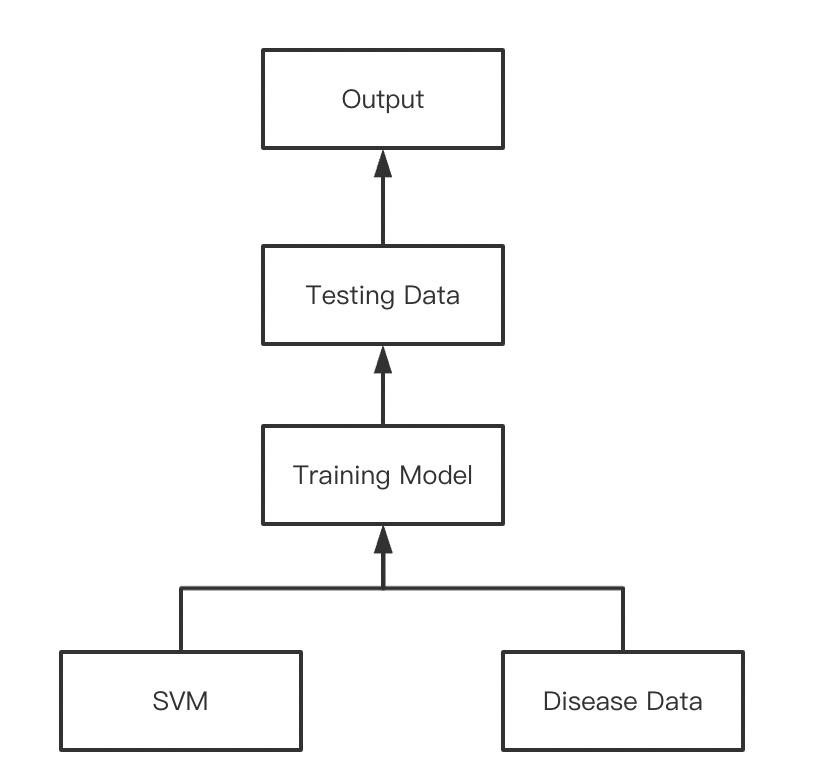
1.1.2. SVM. The method flow is shown in Figure 2. We mainly follow the steps to implement the method.
Step 1: Install the necessary libraries.
Step 2: Import the dataset and extract the X and Y variables separately.
Step 3: Separate the dataset into train and test subsets.
Step 4: Set up the SVM classifier model
Step 5: SVM classifier model fitting Predictions are made in step six.
Step 6: Assessing the model's performance
| |
Figure 3. Random forest research method. | |
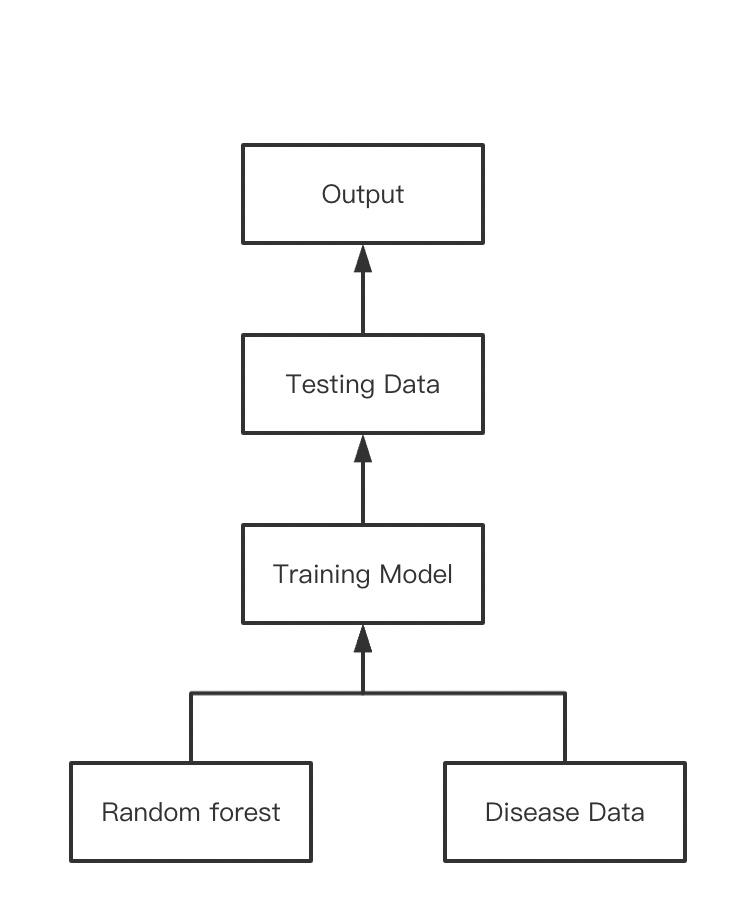
1.1.3. Random forest. The Random Forest method is shown in Figure 3. We mainly follow the steps to implement the method.
Step 1: From a data set with k records, n random records are selected at random and used in the Random Forest algorithm.
Step 2: For each sample, a unique decision tree is built.
Step 3: An output will be produced by each decision tree.
Step 4: For classification and regression, the final result is evaluated using a majority vote or an average.
|
Figure 4. CNN research method. |

1.1.4. CNN
Figure 4 is our CNN method. CNN has three dimension volumes of neurons, the Convolutional neural networks, which have the advantage of the fact that the input is a picture, divide the neurons into 3 dimensions ----depth, height and width. CNN has formed by several different layers, In the Convolutional layer, every layer was formed by several Convolution kernels, and the back-propagation approach is used to optimize each convolution kernel's parameter.
Convolution operation's goal is to extract various input features. Edges, lines, and corners are examples of low-level characteristics that the initial convolutional layer might only be able to extract at the layer level; but, as the network grows, subsequent layers will be able to iteratively extract more sophisticated features from the low-level features. The activation function of this neural layer uses Rectified Linear Units to add non-linear mapping, therefore it then moved on to the Relu layer.
Following this, the data was passed to the Pooling layer, where features with high dimensionality were obtained, and the features were sliced into several regions, with their maximum values or averages used to generate new, lower dimensional features. Finally, the data produces the result of what disease the patient truly suffered from.
Both procedures that we mentioned above are states in Figure 4.
1.2. Disease data
The disease data are all presents by the binary discrete digits using 0 and 1, and it includes four types of disease which are Covid, Cold, Allergy and Flu, each of these data has its symptoms like cough, muscle aches, tiredness, sore throat, runny nose, stuffy nose, fever, nausea, vomiting and diarrhea.
There are a total of 44,453 images in the datasets, with 16,381, 1,023, 2,048, and 25,000 images in the four types. There are 35562 training sets, which are 13043,813,1638,20068 respectively. A total of 8891 sets were used as test sets, which were 3,381,211,410,4932 respectively.
|
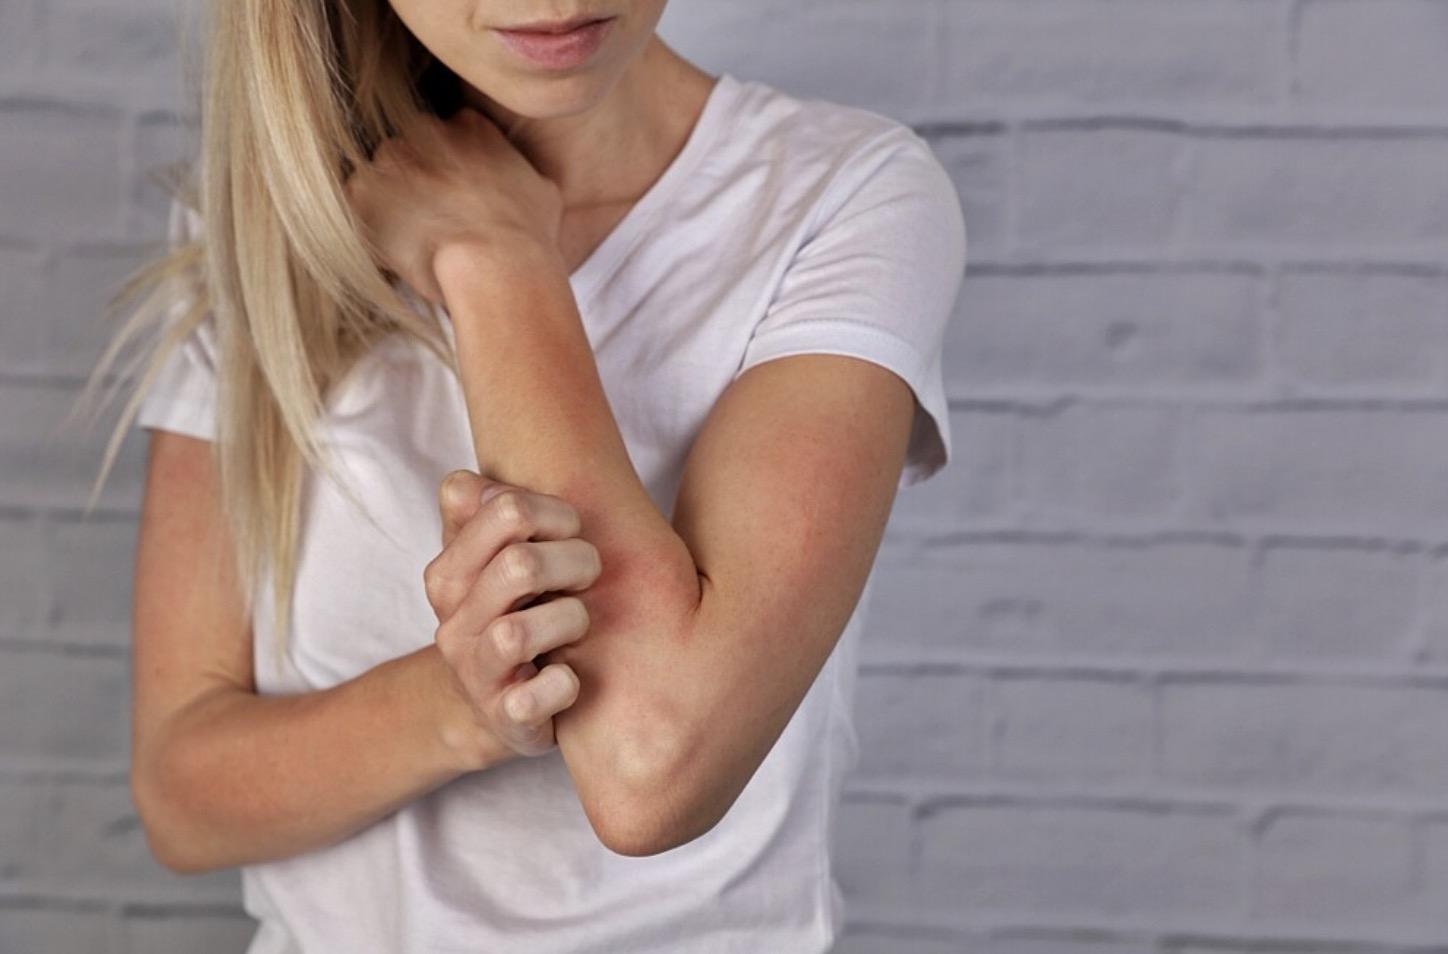
Figure 5. Data examples. |

1.3. Training model
We consider SVM(Support Vector Machine), random forest and neural network(CNN)to be a proper methods to do the prediction based on the symptoms of Four diseases.
In order to mimic the biological mechanism of visual perception, convolutional neural networks (CNNs), which are capable of both guided and unsupervised learning, were developed. Due to the convolution kernel parameter share in the hidden layers and the sparseness of the connections between layers, the convolutional neural network may be able to produce grid-like topological qualities with the least amount of processing. For example, it is the fact that to learn for pixel and audio with predictable results and without the need for further feature engineering for the incoming input. For a neural network (CNN) with two layers and 32 neurons each, we build a neural network classifier.
A categorizing system made up of many decision trees is known as a random forest. It seeks to generate an uncorrelated forest of trees whose forecast by committee is more accurate than that of any individual tree by using bagging and feature randomness to create each individual tree.
Support-vector machines (SVM) evaluate data for classification and regression analysis using supervised learning models and gathered learning techniques. In the purpose of maximize the distance between the two categories. an SVM maps training examples to spatial points. choosing 8891data and training these parameters using the aforementioned techniques separately. The result is a 5*3 model that compares each method's accuracy.
2. Testing results
Table 1. Training data, classification report (with accuracy: 93.84).
precision | recall | f1-score | support | |
0 | 0.98 | 0.98 | 0.98 | 13043 |
1 | 0.64 | 0.65 | 0.64 | 813 |
2 | 0.52 | 0.88 | 0.65 | 1638 |
3 | 0.98 | 0.93 | 0.95 | 20068 |
micro avg | 0.94 | 0.94 | 0.94 | 35562 |
macro avg | 0.78 | 0.86 | 0.81 | 35562 |
weighted avg | 0.95 | 0.94 | 0.94 | 35562 |
samples avg | 0.94 | 0.94 | 0.94 | 35562 |
Table 1 has manifested the training results from SVM. It can be seen that the accuracy of SVM is approximately 93.84. Also, the figure shows that the recall is 0.94, and the f1-score is 0.94 as well.
Table 2. Test data, classification report (with accuracy: 93.84).
precision | recall | f1-score | support | |
0 | 0.97 | 0.98 | 0.97 | 3338 |
1 | 0.41 | 0.42 | 0.42 | 211 |
2 | 0.42 | 0.70 | 0.53 | 4110 |
3 | 0.96 | 0.91 | 0.94 | 4932 |
micro avg | 0.91 | 0.91 | 0.91 | 8891 |
macro avg | 0.69 | 0.75 | 0.71 | 8891 |
weighted avg | 0.93 | 0.91 | 0.92 | 8891 |
samples avg | 0.91 | 0.91 | 0.91 | 8891 |
The accuracy of testing, according to Table 2, is 93.84. Here it has the recall to be 0.91, and f1-score to be 0.91.
Table 3. Results in which.
{`ALLERGY`: 0 , `COLD`: 1, `COVID` : 2, `FLU`: 3}
[[3317 18 3 0]
[104 99 8 0]
[ 5 0 195 210]
[ 40 51 280 4561]].
precision | recall | f1-score | support | |
0 | 0.96 | 0.99 | 0.98 | 3338 |
1 | 0.59 | 0.47 | 0.52 | 211 |
2 | 0.40 | 0.48 | 0.44 | 4110 |
3 | 0.96 | 0.92 | 0.94 | 4932 |
accuracy | 0.92 | 8891 | ||
macro avg | 0.73 | 0.72 | 0.72 | 8891 |
weighted avg | 0.92 | 0.92 | 0.92 | 8891 |
Table 4. Results in which.
{`ALLERGY`: 0 , `COLD`: 1, `COVID` : 2, `FLU`: 3}
[[3241 81 2 14]
[82 73 6 50]
[ 3 5 42 360]
[ 22 67 343 4500]].
precision | recall | f1-score | support | |
0 | 0.97 | 0.97 | 0.97 | 3338 |
1 | 0.32 | 0.35 | 0.33 | 211 |
2 | 0.11 | 0.10 | 0.10 | 410 |
3 | 0.91 | 0.91 | 0.91 | 4932 |
accuracy | 0.88 | 8891 | ||
macro avg | 0.58 | 0.58 | 0.58 | 8891 |
weighted avg | 0.88 | 0.88 | 0.88 | 8891 |
Table 3 and Table 4 exhibit the results from other two methods. After the training and testing of the model, it becomes clear enough that for SVM, the accuracy of the data is approximately 0.92. Random Forest and Neural Network are found to have accuracy of around 0.88 and 0.94 respectively. With more training, we have compared the classifiers and concluded that Neural Network and SVM have similar accuracy, which is around 0.9, while Random Forest has a comparatively lower one, which is about 0.85. Yet since they all have accuracy above 0.8, they can all be reliable, and indeed they manifest the same results most of the time.
A primitive model for predicting diseases is now developed. Equipped with such a technology, humanity will no longer suffer from the time-wasting diagnosis. Moreover, folks can be informed about the potential danger they may encounter in advance and be prepared ahead of time. Yet, a lot of improvements are still vital for making the prediction utilitarian. For explication, the accuracy can be even higher, and more diseases can be classified, so that there is a smaller possibility for patients to be misled. Also, the running process can be made more efficient, with a more concise code, to minimize the time for loading.
3. Conclusions
For this research we have compared three methods, which are SVM, Random Forest and Neural Network, in order to build a reliable model for disease predictions. The diseases we have classified are flu, allergy, cold and COVID-19. We basically use the three methods to classify the symptoms of these diseases. SVM and Neural Network have the greatest accuracy in the training, which is about 0.9. Random Forest has a slightly lower accuracy of 0.85.
The model, however, still requires a huge amount of work to be completed. For instance, the accuracy can be trained even higher, and more diseases can be analyzed. Simultaneously, the code can be more concise to minimize the running time.
References
[1]. COVID-19 Dashboard by the Center for Systems Science and Engineering (CSSE) at Johns Hopkins University (JHU), [online] Available: https://coronavirus.jhu.edu.
[2]. Xu Liang et al. "Application of Artificial Intelligence in Disease Prediction." Nature Journal 40.05(2018):41-46.
[3]. Yang Wenjing et al. "Visual Analysis of Artificial Intelligence in Disease Prediction Research." Chinese Public Health 37.5(2021):4.
[4]. Agrebi, Said, and Anis Larbi. “Use of Artificial Intelligence in Infectious Diseases.” Artificial Intelligence in Precision Health, Academic Press, 13 Mar. 2020, https://www.sciencedirect.com/science/article/pii/B9780128171332000185.
[5]. P.S. Kohli and S. Arora, "Application of Machine Learning in Disease Prediction," 2018 4th International Conference on Computing Communication and Automation (ICCCA), 2018, pp. 1-4, doi: 10.1109/CCAA.2018.8777449.
[6]. Stafford, I. S., Kellermann, M., Mossotto, E., Beattie, R. M., MacArthur, B. D., & Ennis, S. (2020, March 9). A systematic review of the applications of artificial intelligence and machine learning in autoimmune diseases. Nature News. Retrieved October 9, 2022, from https://www.nature.com/articles/s41746-020-0229-3
[7]. Agrawal, Anant, et al. “Disease Prediction Using Machine Learning.” SSRN, 4 May 2018, https://papers.ssrn.com/sol3/papers.cfm?abstract_id=3167431.
[8]. Tixier, Antoine J.-P., et al. “Application of Machine Learning to Construction Injury Prediction.” Automation in Construction, Elsevier, 15 June 2016, https://www.sciencedirect.com/science/article/abs/pii/S0926580516300966?fr=RR-2&ref=pdf_download&rr=7576768269b3ddef.
[9]. Zoabi, Yazeed, et al. “Machine Learning-Based Prediction of COVID-19 Diagnosis Based on Symptoms.” Nature News, Nature Publishing Group, 4 Jan. 2021, https://www.nature.com/articles/s41746-020-00372-6.
[10]. Kohli, Pahulpreet Singh. “Application of Machine Learning in Disease Prediction.” IEEE Xplore, 14 Dec. 2018, https://ieeexplore.ieee.org/document/8777449.
[11]. Chaurasia, Vikas, and Saurabh Pal. “Application of Machine Learning Time Series Analysis for Prediction COVID-19 Pandemic - Research on Biomedical Engineering.” SpringerLink, Springer International Publishing, 24 Oct. 2020, https://link.springer.com/article/10.1007/s42600-020-00105-4.
Cite this article
Bi,A.;Han,Z.;Zha,Y. (2023). Research and application of artificial intelligence in disease prediction. Applied and Computational Engineering,6,356-363.
Data availability
The datasets used and/or analyzed during the current study will be available from the authors upon reasonable request.
Disclaimer/Publisher's Note
The statements, opinions and data contained in all publications are solely those of the individual author(s) and contributor(s) and not of EWA Publishing and/or the editor(s). EWA Publishing and/or the editor(s) disclaim responsibility for any injury to people or property resulting from any ideas, methods, instructions or products referred to in the content.
About volume
Volume title: Proceedings of the 3rd International Conference on Signal Processing and Machine Learning
© 2024 by the author(s). Licensee EWA Publishing, Oxford, UK. This article is an open access article distributed under the terms and
conditions of the Creative Commons Attribution (CC BY) license. Authors who
publish this series agree to the following terms:
1. Authors retain copyright and grant the series right of first publication with the work simultaneously licensed under a Creative Commons
Attribution License that allows others to share the work with an acknowledgment of the work's authorship and initial publication in this
series.
2. Authors are able to enter into separate, additional contractual arrangements for the non-exclusive distribution of the series's published
version of the work (e.g., post it to an institutional repository or publish it in a book), with an acknowledgment of its initial
publication in this series.
3. Authors are permitted and encouraged to post their work online (e.g., in institutional repositories or on their website) prior to and
during the submission process, as it can lead to productive exchanges, as well as earlier and greater citation of published work (See
Open access policy for details).
References
[1]. COVID-19 Dashboard by the Center for Systems Science and Engineering (CSSE) at Johns Hopkins University (JHU), [online] Available: https://coronavirus.jhu.edu.
[2]. Xu Liang et al. "Application of Artificial Intelligence in Disease Prediction." Nature Journal 40.05(2018):41-46.
[3]. Yang Wenjing et al. "Visual Analysis of Artificial Intelligence in Disease Prediction Research." Chinese Public Health 37.5(2021):4.
[4]. Agrebi, Said, and Anis Larbi. “Use of Artificial Intelligence in Infectious Diseases.” Artificial Intelligence in Precision Health, Academic Press, 13 Mar. 2020, https://www.sciencedirect.com/science/article/pii/B9780128171332000185.
[5]. P.S. Kohli and S. Arora, "Application of Machine Learning in Disease Prediction," 2018 4th International Conference on Computing Communication and Automation (ICCCA), 2018, pp. 1-4, doi: 10.1109/CCAA.2018.8777449.
[6]. Stafford, I. S., Kellermann, M., Mossotto, E., Beattie, R. M., MacArthur, B. D., & Ennis, S. (2020, March 9). A systematic review of the applications of artificial intelligence and machine learning in autoimmune diseases. Nature News. Retrieved October 9, 2022, from https://www.nature.com/articles/s41746-020-0229-3
[7]. Agrawal, Anant, et al. “Disease Prediction Using Machine Learning.” SSRN, 4 May 2018, https://papers.ssrn.com/sol3/papers.cfm?abstract_id=3167431.
[8]. Tixier, Antoine J.-P., et al. “Application of Machine Learning to Construction Injury Prediction.” Automation in Construction, Elsevier, 15 June 2016, https://www.sciencedirect.com/science/article/abs/pii/S0926580516300966?fr=RR-2&ref=pdf_download&rr=7576768269b3ddef.
[9]. Zoabi, Yazeed, et al. “Machine Learning-Based Prediction of COVID-19 Diagnosis Based on Symptoms.” Nature News, Nature Publishing Group, 4 Jan. 2021, https://www.nature.com/articles/s41746-020-00372-6.
[10]. Kohli, Pahulpreet Singh. “Application of Machine Learning in Disease Prediction.” IEEE Xplore, 14 Dec. 2018, https://ieeexplore.ieee.org/document/8777449.
[11]. Chaurasia, Vikas, and Saurabh Pal. “Application of Machine Learning Time Series Analysis for Prediction COVID-19 Pandemic - Research on Biomedical Engineering.” SpringerLink, Springer International Publishing, 24 Oct. 2020, https://link.springer.com/article/10.1007/s42600-020-00105-4.