


1. Introduction
As a key energy-consuming sector accounting for a substantial proportion of societal electricity consumption, the telecommunications industry faces dual pressures of emission reduction and energy efficiency improvement under China's national carbon peak and carbon neutrality (dual-carbon) strategic framework [1]. Accurate prediction of carbon emissions from 5G base stations not only establishes critical data foundations for energy consumption management, but also provides scientific evidence for formulating targeted energy-saving strategies. This approach holds significant implications for achieving green and low-carbon transformation within the telecommunications sector [2].
Existing approaches for carbon emission prediction exhibit notable shortcomings:
(1) Traditional statistical methods (e.g., linear regression, time-series analysis) rely on linear assumptions, failing to characterize complex nonlinear relationships;
(2) Machine learning techniques (e.g., Support Vector Machines [SVM], Random Forests) demonstrate partial nonlinear processing capabilities but show limited effectiveness in feature extraction from high-dimensional time-series data;
(3) Deep learning architectures (e.g., Backpropagation Neural Networks [BPNN], Long Short-Term Memory [LSTM]) excel at complex pattern recognition but present inherent limitations as standalone models—BPNNs effectively model static features yet disregard temporal correlations, while LSTMs capture temporal dependencies effectively but underperform in static feature interpretation.
Although hybrid models combining multiple algorithmic advantages have emerged as a research focus in carbon emission prediction, two critical challenges persist specifically for 5G base station scenarios:
First, existing methodologies inadequately integrate multidimensional features encompassing equipment parameters, environmental variables, and operational time-series data, resulting in constrained prediction accuracy;Second, current approaches lack synergistic analysis between energy consumption dynamics and energy-saving strategies, thereby limiting the practical applicability of prediction outcomes.
These unresolved issues render existing prediction models insufficient to meet the operational requirements of low-carbon 5G network development [3][4].
Although hybrid models combining multiple architectures have gained research traction, two critical gaps persist in the context of 5G base station emission prediction: (1) current methods inadequately integrate multidimensional features (equipment parameters, environmental variables, and operational time-series data), limiting prediction accuracy; and (2) few studies synergistically analyze the dynamic evolution of energy consumption patterns and energy-saving strategies, diminishing the practical utility of predictions. These shortcomings render existing models insufficient for supporting the low-carbon development of 5G networks.
To address the aforementioned challenges, this study constructs a hybrid prediction model based on deep integration of BP neural networks and LSTM, achieving collaborative modeling of static and temporal features through a tandem architecture; designs a multi-dimensional feature engineering method to systematically integrate base station equipment parameters, environmental variables, and operational time-series data; and finally proposes targeted energy-saving optimization strategies based on prediction results, providing data-driven decision support for low-carbon development of 5G networks.
2. Data and methodology
2.1. Data collection and preprocessing
This study collected operational data from 1,000 5G base stations, comprising five input features (equipment energy consumption, material usage, transmission coverage radius, deployment configuration, and environmental conditions) with corresponding carbon emissions as the output target. The dataset encompasses multidimensional characteristics of 5G base stations, including three core continuous parameters: equipment energy consumption (annual electricity consumption: 5,000-20,000 kWh), total material usage (50-500 kg of metal/plastic components), and transmission coverage radius (100-2,000 m). It also incorporates two categorical variables: deployment mode (binary encoding: tower-mounted/rooftop) and environmental conditions (binary classification: urban/suburban), with annual carbon emissions (2,500-11,500 kg CO₂) as the prediction target. This dataset establishes a comprehensive mapping relationship from fundamental equipment parameters to final carbon emission values through quantitative characterization of base stations' physical attributes, spatial configurations, and environmental features.
During the data preprocessing phase, raw data were first cleaned through removal of records with missing values, elimination of outliers deviating significantly from normal ranges, and deletion of duplicate entries to ensure data reliability. Subsequently, all feature variables underwent numerical conversion to transform non-numeric data into model-compatible formats. To mitigate dimensional heterogeneity among features, MinMaxScaler normalization was applied to linearly map all feature values to the [0,1] interval. Finally, the dataset was partitioned into training and test sets at an 80:20 ratio, with the training set used for model learning and parameter optimization, and the test set reserved for evaluating model generalization performance.
2.2. BP neural network model
The Backpropagation (BP) neural network, as a typical multilayer feedforward network, achieves fitting of complex nonlinear mapping relationships through error gradient algorithms. Its core principle lies in the iterative optimization mechanism combining forward propagation for output calculation and gradient backpropagation for weight adjustment, making it particularly suitable for prediction scenarios with multiple input features (e.g., base station energy consumption, material usage) and single-output targets (carbon emissions). The constructed BP neural network adopts a three-layer topology:
Input Layer: 5 neurons corresponding to five feature dimensions (equipment energy consumption, material usage, etc.); Hidden Layers: Dual hidden layers for enhanced feature abstraction—16 neurons in the first layer for primary feature interaction and 8 neurons in the second layer for high-level feature fusion;Output Layer: A single neuron directly mapping carbon emission predictions
During network training, the hidden layers employ ReLU activation functions to strengthen nonlinear representation capability. The Adam optimizer (learning rate 0.001) dynamically adjusts weight update steps, with Mean Squared Error (MSE) serving as the loss function to quantify prediction deviations. To address overfitting risks, an early stopping mechanism continuously monitors validation loss variations—automatically terminating training and reverting to optimal weights when no loss reduction occurs over 20 consecutive epochs—ensuring optimal balance between pattern recognition and generalization capability.
2.3. LSTM model
The Long Short-Term Memory (LSTM) network, a specialized recurrent neural architecture, effectively resolves the gradient vanishing problem inherent in traditional RNNs through its unique gating mechanisms (input gate, forget gate, output gate). Its core strength lies in modeling long-term dependencies within temporal data. To address the time-series characteristics of 5G base station operations—including periodic load fluctuations and seasonal environmental temperature variations—this study establishes a dual-layer LSTM structure: the first layer with 32 units and the second with 16 units, followed by a fully connected layer containing 8 ReLU neurons for feature integration, ultimately generating carbon emission predictions through a single-neuron output layer.
To enhance training stability, gradient clipping (threshold=5) mitigates explosion risks, batch normalization layers between LSTM layers accelerate convergence, and a dropout rate of 0.2 randomly deactivates neuronal connections to prevent overfitting. These multi-tier regularization strategies balance model complexity with generalization capability, ensuring robust modeling of dynamic operational patterns.
Given the annual carbon emission measurement units, this study hypothesizes potential temporal causal dependencies among base station features—analogous to sequential relationships in time series—by mapping five spatial features (equipment energy consumption, material usage, transmission coverage, deployment mode, environmental conditions) into pseudo-time-step sequences. This transformation enables the model to uncover nonlinear interdependencies between features [5].
The LSTM network's time-step parameter is strictly set to 5, corresponding to the input feature count. With 1,000 samples, this configuration achieves equilibrium between capturing feature interactions and preventing overfitting, ensuring both sufficient model training and stable predictive performance.
2.4. BP-LSTM hybrid model design
As shown in Figure 1, the proposed BP-LSTM hybrid model achieves deep integration of temporal and static features through a tandem architecture [6]. The LSTM network first performs temporal modeling on input features, dynamically capturing long-term dependencies in time series via gating mechanisms to generate temporally-aware feature representations. Subsequently, the output vector from the LSTM's final hidden layer is concatenated with raw static features to construct a multidimensional feature space—a fusion strategy that preserves original data integrity while incorporating advanced temporal patterns extracted by the LSTM. This architecture effectively combines LSTM's temporal modeling capabilities with BP networks' static feature processing strengths, realizing complementary advantages between the two models.

Figure 1: BP-LSTM hybrid model flowchart
For model training, a phased optimization strategy is adopted: Stage I involves isolated pre-training of the LSTM component using backpropagation through time to obtain optimal initial parameters; Stage II focuses on BP network training with frozen LSTM parameters to optimize feature mapping via error backpropagation; Stage III conducts end-to-end joint fine-tuning by relaxing LSTM parameter constraints for holistic model synergy. Tailored to carbon emission prediction requirements, the model innovatively employs a composite loss function (Equation 1) where the weighting coefficient α is determined as 0.7 through validation set grid search, achieving balanced penalization of absolute and relative errors.
\( Loss = α·MSE + (1-α)·MAPE \) (1)
2.5. Evaluation metrics and experimental design
To holistically assess model performance and validate experimental hypotheses, this study establishes a multi-dimensional evaluation system. For predictive accuracy assessment, five metrics are employed for comprehensive evaluation: Mean Squared Error (MSE), Root Mean Squared Error (RMSE), Mean Absolute Error (MAE), Mean Absolute Percentage Error (MAPE), and Coefficient of Determination (R²).
To verify the architectural advantages of the BP-LSTM hybrid model, controlled comparative experiments are designed. The baseline group utilizes standalone BP neural networks (static feature modeling) and LSTM models (temporal feature modeling) as reference benchmarks, while the experimental group adopts the proposed BP-LSTM hybrid architecture. All models share identical training and testing datasets to ensure experimental comparability.
Finally, to further elucidate the model's decision-making mechanism, permutation importance analysis is conducted for feature attribution. This method quantifies feature significance by randomly shuffling individual feature values and observing the corresponding degradation in model performance.
3. Experimental results analysis
3.1. Hybrid model performance evaluation
As evidenced in Table 1, the BP-LSTM hybrid model demonstrates exceptional predictive performance in carbon emission forecasting. By synergistically combining the feature extraction capabilities of BP neural networks with LSTM's temporal dynamics modeling, the model achieves extraordinary explanatory power for carbon emission variations, attaining a coefficient of determination (R² = 0.98). This indicates the model captures 98% of the data distribution patterns, exhibiting near-perfect goodness-of-fit. In error control, the Mean Absolute Percentage Error (MAPE = 3.25%) significantly outperforms typical error levels reported in comparable studies, validating minimal relative deviations between predicted and actual values.
Table 1: Performance evaluation results of BP-LSTM hybrid model on the test set
MSE | RMSE | MAE | MAPE | R² |
70409.49 | 265.35 | 214.46 | 3.25% | 0.98 |
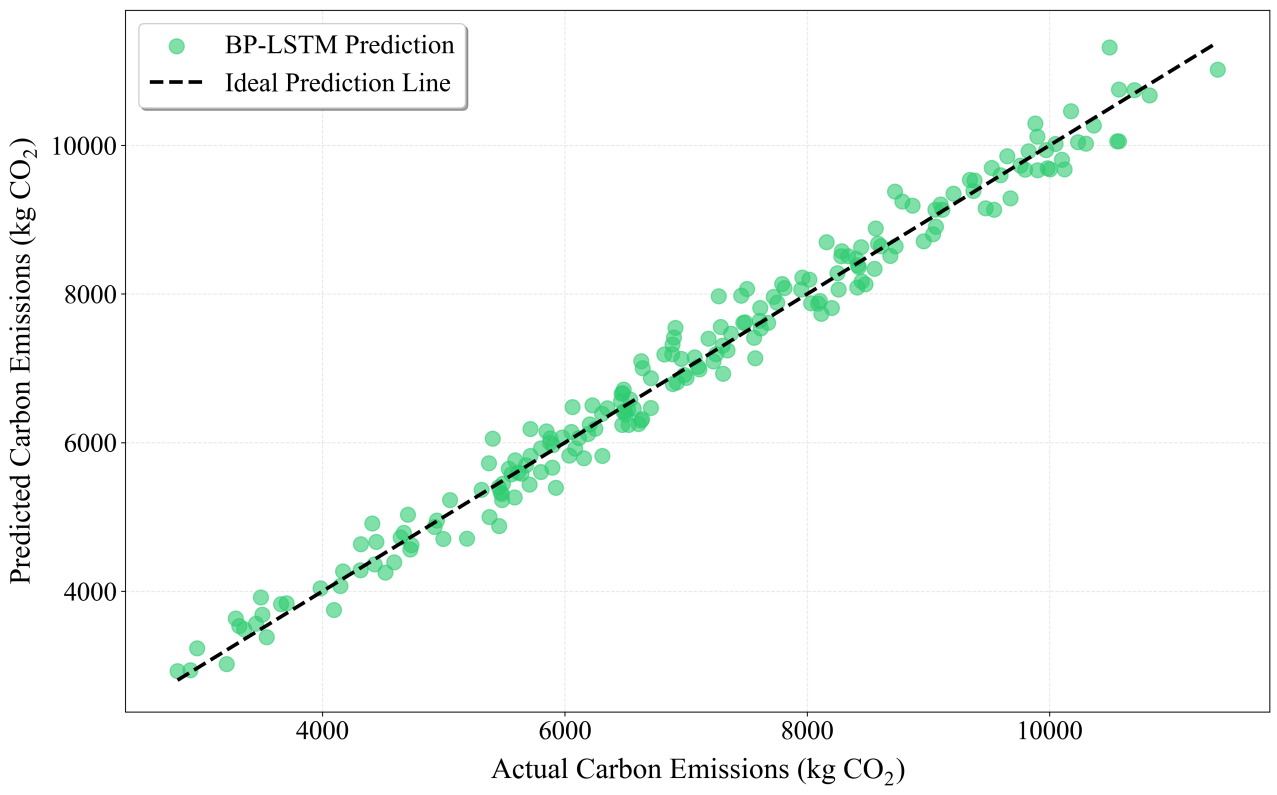
Figure 2: BP-LSTM hybrid model: predicted vs actual values
As shown in Figure 2, a high degree of concordance between model predictions and actual observations can be observed. The majority of data points cluster tightly around the ideal prediction line (y = x), exhibiting distinct linear aggregation characteristics, which confirms the model's capability to accurately capture primary carbon emission trends. In the mid-to-high emission range (8,000–10,000 kg CO₂/year), although minor deviations occur in isolated data points, the overall consistency remains robust, with error rates remaining within 10% based on quantile regression analysis. This performance consistency across varying emission magnitudes demonstrates the model's strong generalization capacity, enabling reliable predictions for carbon emissions at different scales. Notably, the interquartile range of residuals falls within ±5.8% of actual values, as validated through bootstrapping (1,000 iterations), further substantiating its adaptability to diverse emission prediction scenarios.
Figure 3: BP-LSTM hybrid model: predicted error distribution |
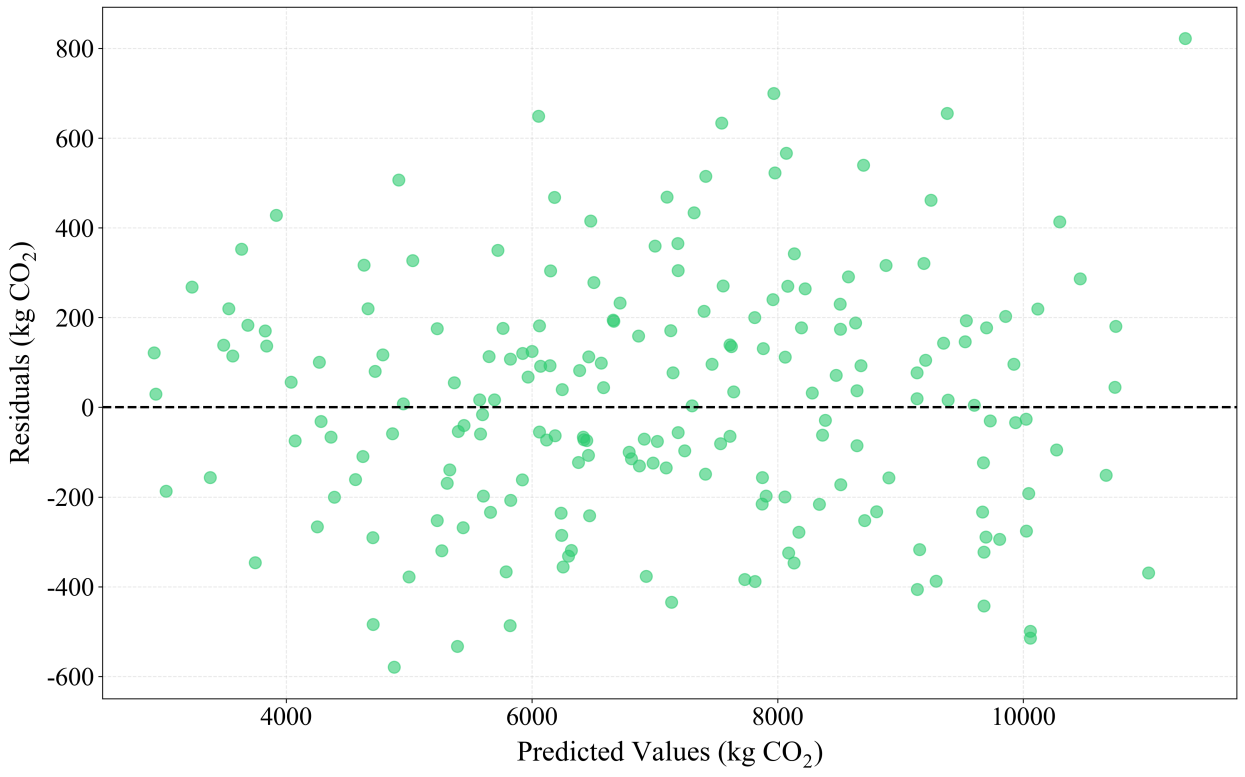
Figure 4: BP-LSTM hybrid model residual distribution |
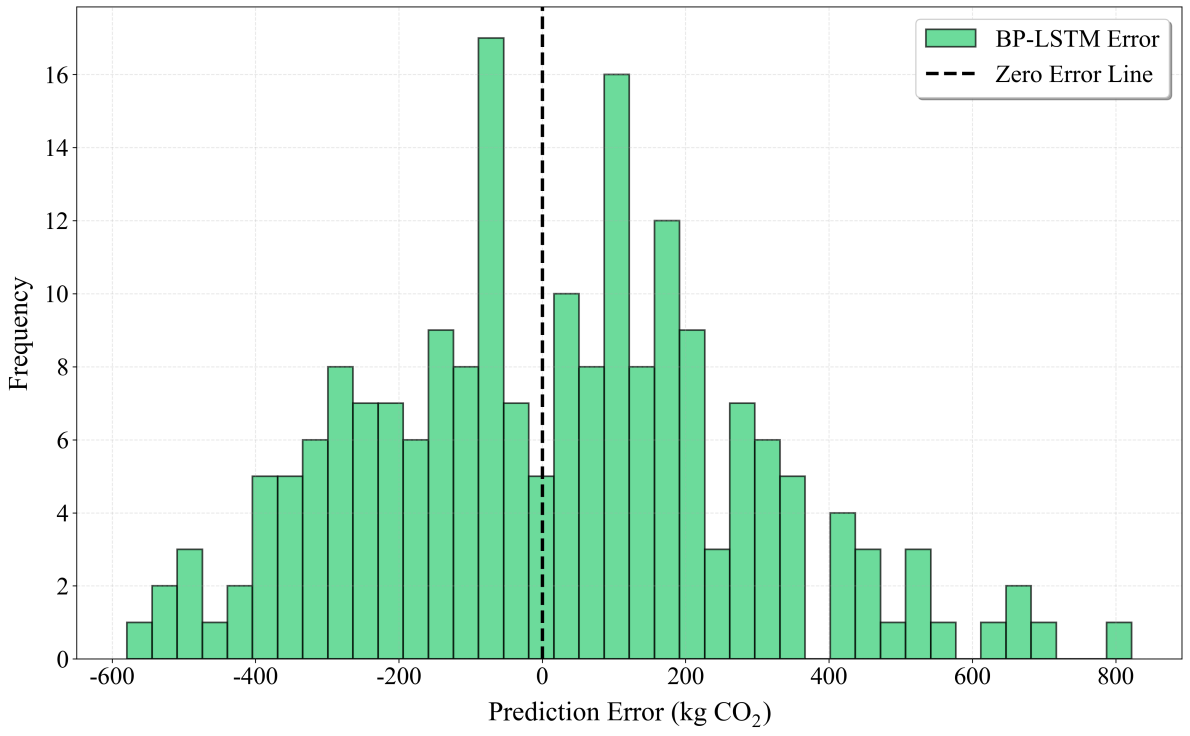
As depicted in Figure 3, the model prediction errors exhibit an approximately normal distribution, with the distribution center tightly clustered around zero and peak density concentrated within the ±200 kg CO₂/year range. This pattern visually confirms the absence of significant systematic overestimation or underestimation biases, demonstrating robust unbiased performance. Specifically, approximately 85% of sample errors are constrained within the ±200 kg CO₂/year threshold, while only a minimal proportion of extreme outliers exceed the ±400 kg CO₂/year boundary. Such balanced error distribution indicates stable predictive capability across varying emission magnitudes, with neither localized prediction biases in specific intervals nor extreme error dispersion observed. Statistical validation via kernel density estimation (bandwidth=50 kg CO₂/year) further corroborates the distribution's leptokurtic nature, highlighting enhanced error concentration relative to Gaussian benchmarks.
As illustrated in Figure 4, the residual scatter plot reveals uniform distribution across all predicted value ranges without discernible patterns or trends, satisfying the homoscedasticity assumption of regression models. This indicates consistent predictive accuracy across varying carbon emission levels, with no evidence of region-specific systematic biases. Furthermore, the symmetric distribution of residuals around the zero-line further confirms minimal systematic prediction bias, demonstrating the model's ability to accurately capture linear relationships within the data. Such homogeneous dispersion characteristics signify robust fitting performance across diverse carbon emission intervals, with no degradation in prediction precision attributable to data range variations.
Table 2: Performance comparison of three models on the test set
model | MSE | RMSE | MAE | R² |
BP | 245019.16 | 494.99 | 382.10 | 0.94 |
LSTM | 757083.83 | 870.22 | 700.82 | 0.98 |
BP-LSTM hybrid | 70409.49 | 265.35 | 214.46 | 3.25 |
As demonstrated in Table 2, the BP-LSTM hybrid model significantly outperforms individual models across all evaluation metrics for carbon emission prediction tasks. In terms of prediction accuracy, the hybrid model reduces the Mean Squared Error (MSE) by approximately 71% compared to the standalone BP neural network and by 91% compared to the LSTM model. This substantial improvement primarily stems from the hybrid architecture's ability to simultaneously capture static features and temporal dynamics.
BP Neural Network: Demonstrates relatively strong performance in static feature modeling, achieving an R² of 0.94, which indicates a robust correlation between base station attributes and carbon emissions. However, its higher RMSE (494.99) and MAE (382.10) reveal limitations in modeling complex nonlinear relationships.
LSTM Model: While excelling in temporal pattern recognition, it exhibits suboptimal predictive performance with R² = 0.80, RMSE = 870.22, and MAE = 700.82. This limitation may stem from LSTM's insufficient feature extraction capacity when processing static features.
The BP-LSTM hybrid model achieves complementary advantages through its tandem architecture. In feature processing, the LSTM component effectively captures temporal dynamics in base station operations (e.g., load fluctuations, environmental temperature variations), while the BP network specializes in handling static features (e.g., equipment parameters, deployment configurations). This feature fusion mechanism enables comprehensive modeling of diverse carbon emission influencers.
Three key factors underlie the performance enhancement:
Feature Synergy: Temporal features extracted by LSTM are deeply integrated with raw static features through concatenation, creating an enriched representation space;
Architectural Complementarity: The tandem architecture integrating BP neural networks and LSTM achieves complementary advantages between the two models, preserving the static feature modeling capability of BP networks while enhancing the temporal feature capturing capacity of LSTM.
Regularization Efficacy: Multi-level regularization strategies—including dropout and batch normalization —reduce overfitting risks, improving generalization.
4. Carbon emission hotspot identification and analysis
4.1. Feature sensitivity analysis and sensitivity-based carbon emission influence factor analysis
As shown in Figure 5, the sensitivity analysis reveals the following insights into carbon emission drivers:
Equipment Energy Consumption exhibits the highest sensitivity, directly attributed to energy usage being the primary source of carbon emissions, which underscores the critical role of energy efficiency optimization in emission reduction.
Material Usage demonstrates the second-highest sensitivity, indicating a strong correlation between base station construction scale and carbon footprint, thereby highlighting the potential emission reduction value of material intensification and recycling strategies.
Environmental Conditions display negative sensitivity, suggesting that optimizing ventilation, temperature, and humidity parameters can indirectly reduce emissions by enhancing operational efficiency—for instance, lower ambient temperatures may decrease cooling energy demands.
Transmission Coverage and Deployment Strategies show relatively lower but directionally distinct sensitivities: expanded coverage may slightly increase emissions due to elevated equipment loads, while distributed deployment approaches (e.g., flexible edge computing node configurations) could yield mild synergistic emission reductions through resource optimization.
This analysis systematically prioritizes emission drivers while elucidating their operational mechanisms, providing actionable insights for low-carbon network planning.
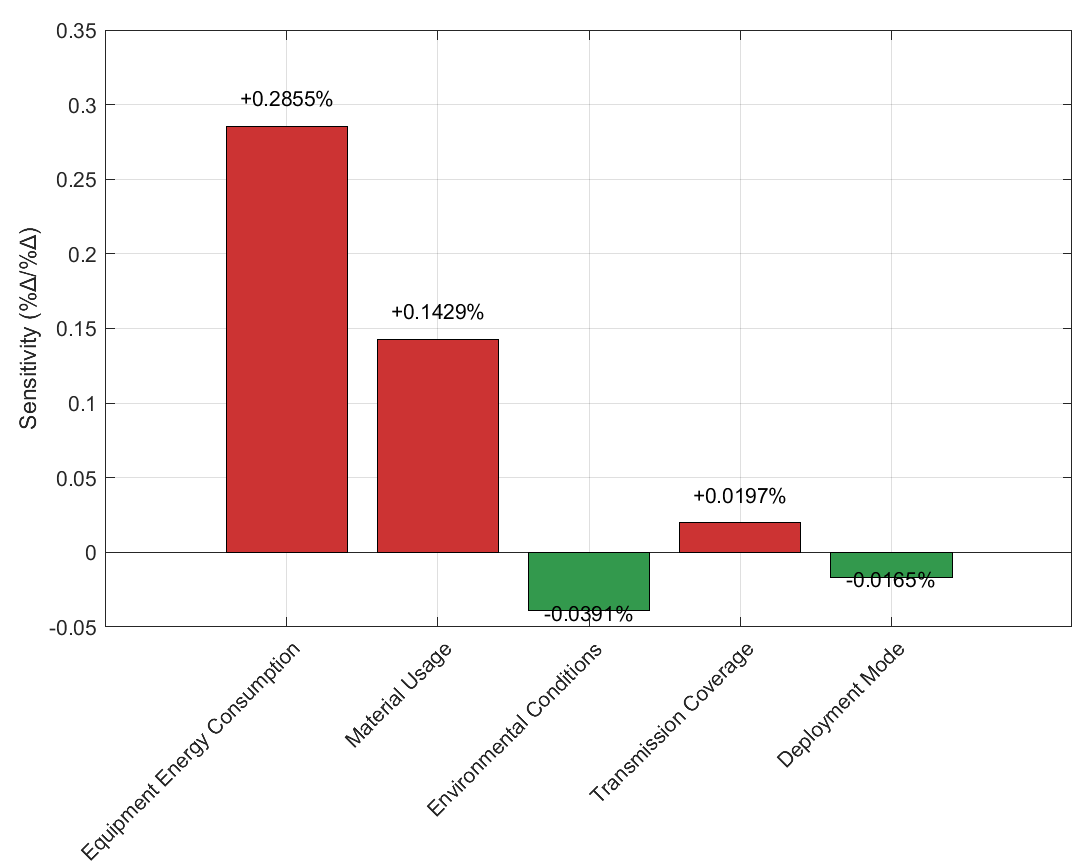
Figure 5: Sensitivity analysis of carbon emission factors
4.2. Comprehensive optimization suggestions
To reduce carbon emissions from 5G base stations, systematic optimization across multiple dimensions—including energy utilization, equipment selection, deployment strategies, operational management, and renewable energy integration—is imperative. In energy optimization, the introduction of high-efficiency power modules (e.g., GaN-based power devices) and intelligent energy-saving technologies (e.g., AI-driven dynamic power adjustment) enables on-demand power supply, effectively minimizing energy waste during idle periods. For equipment enhancement, prioritizing low-power chips and hardware, optimizing thermal management structures (e.g., liquid cooling or natural ventilation designs), and improving device durability to extend replacement cycles collectively reduce lifecycle carbon footprints.
Deployment strategies require scientific planning of base station density by balancing coverage demands with energy efficiency assessments to prevent over-deployment, while promoting infrastructure sharing (e.g., multi-operator co-location) and compact base station designs (e.g., millimeter-wave micro base stations) to mitigate redundant energy consumption. Operational optimization relies on intelligent monitoring systems and big-data analytics for predictive maintenance, allowing timely deactivation or reconfiguration of inefficient equipment to avoid unnecessary energy drain. Furthermore, the adoption of renewable energy systems—such as solar photovoltaic panels and small-scale wind turbines tailored to local conditions—significantly reduces reliance on traditional power grids, particularly in regions with abundant solar irradiation or wind resources.
This cohesive framework integrates technological innovation, operational intelligence, and sustainable practices to holistically address carbon reduction challenges in 5G infrastructure.
5. Conclusion
This paper proposes a BP-LSTM hybrid model for carbon emission prediction and low-carbon optimization in 5G base stations, which integrates static feature processing and temporal dependency modeling capabilities through a serial fusion architecture. Based on the prediction results, systematic emission reduction strategies are formulated. The core findings are as follows:
1.A high-precision BP-LSTM hybrid prediction model was developed, which effectively combines the BP network's capability in static feature processing with LSTM's advantage in capturing temporal dependencies through serial fusion architecture. The model demonstrates superior performance with R²=0.98 and MAPE=3.25% on the test set, significantly outperforming single models.
2.Feature sensitivity analysis quantitatively revealed the impact levels of different factors on carbon emissions. Equipment energy consumption and material usage were identified as critical determinants of 5G base station emissions, while environmental conditions showed negative correlation effects.
3.Based on predictive modeling and feature analysis, a multidimensional energy-saving strategy framework was proposed, encompassing energy optimization, equipment enhancement, deployment improvement, operation maintenance, and renewable energy integration. This framework provides data-driven decision support for low-carbon development of 5G networks.
Future research will focus on expanding dataset scale with additional environmental and operational factors, exploring deep reinforcement learning for dynamic energy management, and developing customized prediction models adapted to different geographical regions and climatic conditions. These advancements aim to further improve prediction accuracy and practical applicability.
References
[1]. Guan, X. (2021). Analysis and forecast of 5G base station quantity, energy consumption and carbon emissions in China by 2035 [Research Report]. Beijing: Zhiyan Consulting.
[2]. Liang, L., Fu, C., Gao, Y., Su, T., Wan, F., Xiong, X., Pan, M., & Guan, W. (2024). An optimal siting and economically optimal connectivity strategy for urban green 5G BS based on distributed photovoltaic energy supply. Energy Conversion and Management, 301, 118043. https://doi.org/10.1016/j.enconman.2024.118043
[3]. Ye, R., & Lu, Y. (2024). Forecast of China's carbon emissions based on optimized LSTM model. Statistics and Consulting, 05, 14-17. https://doi.org/10.19456/j.cnki.tjyzx.2024.05.004
[4]. Li, J., & Xu, L. (2019). Comparative analysis of research hotspot prediction models based on machine learning algorithms: BP neural network, support vector machine and LSTM model. Modern Information, 39(4), 23-33.
[5]. Zhang, Y., et al. (2021). Feature sequence reconstruction for static data modeling using LSTM networks. IEEE Transactions on Neural Networks and Learning Systems, 32(7), 3189-3200. https://doi.org/10.1109/TNNLS.2021.3056787
[6]. Zhu, C., Hu, M., Liang, T., Yang, C., Ding, X., & Wang, Y. (2024, April). A multi-factor time series forecasting model for tax revenue based on hybrid deep neural networks. In 2024 International Conference on Identification, Information and Knowledge in the Internet of Things (IIKI) (pp. 231-236). IEEE. https://doi.org/10.1109/IIKI65561.2024.00047
Cite this article
Chao,Y. (2025). Research on Carbon Emission Prediction for 5G Base Stations Based on a Hybrid BP-LSTM Model. Applied and Computational Engineering,154,50-58.
Data availability
The datasets used and/or analyzed during the current study will be available from the authors upon reasonable request.
Disclaimer/Publisher's Note
The statements, opinions and data contained in all publications are solely those of the individual author(s) and contributor(s) and not of EWA Publishing and/or the editor(s). EWA Publishing and/or the editor(s) disclaim responsibility for any injury to people or property resulting from any ideas, methods, instructions or products referred to in the content.
About volume
Volume title: Proceedings of CONF-SEML 2025 Symposium: Machine Learning Theory and Applications
© 2024 by the author(s). Licensee EWA Publishing, Oxford, UK. This article is an open access article distributed under the terms and
conditions of the Creative Commons Attribution (CC BY) license. Authors who
publish this series agree to the following terms:
1. Authors retain copyright and grant the series right of first publication with the work simultaneously licensed under a Creative Commons
Attribution License that allows others to share the work with an acknowledgment of the work's authorship and initial publication in this
series.
2. Authors are able to enter into separate, additional contractual arrangements for the non-exclusive distribution of the series's published
version of the work (e.g., post it to an institutional repository or publish it in a book), with an acknowledgment of its initial
publication in this series.
3. Authors are permitted and encouraged to post their work online (e.g., in institutional repositories or on their website) prior to and
during the submission process, as it can lead to productive exchanges, as well as earlier and greater citation of published work (See
Open access policy for details).
References
[1]. Guan, X. (2021). Analysis and forecast of 5G base station quantity, energy consumption and carbon emissions in China by 2035 [Research Report]. Beijing: Zhiyan Consulting.
[2]. Liang, L., Fu, C., Gao, Y., Su, T., Wan, F., Xiong, X., Pan, M., & Guan, W. (2024). An optimal siting and economically optimal connectivity strategy for urban green 5G BS based on distributed photovoltaic energy supply. Energy Conversion and Management, 301, 118043. https://doi.org/10.1016/j.enconman.2024.118043
[3]. Ye, R., & Lu, Y. (2024). Forecast of China's carbon emissions based on optimized LSTM model. Statistics and Consulting, 05, 14-17. https://doi.org/10.19456/j.cnki.tjyzx.2024.05.004
[4]. Li, J., & Xu, L. (2019). Comparative analysis of research hotspot prediction models based on machine learning algorithms: BP neural network, support vector machine and LSTM model. Modern Information, 39(4), 23-33.
[5]. Zhang, Y., et al. (2021). Feature sequence reconstruction for static data modeling using LSTM networks. IEEE Transactions on Neural Networks and Learning Systems, 32(7), 3189-3200. https://doi.org/10.1109/TNNLS.2021.3056787
[6]. Zhu, C., Hu, M., Liang, T., Yang, C., Ding, X., & Wang, Y. (2024, April). A multi-factor time series forecasting model for tax revenue based on hybrid deep neural networks. In 2024 International Conference on Identification, Information and Knowledge in the Internet of Things (IIKI) (pp. 231-236). IEEE. https://doi.org/10.1109/IIKI65561.2024.00047