


1. Introduction
In the Cincin Lama bridge collapse in Indonesia in 2021, brittle fracture of localized nodes occurred because multiple vehicles passed over the bridge at the same time [1]. In 2023, an old railroad Warren truss bridge in Europe suffered a web bar fracture in operation, which, due to insufficient maintenance, ultimately triggered a continuous multiple bar failure, resulting in a cascading structural collapse [2].
Since the 1940s, the topic of structural health monitoring and damage identification has attracted wide attention in the engineering field's interest, and the development of a variety of different methods [3]. Doebling et al. [4][5]and Sohn et al. [6] are two pairs of structure-based models. Bayesian Inference, because of its ability to incorporate a priori, express uncertainty, and update models from existing observations, has shown strong potential in damage identification, and health detection of structures [7].
For the structural damage identification and exploration aspects of Warren trusses, Goi and Kim [8] have used Bayesian updating to localize the existing truss damage by hypothesis testing method. In the study of Shi [9], Bayesian updating still showed high stability and accuracy in truss structures constructed from composite materials.
Bayesian updating methods have been widely used in bridge health monitoring, but little research has been done to optimize the research methods. We are faced with weak damage signals, high uncertainty of connection points, and even situations where the damage estimates are far from the actual values. In order to mitigate these problems, this paper will focus on the topic of posterior distribution optimization by proposing two key strategies.
Constructing the generation mechanism for multi-displacement point detection: detecting the corresponding information of multiple key node displacements, constructing a more constrained generation mechanism, and adding the corresponding conditions of the union in the acceptance criterion, thus improving the acceptance rate of high-quality samples, and the accuracy of the posterior distribution problem.
2. Methodology
2.1. Theoretical overview
Bayesian Inference is essentially the process of converting the problem of structural identification into the probability of a parameter and implementing an update. The core of the idea is: Through the prior distribution, we express the uncertainty of the important parameters of the bridge assumptions, and then through the likelihood function to reflect the support for the parameter evidence; and ultimately through the Bayesian update, the fusion of the prior and the updated data to determine the approximate damage of the structure.
The formula for Bayesian updating can be expressed as:
\( p(θ | D) = \frac{[p(D | θ) · p(θ)]}{p(D)} \) (1)
2.2. Priori distribution modeling and finite element analysis
The a priori distribution mainly reflects the subjective knowledge of important node parameters before structural identification. In the structural study of Warren trusses, the a priori data are probably derived from historical loading model data, design drawings, finite element analyses, or the knowledge of expert engineers.
Kwag [10] has used a hierarchical Bayesian updating model to simulate multiple layers of prior for structural parameters, resulting in greater robustness in identifying damage. Fortuin [11] points out that sparse priors (e.g., Laplace or Beta priors) in high-dimensional spaces enhance model generalization and avoid overfitting.
In order to improve the computational efficiency, this paper uses an equivalent simplified finite element model as a fast solver during multiple Bayesian updating, which reduces the model complexity while guaranteeing the consistency of the key responses, thus improving the accuracy and efficiency. The structural mechanics solver serves not only as a fundamental platform for damage simulation in this study but also as a crucial physical support in the posterior distribution generation process.
2.3. Likelihood function and data consistency modeling
The likelihood function aims to link parameters and observations, and the construction of the likelihood function is based on modeling the difference between the observed error and the structural prediction. Likelihood function construction has existed in categorized reviews and introduced nonlinear models, and weighted likelihoods to improve stability. [12].
\( L(X)=\frac{1}{\sqrt[]{2π}∙σ}{е^{-0.5(\frac{Σ (dᵢ - d̂ᵢ(θ))²}{σ²})}} \) (2)
2.4. Posterior distribution construction and representation
The posterior distribution, on the other hand, represents, corrected for the observed data, the cognitive state of the parameters of the important nodes and the final result of the Bayesian update.Meanwhile, considering that the a posteriori distribution is prone to convergence difficulties when the dimensionality is high or the quality of the observation data is insufficient, this paper proposes to integrate the information of multi-displacement measurement points to construct a more representative Proposal Distribution.
Jerez et al. [13] proposed a framework for a posteriori estimation of structural dynamic model parameters, which significantly improves the computational efficiency in multi-parameter space.Yang et al. [14] combined gradient-assisted strategy to improve the convergence efficiency, and verified the validity of the high-dimensional a posteriori estimation in the case of a real bridge.
2.5. Rejection sampling algorithm (rejection sampling)
Rejection sampling is used to sample from complex distributions, and the core idea is to generate samples from the proposed distribution q(θ) and judge whether the samples are retained or not through the accept-reject mechanism. Fusing rejection sampling with structural reliability methods can efficiently screen posterior samples [15]. Combining rejection sampling with variable weight importance sampling can realize complex a posteriori structure identification. [16].
\( α(θ)=\frac{p(θ|d)}{[M\cdot ×\cdot q(θ)]}=\frac{[p(d|θ)×p(θ)]}{[M\cdot ×\cdot q(θ)]} \) (3)
In the above formula, p(θ|d) represents the target posterior distribution, p(θ) represents the prior distribution, p(d|θ) represents the likelihood function, q(θ) represents the proposal distribution, and M is a constant satisfying M multiplied by q(θ) greater than or equal to p(θ|d).
Under the traditional rejection sampling framework, the use of full-structure response to construct the likelihood function often leads to low acceptance rate, especially when the error control is strict, the qualified samples are very few, resulting in a significant increase in the computational cost. In this paper, we introduce the "multi-point conditional acceptance" criterion into the design of the proposed mechanism, which significantly improves the adaptability of the samples in the a posteriori space with the help of the joint error metric function composed of multiple measurement points. In addition, the ratio coefficient in the rejection function can be dynamically adjusted according to the local observation sensitivity of the structure to improve the sampling efficiency.
3. Algorithms
3.1. Model establishment
In this paper, the two-dimensional truss model is constructed with Baotong bridge in Kunshan as the main body. The steel truss girder of the main bridge of Bao Tong Bridge has a length of 90 meters and a width of 23 meters, and the main truss adopts the structure of Warren truss with high-strength bolts and welded form, the truss is constructed with typical H-beam steel, weighing approximately 1500 tons, and the site is shown in the picture Fig. 1.

Figure 1: Baotong bridge
The constructed example shrinkage model is shown in Fig. 2, and its overall geometric parameters are as follows: the upper chord bar and the lower chord bar are both horizontal bars with a length of 7.5m and a total length of 45m, and the web bar consists of a vertical bar and a diagonal bar, with the vertical bar having a length of 7.5m and the diagonal bar having a length of 10.607m. The left side of the junction is the chain bar support, and the right side is the strut bar support. The initial value of tensile strength EA1 of upper and lower chords is 19000kN, and the initial tensile strength EA2 of web is 9500kN.
After structural health monitoring, it was found that all the bars showed some degree of damage EA1 reduced to 18000kN and EA1 reduced to 9000kN, which was used as the damage reference value to judge the accuracy of the post-test results.
It is estimated that the EA1 damage value conforms to the normal distribution N(16000kN,16002kN) and the EA2 damage value conforms to the uniform distribution U(7000kN,9000kN), and this is used as the prior distribution of the experiment, the error conforms to the normal distribution with the standard deviation of 2mm, judge the accuracy of the results of the posterior distribution of which its obtained by Bayesian updating of.
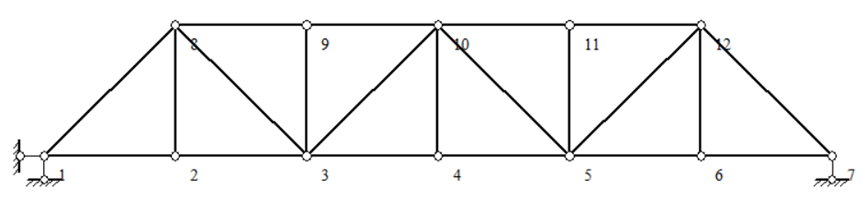
Figure 2: Example scaling model
In order to obtain the specific damage results of the bars by estimating the distribution of damage values and to seek the optimal test scheme, three test schemes with two loading modes were preset. The first test scheme is that a vertical downward concentrated force of size 1kN is applied to each node of the upper chord bar, while a vertical downward concentrated force of size 3kN is applied to the nodes of the lower chord bar, as shown in Fig. 3, and then is updated by using the displacement information of node 4. The second test scheme is to update the model using the displacement information of the two nodes, node 4 and node 11, also utilizing the loading scheme of Fig. 3. The third test scheme is to locally model the model intercepting the left end of the model 15m and a concentrated force of 40kN horizontally to the right and 20kN vertically upwards is applied to node 9, while a concentrated force of 50kN vertically downwards is applied to node 8 as shown in Fig. 4, and then updating using the displacement information of both node 8 and node 9 is carried out using the information of the displacements of both node 8 and node 9.
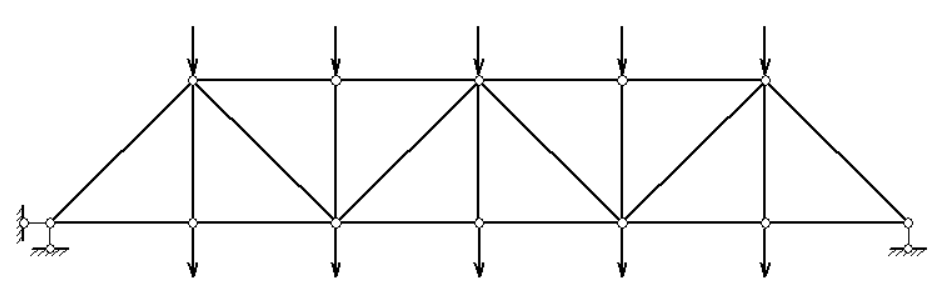
Figure 3: First loading mode
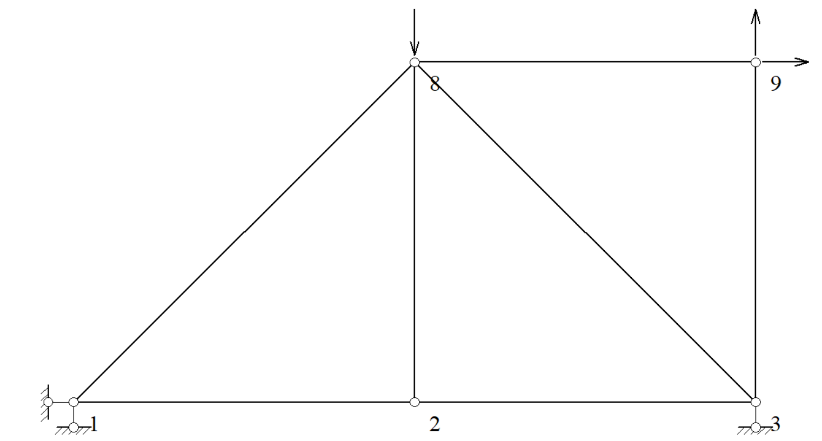
Figure 4: Second loading mode
3.2. Analysis of results
3.2.1. Comparison of loading test and update results
Using the Bayesian updating method, the model constructed by the structural mechanics solver software, obtains the measured values of vertical displacements of node 4 and node 11 as 102.426 mm and 88.546 mm respectively. The expressions for the displacements of the two points are obtained by using the obtained internal forces based on the principle of virtual work:
Node 4 vertical displacement expression:
\( {disp_{4}}=\frac{1035}{{EA_{1}}}+\frac{404.338}{{EA_{2}}} \) (4)
Node 11 vertical displacement expression:
\( {disp_{11}}=\frac{900}{{EA_{1}}}+\frac{346.911}{{EA_{2}}} \) (5)
Assuming that the error in the measured values conforms to a normal distribution with a standard deviation of 2 mm, the likelihood function of the two nodes is established on this basis:
Node 4 likelihood function expression:
\( \frac{1}{\sqrt[]{2π}∙0.002}{е^{-0.5{(\frac{{disp_{4}}-0.1024}{0.02})^{2}}}} \) (6)
Node 11 likelihood function expression:
\( \frac{1}{\sqrt[]{2π}∙0.002}{е^{-0.5{(\frac{{disp_{11}}-0.0886}{0.02})^{2}}}} \) (7)
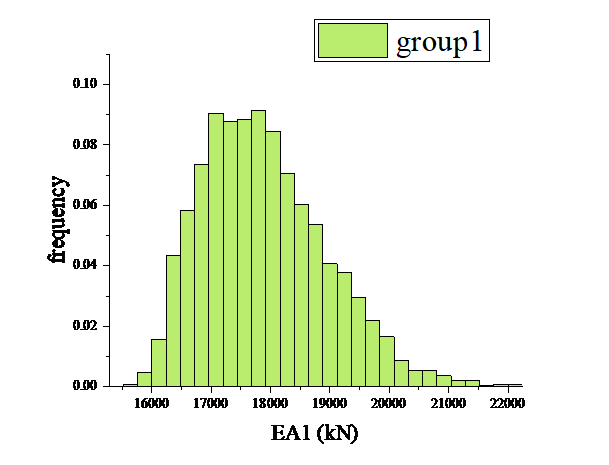
Multiple iterations of rejection sampling are run using the displacement information of node 4 to obtain a sufficient number of candidate samples that meet the prerequisites, which is required to be greater than 1000 accepted samples. The structural damage results are obtained as in Fig. 5, Fig. 6.
Figure 5: Updated results of the first test scenario EA1 |
Figure 6: Updated results of the first test scenario EA |
Comparing with the prior distribution set in the previous section, the data update that utilizes only one node's displacement information is effective. In order to seek for a better solution, so a second experimental scheme is proposed, Multiple repetitive runs of rejection sampling are performed using the displacement information of two nodes, node 4 and node 11. The structural damage results in Fig. 7,Fig 8 are obtained.
Figure 7: Results of the second pilot program EA1 update |
Figure 8: Results of the second pilot program EA2 update |
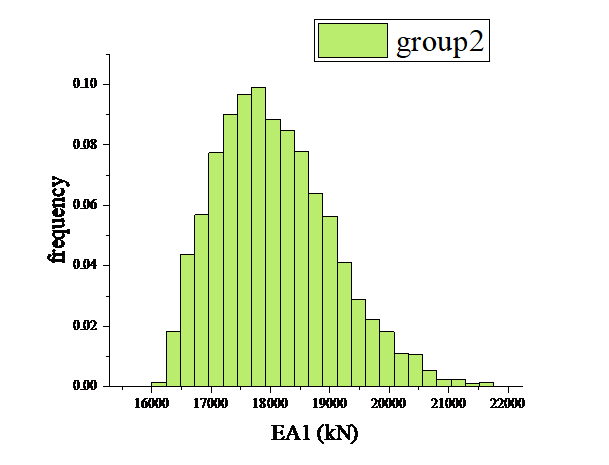
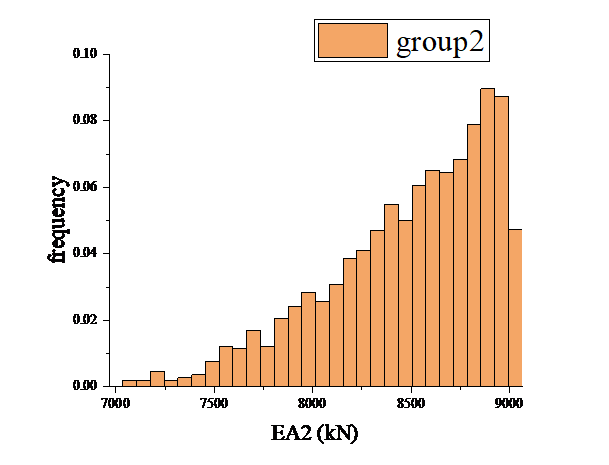
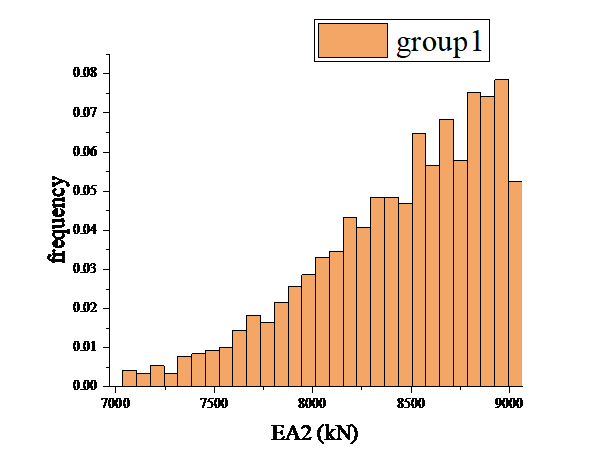
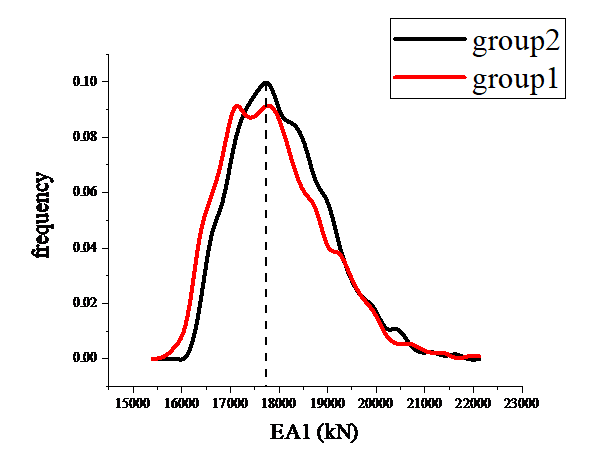
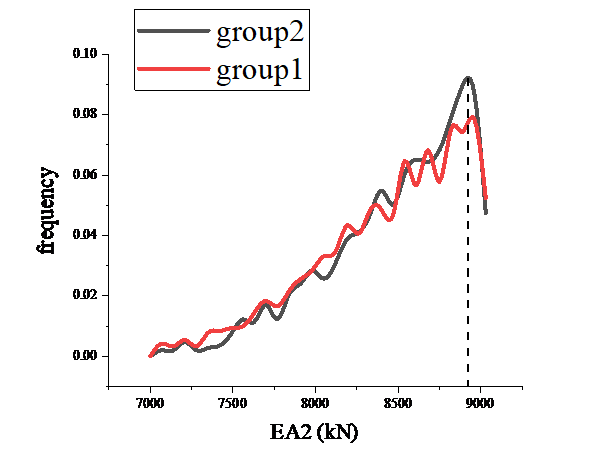
Comparing the EA1 values and EA2 values of the two test schemes are shown in Fig. 9 and Fig. 10, it can be found that there is a significant improvement in the updating results.
Figure 9: Results of the first and the second test scenario EA1 |
Figure 10: Results of the first and the second test scenario EA2 |
In order to further investigate whether the local modeling as well as the reduction of error can be effective for the a posteriori test, so the third test scheme is proposed. Similarly, the measured values of vertical displacements of 8 and node 9 were obtained as 77.675 mm and 82.557 mm, respectively, and the expressions for the displacements of the two points were obtained by utilizing the obtained internal forces based on the principle of virtual work:
Vertical displacement expression for node 8:
\( {disp_{8}}=\frac{337.5}{{EA_{1}}}+\frac{530.33}{{EA_{2}}} \) (8)
Horizontal displacement expression for node 9:
\( {disp_{9}}=\frac{637.5}{{EA_{1}}}+\frac{424.264}{{EA_{2}}} \) (9)
The errors in the measured values conform to a normal distribution with a standard deviation of 2 mm, on the basis of which the likelihood function of the two nodes is established:
Node 8 likelihood function expression:
\( \frac{1}{\sqrt[]{2π}∙0.001}{е^{-0.5{(\frac{{disp_{8}}-0.0777}{0.02})^{2}}}} \) (10)
Node 9 likelihood function expression:
\( \frac{1}{\sqrt[]{2π}∙0.001}{е^{-0.5{(\frac{{disp_{8}}-0.0825}{0.02})^{2}}}} \) (11)
Multiple repetitive runs of rejection sampling are performed using the displacement information of node 8 node 9 nodes. The structural damage results are obtained as in Fig. 11, Fig. 12.
Figure 11: EA1 update results for the third test scenario |
Figure 12: EA2 update results for the third test scenario |
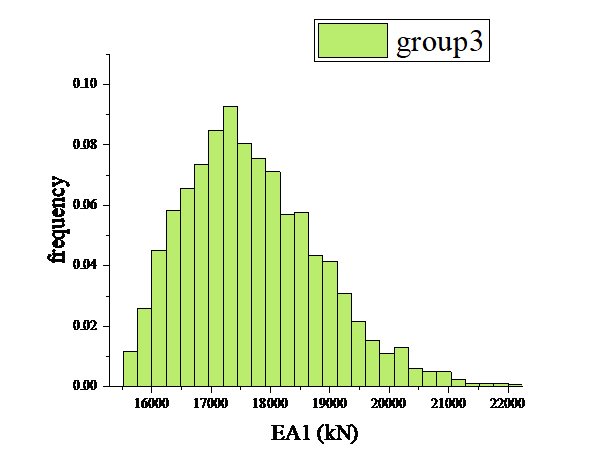
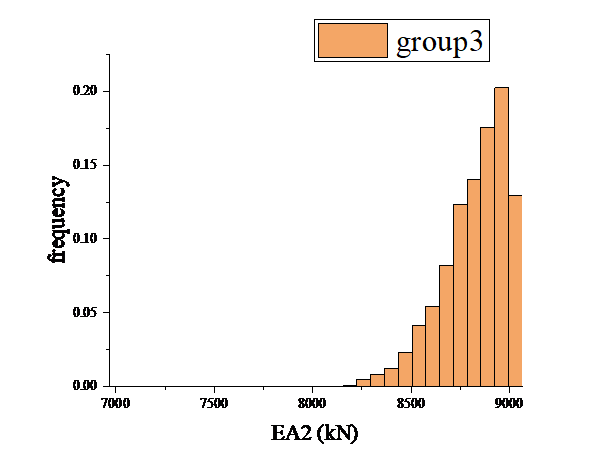
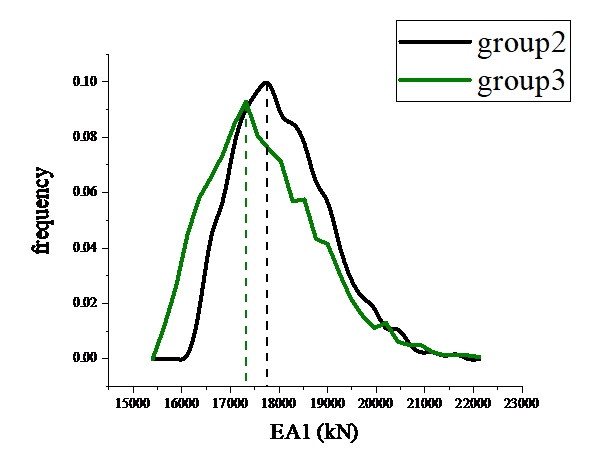
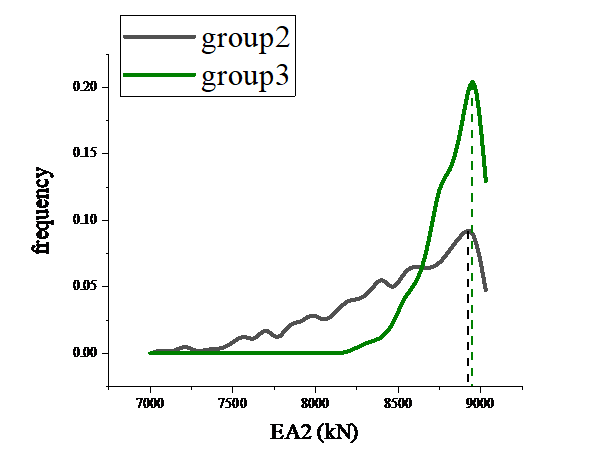
Comparing the EA1 and EA2 values of the second scheme with the third scheme as shown in Fig. 13, Fig. 14, it can be found that the third scheme is slightly less effective in updating the EA1 values compared to the third scheme, but the updating of the EA2 values is greatly improved.
Figure 13: Comparison results of the second and third test scenarios EA1 |
Figure 14: Comparison results of the second and third test scenarios EA2 |
3.2.2. Reliability analysis based on updating effects
A comparison of the reliability of the EA1 update results for the three groups of test protocols is shown in Table 1. The results show that Group 2 has the highest overall reliability, the best accuracy and the smallest systematic deviation, and medium precision. Group 1 had the best precision, but the accuracy and systematic deviation were slightly inferior to Group 2.
A comparison of the reliability of the EA2 update results for the three groups of test protocols is shown in Table 2 .The results show that Group 3 has the highest reliability, with the best performance in accuracy, precision and systematic deviation. Group 2 has the second highest reliability, slightly better precision than Group 1, but worse accuracy. Group 1 had the lowest reliability and the worst precision and systematic deviation.
Table 1: Comparison of reliability factors for EA1
Group Number | Reference Value(kN) | Mode (kN) | Relative Error | Mean Value | Standard Deviation | Variable Coefficient |
(1) | 18,000 | 17872.73 | 127.27 | 17957.42 | 1048.998 | 5.84% |
(2) | 18,000 | 17843.64 | 156.36 | 17778.01 | 975.739 | 5.49% |
(3) | 18,000 | 17314.54 | 685.45 | 17488.19 | 1147.401 | 6.56% |
Table 2: Comparison of reliability factors for EA2
Group Number | Reference Value(kN) | Mode (kN) | Relative Error | Mean Value | Standard Deviation | Variable Coefficient |
(1) | 9000 | 8969.70 | 30.3 | 8408.973 | 444.98 | 5.29% |
(2) | 9000 | 8947.27 | 52.73 | 8452.969 | 416.81 | 4.93% |
(3) | 9000 | 8978.70 | 21.3 | 8787.779 | 163.71 | 1.86% |
The above comparison results show that, when resources allow, multi-point displacement data updating is prioritized to improve the stability of the posterior distribution. If it is necessary to rely on single-point data, the measurement points with the strongest response to the target parameters should be selected through sensitivity analysis and supplemented with error correction modeling. The strategy of hybrid modeling, combining local modeling and global data calibration, to find the most suitable loading method and local modeling, and then updating the damage values of some rods by local modeling, can be implemented for efficient monitoring of specific damage areas and reduce the computational cost and data collection burden.
4. Conclusions
In order to seek the optimal measurement method of the damage value of truss bridges in actual engineering, this paper adopts a combination of theoretical analysis and numerical simulation, firstly assuming that the damage situation starts from the structural response of different loading situations, and then utilizing the rejection sampling method to carry out sampling calculations, so as to determine the a posteriori probability distribution of the structural parameters and the optimal estimation value. The results of the study are as follows:
(1) Comparing the first and the second experimental scenarios, it is found that: under the same loading method, although the selection of suitable single-node displacement data for updating can also obtain a more accurate damage estimation overall, its instability will be higher than the a posteriori results obtained from the multi-node displacement data, and the multi-node displacement data can show a better balance in the global parameter identification.
(2) Comparing the second and third experimental scenarios, it is found that the local modeling strategy needs to find the most appropriate loading method to avoid negative impacts on the updating of individual parameters. In practice, local modeling can be used for critical damage areas, while other parameters can be calibrated with global data to balance accuracy and reliability.
(3) The experimental process shows that the rejection sampling method can get good sampling results, but the efficiency of data sampling is low, so it is necessary to seek a more efficient sampling method to improve the efficiency of the rejection sampling method in subsequent research. The experiment only explores the validity of truss bridge structure in different experimental situations under actual engineering, and the study is still explorable for other civil engineering structures.
Authors contribution
All the authors contributed equally and their names were listed in alphabetical order.
References
[1]. Suarjana, A., & Sarungallo, R. (2024). Collapse of the Cincin Lama Bridge: A Case Study. Journal of Structural Safety, 34(1), 12-22. https://doi.org/10.1016/j.jss.2023.12.004
[2]. López, J., Martínez, M., & Sánchez, T. (2023). Structural Failure in Old Railway Warren Trusses: A Case Study in Europe. Engineering Failure Analysis,29,107-119. https://doi.org/10.1016/j.engfailanal.2023.03.005
[3]. Jiang Shaofei. Introduction to Structural Health Monitoring [ M ]. Beijing : Science Press, 2013.
[4]. Doebling S W, Farrar C R, Prime M B, et al. Damage identification and health monitoring of structural and mechanical systems from changes in their vibration characteristics: a literature review [R]. Los Alamos National Laboratory Report, LA-13070-MS, 1996.
[5]. Doebling S W, Farrar C R, Prime M B. A summary review of vibration-based damage identification methods[J]. Shock and vibration digest, 1998, 30(2): 91-105.
[6]. Sohn H, Farrar C R, Hemez F M, et al. A review of structural health monitoring literature: 1996-2001[M]. Los Alamos, NM: Los Alamos National Laboratory, 2004.
[7]. An, Y., Chatzi, E., Sim, S.H., & Laflamme, S. (2019). Recent progress and future trends on damage identification methods for bridge structures. Structural Control and Health Monitoring, 26(2), e2416. https://onlinelibrary.wiley.com/doi/abs/10.1002/stc.2416
[8]. Goi, Y., & Kim, C.W. (2023). Bridge Damage Detection Using Ambient Loads by Bayesian Hypothesis Testing. Structural Control and Health Monitoring,30(5),986061. https://onlinelibrary.wiley.com/doi/abs/10.1155/2023/7986061
[9]. Shi, D., Li, Z., & Demartino, C. (2024). Bayesian model updating of bio-based hybrid planar truss. Engineering Structures, 279, 114779. https://doi.org/10.1016/j.engstruct.2024.114779
[10]. Kwag, S., & Ju, B.S. (2020). Bayesian hierarchical model for structural identification. Engineering with Computers, 36(3), 621-638. https://doi.org/10.1007/S00366-019-00708-1
[11]. Fortuin, V. (2022). Priors in Bayesian deep learning: review.,90(3),391-408. https://onlinelibrary.wiley.com/doi/10.1111/insr.12502
[12]. Llorente, F., Martino, L., & Santiago, J.L. (2023). Marginal likelihood computation: a review. SIAM Review,
[13]. Jerez, D.J., Jensen, H.A., & Beer, M. (2022). Bayesian model updating with multiple uncertainties. Reliability Engineering & System Safety,229,108707. https://www.sciencedirect.com/science/article/pii/S095183202200271X
[14]. Yang, J.H., Liu, Z.Y., & Lam, H.F. (2023). MCMC-based Bayesian framework for system identification. Engineering Structures, 258, 114142. https://doi.org/10.1016/j.engstruct.2023.114142
[15]. Straub, D., & Papaioannou, I. (2015). Bayesian updating with structural reliability methods. Journal of Engineering Mechanics, 141(5), 04015005. https://mediatum.ub.tum.de/doc/1276569/document.pdf
[16]. Xiao, X., Li, Q., & Wang, Z. (2022). Adaptive importance sampling for Bayesian model updating. Structural Safety, 92, 101247. https://doi.org/10.1016/j.strusafe.2022.101247
Cite this article
Chen,Y.;Huang,D.;Liang,Y. (2025). Bayesian Updating-Based Health Monitoring of Warren Truss Structures. Applied and Computational Engineering,155,25-34.
Data availability
The datasets used and/or analyzed during the current study will be available from the authors upon reasonable request.
Disclaimer/Publisher's Note
The statements, opinions and data contained in all publications are solely those of the individual author(s) and contributor(s) and not of EWA Publishing and/or the editor(s). EWA Publishing and/or the editor(s) disclaim responsibility for any injury to people or property resulting from any ideas, methods, instructions or products referred to in the content.
About volume
Volume title: Proceedings of CONF-FMCE 2025 Symposium: Semantic Communication for Media Compression and Transmission
© 2024 by the author(s). Licensee EWA Publishing, Oxford, UK. This article is an open access article distributed under the terms and
conditions of the Creative Commons Attribution (CC BY) license. Authors who
publish this series agree to the following terms:
1. Authors retain copyright and grant the series right of first publication with the work simultaneously licensed under a Creative Commons
Attribution License that allows others to share the work with an acknowledgment of the work's authorship and initial publication in this
series.
2. Authors are able to enter into separate, additional contractual arrangements for the non-exclusive distribution of the series's published
version of the work (e.g., post it to an institutional repository or publish it in a book), with an acknowledgment of its initial
publication in this series.
3. Authors are permitted and encouraged to post their work online (e.g., in institutional repositories or on their website) prior to and
during the submission process, as it can lead to productive exchanges, as well as earlier and greater citation of published work (See
Open access policy for details).
References
[1]. Suarjana, A., & Sarungallo, R. (2024). Collapse of the Cincin Lama Bridge: A Case Study. Journal of Structural Safety, 34(1), 12-22. https://doi.org/10.1016/j.jss.2023.12.004
[2]. López, J., Martínez, M., & Sánchez, T. (2023). Structural Failure in Old Railway Warren Trusses: A Case Study in Europe. Engineering Failure Analysis,29,107-119. https://doi.org/10.1016/j.engfailanal.2023.03.005
[3]. Jiang Shaofei. Introduction to Structural Health Monitoring [ M ]. Beijing : Science Press, 2013.
[4]. Doebling S W, Farrar C R, Prime M B, et al. Damage identification and health monitoring of structural and mechanical systems from changes in their vibration characteristics: a literature review [R]. Los Alamos National Laboratory Report, LA-13070-MS, 1996.
[5]. Doebling S W, Farrar C R, Prime M B. A summary review of vibration-based damage identification methods[J]. Shock and vibration digest, 1998, 30(2): 91-105.
[6]. Sohn H, Farrar C R, Hemez F M, et al. A review of structural health monitoring literature: 1996-2001[M]. Los Alamos, NM: Los Alamos National Laboratory, 2004.
[7]. An, Y., Chatzi, E., Sim, S.H., & Laflamme, S. (2019). Recent progress and future trends on damage identification methods for bridge structures. Structural Control and Health Monitoring, 26(2), e2416. https://onlinelibrary.wiley.com/doi/abs/10.1002/stc.2416
[8]. Goi, Y., & Kim, C.W. (2023). Bridge Damage Detection Using Ambient Loads by Bayesian Hypothesis Testing. Structural Control and Health Monitoring,30(5),986061. https://onlinelibrary.wiley.com/doi/abs/10.1155/2023/7986061
[9]. Shi, D., Li, Z., & Demartino, C. (2024). Bayesian model updating of bio-based hybrid planar truss. Engineering Structures, 279, 114779. https://doi.org/10.1016/j.engstruct.2024.114779
[10]. Kwag, S., & Ju, B.S. (2020). Bayesian hierarchical model for structural identification. Engineering with Computers, 36(3), 621-638. https://doi.org/10.1007/S00366-019-00708-1
[11]. Fortuin, V. (2022). Priors in Bayesian deep learning: review.,90(3),391-408. https://onlinelibrary.wiley.com/doi/10.1111/insr.12502
[12]. Llorente, F., Martino, L., & Santiago, J.L. (2023). Marginal likelihood computation: a review. SIAM Review,
[13]. Jerez, D.J., Jensen, H.A., & Beer, M. (2022). Bayesian model updating with multiple uncertainties. Reliability Engineering & System Safety,229,108707. https://www.sciencedirect.com/science/article/pii/S095183202200271X
[14]. Yang, J.H., Liu, Z.Y., & Lam, H.F. (2023). MCMC-based Bayesian framework for system identification. Engineering Structures, 258, 114142. https://doi.org/10.1016/j.engstruct.2023.114142
[15]. Straub, D., & Papaioannou, I. (2015). Bayesian updating with structural reliability methods. Journal of Engineering Mechanics, 141(5), 04015005. https://mediatum.ub.tum.de/doc/1276569/document.pdf
[16]. Xiao, X., Li, Q., & Wang, Z. (2022). Adaptive importance sampling for Bayesian model updating. Structural Safety, 92, 101247. https://doi.org/10.1016/j.strusafe.2022.101247