


1. Introduction
Urban hearting island (UHI) is defined as an urban area which temperature is notably higher than surrounding rural areas which exists worldwide significantly. This phenomenon is mainly caused by development of urban infrastructure and changes in radiative and thermal properties. The following part will discuss about UHI effect in Tokyo and give some possible practical solutions to reduce urban heating island effect sustainable [1][2].
2. Basic information of Tokyo
Tokyo is the capital city of Japan. It has the largest population in the world which is over 37 million citizens. As the economic center of Japan, Tokyo is almost 30% of total population. The population density of Tokyo is around 6225 people per km2 but the total area is 2,194 km2. Besides the people living in Tokyo, another part of population is the people who work in Tokyo but live in surrounding areas which gives more pressure to Tokyo. Tokyo has 167 skyscrapers which taller than 150 meters, ranking top 10 in worldwide. Moreover, over 550 buildings in excess of 100 meters located in Tokyo, while more high-rises are under construction.
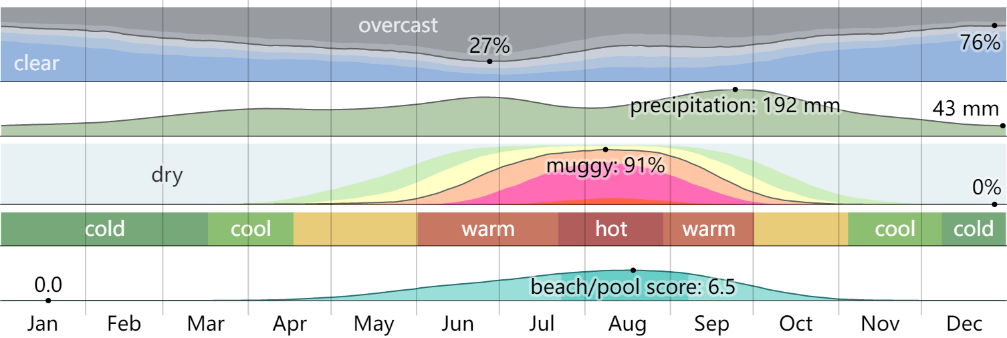
Figure 1 Climate in Tokyo [3]
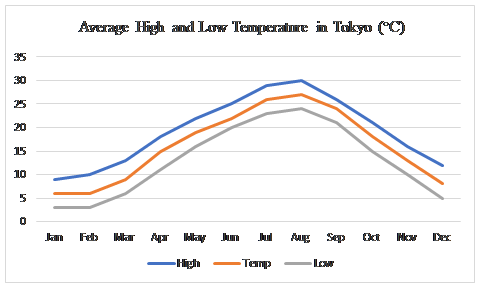
Figure 2 Average High and Low Temperature in Tokyo (data from Weatherspark.com)
Table 1 Average High and Low Temperature (°C) in Tokyo (data from Weatherspark.com)
Avg | Jan | Feb | Mar | Apr | May | Jun | Jul | Aug | Sep | Oct | Nov | Dec |
High | 9 | 10 | 13 | 18 | 22 | 25 | 29 | 30 | 26 | 21 | 16 | 12 |
Temp | 6 | 6 | 9 | 15 | 19 | 22 | 26 | 27 | 24 | 18 | 13 | 8 |
Low | 3 | 3 | 6 | 11 | 16 | 20 | 23 | 24 | 21 | 15 | 10 | 5 |
Figure 2 and table 1 give the average high and low temperature in a year. The hottest month is august with 27 °C as average temperature, and the coolest month is January with high temperature below 10 °C. Figure 3 indicated that urban area had higher average temperature than rural area which is the same as the definition of UHI.
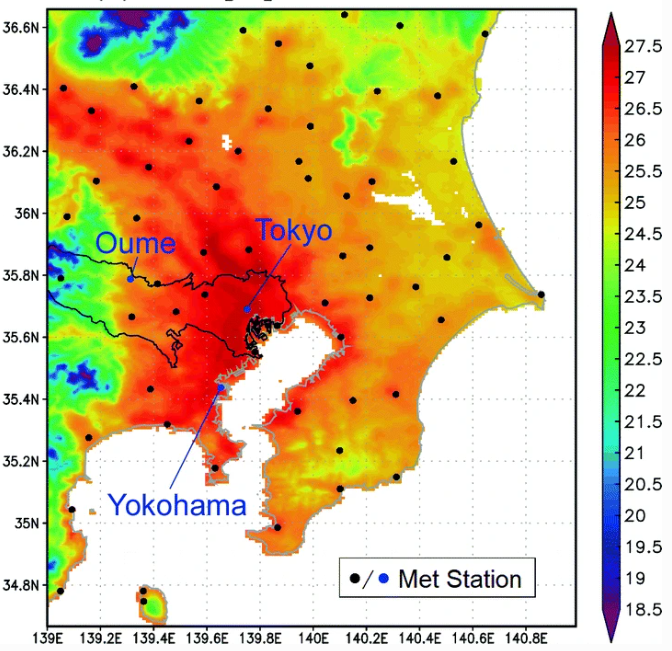
Figure 3 Distribution of average August temperature (1981-2010) [4]
The wind in Tokyo is quite mild which is in the interval from 11.3 km/h to 14.6km/h. Figure 4 shows the average wind speed at 10 meters above the ground all year round. Figure 5 shows average wind speed distribution at 50, 100, 150 and 200 meters above the ground in Tokyo, which color from blue to red means wind velocity from 0 to over 10 m/s.
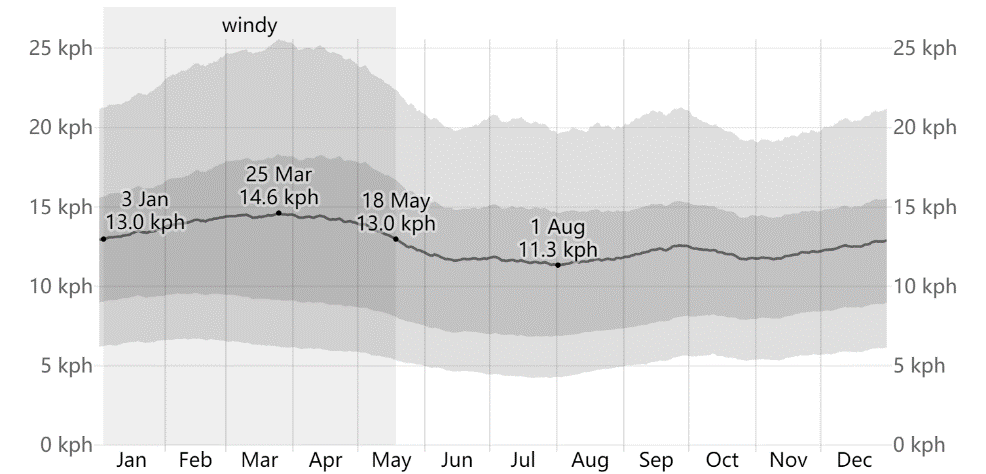
Figure 4 Average wind speed in Tokyo (10 m) (data from Weatherspark.com)
1 |
2 |
3 |
4 |
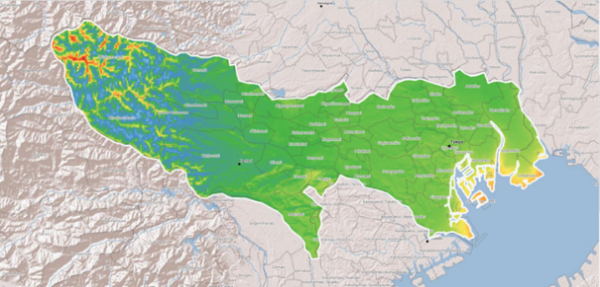
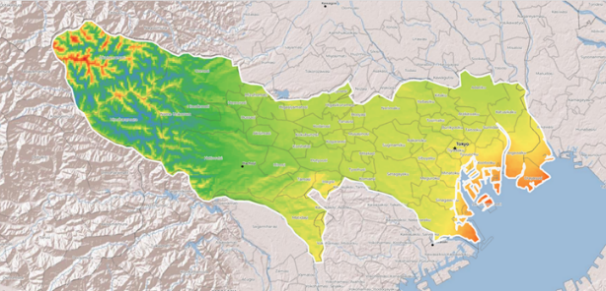
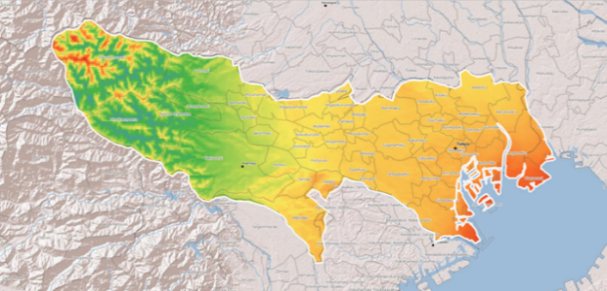
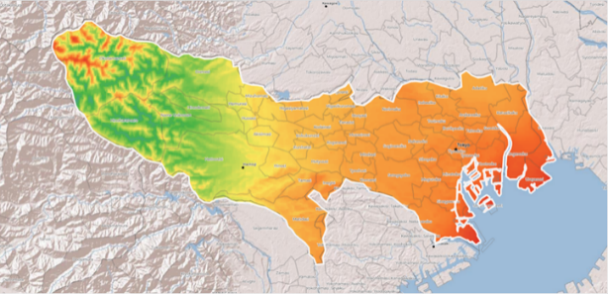
Figure 5 Mean wind velocity at different level (1-4: wind velocity at 50m, 100m, 150m and 200m) [5]
Green area in Tokyo only contains 7.5% of total area which gives 5.73 m2 per living citizen. As figure 6 shows, the green dots are allotment gardens (AGs) for residents.
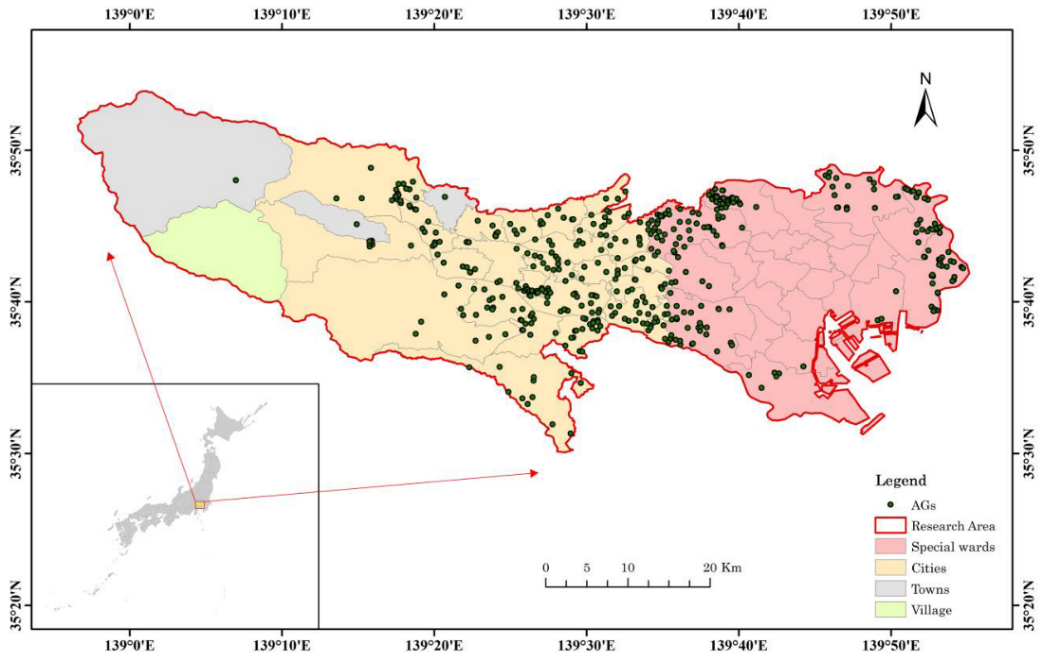
Figure 6 Green area in Tokyo [6]
3.Definition
Urban heating island happens when an urban area is much warmer than nearby rural areas. When constructing the city, asphalt, concrete and other building materials would replace vegetation to get prepared for growing population. Comparing to natural surface, these surfaces cover by building materials will not reflect sun’s heat, but absorb it, which would result in growing of temperature. Lacking trees and vegetation will reduce evapotranspiration which is supposed to help cool down naturally. Skyscrapers and narrow air space would reduce the air flow. Moreover, vehicles, factories, air conditioners and other heat generators would add more warmth to the city which increase the UHI effect. The maximum urban heating island effect would occur at evening which urban and rural areas has the largest temperature difference [7].
Furthermore, urban heat island is not only affected by local environment problems, but also affected by global. Global warming nowadays plays a significant role in local urban heat island effect while local urban heat island also exacerbates global warming.
4.Factors which contribute to this phenomenon
First of all, considering the number of high-rises in Tokyo, one of the most important reasons for urban heat island effect is that wind flow is blocked by these tall buildings. According to Perez, R. I. P. (2014) [8], during the first ten years of 21st century, there were more than 60% of total buildings in Tokyo over 150 meters. As mentioned above, the wind velocity is affected by these buildings, which is proved by the following table.
Table 2 Monthly mean wind speed at Tokyo WMO station in this decade (data from Japan Meteorological Agency)
Year | Jan | Feb | Mar | Apr | May | Jun | Jul | Aug | Sep | Oct | Nov | Dec | Annual |
2011 | 2.8 | 2.9 | 3.2 | 3.8 | 3.0 | 2.6 | 3.3 | 2.6 | 3.3 | 2.8 | 2.2 | 2.6 | 2.9 |
2012 | 2.7 | 2.9 | 3.1 | 3.2 | 3.3 | 3.0 | 3.1 | 3.2 | 3.0 | 2.8 | 2.7 | 2.8 | 3.0 |
2013 | 2.9 | 3.3 | 3.6 | 3.9 | 3.4 | 2.8 | 2.9 | 3.0 | 3.0 | 3.1 | 2.6 | 2.5 | 3.1 |
2014 | 2.8 | 3.3 | 3.5 | 3.1 | 3.4 | 2.6 | 2.8 | 3.2 | 2.6 | 2.7 | 2.5 | 2.5 | 2.9 |
2015 | 3.2 | 2.9 | 3.1 | 3.1 | 3.2 | 2.7 | 3.1 | 2.8 | 2.5 | 2.8 | 2.2 | 2.5 | 2.8 |
2016 | 2.4 | 2.9 | 2.8 | 3.3 | 3.4 | 2.9 | 2.7 | 3.1 | 2.4 | 2.4 | 2.5 | 2.6 | 2.8 |
2017 | 2.8 | 3.5 | 2.8 | 3.4 | 3.0 | 3.1 | 3.1 | 2.6 | 2.7 | 2.7 | 2.4 | 2.5 | 2.9 |
2018 | 2.6 | 2.6 | 3.0 | 3.5 | 3.3 | 3.2 | 3.5 | 3.5 | 3.0 | 2.6 | 2.1 | 2.6 | 3.0 |
2019 | 2.8 | 2.7 | 3.0 | 3.3 | 3.3 | 2.9 | 2.6 | 3.2 | 2.7 | 2.8 | 2.6 | 2.4 | 2.9 |
2020 | 2.4 | 2.7 | 3.1 | 3.2 | 3.1 | 2.8 | 3.1 | 2.8 | 2.9 | 2.4 | 2.5 | 2.1 | 2.8 |
2021 | 2.3 | 2.9 | 3.2 | 3.2 | 3.2 | 2.7 | 2.4 | 3.1 | 2.4 | 2.5 | 2.2 | 2.4 | 2.7 |
Secondly, one of the most used materials in buildings is concrete, which would hold the temperature inside the building with large thermal mass, giving city more heat than its capacity. Considering the materials used in building, most of them are dark and have low ability to reflect solar energy. Moreover, natural surfaces are covered by asphalt for different use such as roads and parking, which will absorb radiation and decrease infiltration. Given the large use of natural surfaces, vegetations may have no space so that provide less shade and less evapotranspiration. Also, with the increasing use of fuel cars and decreasing of trees, more carbon dioxide will stay in the air rather than absorbed by plants. Human activities could not be ignored. Fuel cars, industries ad air conditioners are three main extra heat providers, which gives more pressure to natural energy circle such as more carbon dioxide and air and water pollution. Furthermore, urban heat island and global warming could not be separated from each other which makes it a vicious cycle. According to Japan Meteorological Agency, the annual global mean surface temperature increased by 0.45 ºC in 2016 compared with the 1981-2010 average, while the mean surface temperature in Japan increased 0.88 ºC. Figure 7 shows the temperature change and prediction from 1890 to 2020 in Japan. It indicates that not only Tokyo but also whole Japan suffered serious climate change which intensified urban heating island effect.
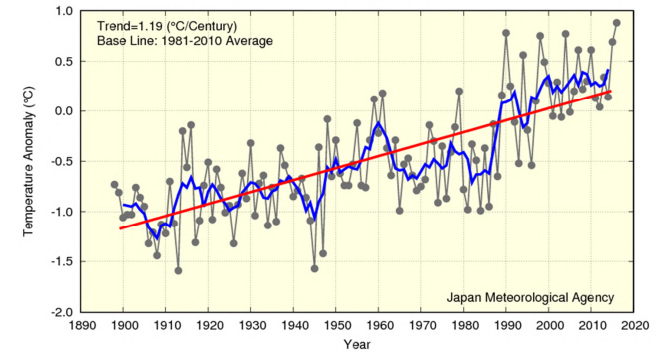
Figure 7 Annual Japan average temperature from 1890 to 2020 (data from Japan climate change monitoring report 2016)
Possible practical solutions
Firstly, encouraging real estate developers to paint their walls with light colors to provide more reflection of solar energy rather than absorbing. Secondly, promoting green energy transport methods to reduce emission of carbon dioxide. Thirdly, encouraging people to plant trees and vegetations on their roofs to provide urban canopies and more green area percentage. Furthermore, government could provide more heat reduction facilities such as water-spray applications in public area like bus stops to help take away heat.
Meanwhile, as mentioned above, urban heat island effect and global warming will impact each other, which means trying to reduce global warming will also reduce urban heat island effect. One of the most important areas of reducing global warming is to control the carbon balance.
Carbon balance is defined as the difference of amount of CO2 between photosynthesis and respiration. In nature, carbon balance is almost zero due to different plants. However, with the development of human activities, more green areas are taken to build different facilities for different use, and more carbon is emitted to air which is beyond the capacity of the remaining plants to absorb. One of the possible solutions is when building new constructions or rebuilding current ones, try to make them net carbon zero to limit carbon emissions. According to Voss et al. (2011) [9], net zero-energy building had become popular to indicate the synergy between “energy-efficient building and renewable energy utilization” to make balance in energy budget during an annual cycle. Ida et al. (2020) [10] pointed out that about one quarter of global carbon emissions is produced by construction sector, which gives it high potential to help with global warming. So that reducing carbon emissions in construction is globally accepted and effectively. Among all of the factors, materials are key to mitigating the embodied emissions of building [11]. For instance, wood should be put more use in building and rebuilding constructions. From previous research, wood is a perfect material to reduce carbon emissions because it can store carbon inside even after being made to products. Several studies have shown that increasing the amount of wood-based building materials is one of the most significant and effective ways of storing carbon above ground [12]. Through using woods in constructions, it will not only contribute to the mitigation on climate change but also help “reduce resource depletion caused by construction activities”. [13]. Moreover, wood used in construction could be reused after it finished its job as building material, such as recycled paper or other using. This is also a sustainable solution to solve global warming problem. In the past traditional Asian house is usually consisted of timber and other materials. For example, traditional Japanese building use wood and clay while traditional Chinese building only use timber which combined members together with specific technic, such as dougong structure.
Considering material performance, wood has better tensile strength compared with steel. It gives more spaces and fewer supports due to its lightweight and the ability to support itself better. Moreover, wood has very good structural performance and it has similar compressive strength with concrete [14]. Combined with its capability to store carbon, wood should be taken into consideration in the future.
When operating such global environmental activities, financial is always a huge problem which means the more money put into use, the more apparent and numerous results will be given. However, with some renewable materials like wood, it makes environment protection and finance a win-win situation, which will give government more confident to help protect environment.
6.Conclusion
In all, this study provides basic information of Tokyo, and based on these to analysis the causes of urban heat island effect in Tokyo. Secondly, some possible solutions to reduce this phenomenon are given from angles of citizens, real estate developers and government. Finally, global warming should also be focused on at the same time in sustainable and economical way so that government could have more confidence in solving it. In the future, environment problems should be given more attention which will benefit in humanity, economic and next generation.
References
[1]. O'Malley, C. and Kikumoto, H. (2022) “An investigation into heat storage by adopting local climate zones and nocturnal-diurnal urban heat island differences in the Tokyo prefecture,” Sustainable Cities and Society, 83, p. 103959. Available at: https://doi.org/10.1016/j.scs.2022.103959.
[2]. Hirano, Y. and Fujita, T. (2012) “Evaluation of the impact of the urban heat island on residential and commercial energy consumption in Tokyo,” Energy, 37(1), pp. 371–383. Available at: https://doi.org/10.1016/j.energy.2011.11.018.
[3]. Weatherspark.com Tokyo Climate, Weather By Month, Average Temperature (Japan) - Weather Spark. Available at: https://weatherspark.com/y/143809/Average-Weather-in-Tokyo-Japan-Year-Round (Accessed: December 19, 2022).
[4]. Yamaguchi, K. and Ihara, T. (2020) “Countermeasures to urban heat island considering urban energy usage,” in Building in Hot and Humid Regions. Singapore: Springer Singapore, pp. 15–57. Available at: https://doi.org/10.1007/978-981-13-7519-4_2.
[5]. Global Wind Atlas. Available at: https://globalwindatlas.info/en (Accessed: October 17, 2022).
[6]. Zheng, H. et al. (2022) “Provision of allotment gardens and its influencing factors: A case study of Tokyo, Japan,” Land, 11(3), p. 333. Available at: https://doi.org/10.3390/land11030333.
[7]. Urban heat island, National Geographic Society. Available at: https://education.nationalgeographic.org/resource/urban-heat-island (Accessed: October 23, 2022).
[8]. Perez, R. I. P. (2014) “The historical development of the Tokyo skyline: Timeline and morphology,” Journal of Asian architecture and building engineering, 13(3), pp. 609–615. Available at: https://doi.org/10.3130/jaabe.13.609.
[9]. Voss, K., Musall, E. and Lichtmeß, M. (2011) “From low-energy to net zero-energy buildings: Status and Perspectives,” Journal of Green Building, 6(1), pp. 46–57. Available at: https://doi.org/10.3992/jgb.6.1.46.
[10]. Karlsson, I., Rootzén, J. and Johnsson, F. (2020) “Reaching net-zero carbon emissions in construction supply chains – analysis of a swedish road construction project,” Renewable and Sustainable Energy Reviews, 120, p. 109651. Available at: https://doi.org/10.1016/j.rser.2019.109651.
[11]. Pomponi, F. et al. (2020) “Buildings as a global carbon sink? A reality check on feasibility limits,” One Earth, 3(2), pp. 157–161. Available at: https://doi.org/10.1016/j.oneear.2020.07.018.
[12]. Arehart, J.H. et al. (2021) “Carbon sequestration and storage in the built environment,” Sustainable Production and Consumption, 27, pp. 1047–1063. Available at: https://doi.org/10.1016/j.spc.2021.02.028.
[13]. Piccardo, C. and Hughes, M. (2022) “Design strategies to increase the reuse of wood materials in buildings: Lessons from architectural practice,” Journal of Cleaner Production, 368, p. 133083. Available at: https://doi.org/10.1016/j.jclepro.2022.133083.
[14]. Carigliano, S. (2022) Steel vs timber vs concrete: Skyciv engineering, SkyCiv Cloud Structural Analysis Software | Cloud Structural Analysis Software and Calculators. SkyCiv Engineering. Available at: https://skyciv.com/technical/steel-vs-timber-vs-concrete/ (Accessed: October 23, 2022).
Cite this article
Zong,C. (2023). Analysis of urban heating island effect in Tokyo and sustainable solution. Applied and Computational Engineering,7,302-309.
Data availability
The datasets used and/or analyzed during the current study will be available from the authors upon reasonable request.
Disclaimer/Publisher's Note
The statements, opinions and data contained in all publications are solely those of the individual author(s) and contributor(s) and not of EWA Publishing and/or the editor(s). EWA Publishing and/or the editor(s) disclaim responsibility for any injury to people or property resulting from any ideas, methods, instructions or products referred to in the content.
About volume
Volume title: Proceedings of the 3rd International Conference on Materials Chemistry and Environmental Engineering (CONF-MCEE 2023), Part II
© 2024 by the author(s). Licensee EWA Publishing, Oxford, UK. This article is an open access article distributed under the terms and
conditions of the Creative Commons Attribution (CC BY) license. Authors who
publish this series agree to the following terms:
1. Authors retain copyright and grant the series right of first publication with the work simultaneously licensed under a Creative Commons
Attribution License that allows others to share the work with an acknowledgment of the work's authorship and initial publication in this
series.
2. Authors are able to enter into separate, additional contractual arrangements for the non-exclusive distribution of the series's published
version of the work (e.g., post it to an institutional repository or publish it in a book), with an acknowledgment of its initial
publication in this series.
3. Authors are permitted and encouraged to post their work online (e.g., in institutional repositories or on their website) prior to and
during the submission process, as it can lead to productive exchanges, as well as earlier and greater citation of published work (See
Open access policy for details).
References
[1]. O'Malley, C. and Kikumoto, H. (2022) “An investigation into heat storage by adopting local climate zones and nocturnal-diurnal urban heat island differences in the Tokyo prefecture,” Sustainable Cities and Society, 83, p. 103959. Available at: https://doi.org/10.1016/j.scs.2022.103959.
[2]. Hirano, Y. and Fujita, T. (2012) “Evaluation of the impact of the urban heat island on residential and commercial energy consumption in Tokyo,” Energy, 37(1), pp. 371–383. Available at: https://doi.org/10.1016/j.energy.2011.11.018.
[3]. Weatherspark.com Tokyo Climate, Weather By Month, Average Temperature (Japan) - Weather Spark. Available at: https://weatherspark.com/y/143809/Average-Weather-in-Tokyo-Japan-Year-Round (Accessed: December 19, 2022).
[4]. Yamaguchi, K. and Ihara, T. (2020) “Countermeasures to urban heat island considering urban energy usage,” in Building in Hot and Humid Regions. Singapore: Springer Singapore, pp. 15–57. Available at: https://doi.org/10.1007/978-981-13-7519-4_2.
[5]. Global Wind Atlas. Available at: https://globalwindatlas.info/en (Accessed: October 17, 2022).
[6]. Zheng, H. et al. (2022) “Provision of allotment gardens and its influencing factors: A case study of Tokyo, Japan,” Land, 11(3), p. 333. Available at: https://doi.org/10.3390/land11030333.
[7]. Urban heat island, National Geographic Society. Available at: https://education.nationalgeographic.org/resource/urban-heat-island (Accessed: October 23, 2022).
[8]. Perez, R. I. P. (2014) “The historical development of the Tokyo skyline: Timeline and morphology,” Journal of Asian architecture and building engineering, 13(3), pp. 609–615. Available at: https://doi.org/10.3130/jaabe.13.609.
[9]. Voss, K., Musall, E. and Lichtmeß, M. (2011) “From low-energy to net zero-energy buildings: Status and Perspectives,” Journal of Green Building, 6(1), pp. 46–57. Available at: https://doi.org/10.3992/jgb.6.1.46.
[10]. Karlsson, I., Rootzén, J. and Johnsson, F. (2020) “Reaching net-zero carbon emissions in construction supply chains – analysis of a swedish road construction project,” Renewable and Sustainable Energy Reviews, 120, p. 109651. Available at: https://doi.org/10.1016/j.rser.2019.109651.
[11]. Pomponi, F. et al. (2020) “Buildings as a global carbon sink? A reality check on feasibility limits,” One Earth, 3(2), pp. 157–161. Available at: https://doi.org/10.1016/j.oneear.2020.07.018.
[12]. Arehart, J.H. et al. (2021) “Carbon sequestration and storage in the built environment,” Sustainable Production and Consumption, 27, pp. 1047–1063. Available at: https://doi.org/10.1016/j.spc.2021.02.028.
[13]. Piccardo, C. and Hughes, M. (2022) “Design strategies to increase the reuse of wood materials in buildings: Lessons from architectural practice,” Journal of Cleaner Production, 368, p. 133083. Available at: https://doi.org/10.1016/j.jclepro.2022.133083.
[14]. Carigliano, S. (2022) Steel vs timber vs concrete: Skyciv engineering, SkyCiv Cloud Structural Analysis Software | Cloud Structural Analysis Software and Calculators. SkyCiv Engineering. Available at: https://skyciv.com/technical/steel-vs-timber-vs-concrete/ (Accessed: October 23, 2022).