


1. Introduction
Currently, Daul-Pilot Operation (DPO) is the main piloting mode adopted by civil airliners. Considering the global lack of pilots due to the gradual congestion of airspace and the pursuit of lower operating costs by airlines, National Aeronautics and Space Administration (NASA) has systematically proposed the Single-Pilot Operation (SPO) model, in which pilots collaborate with cockpit automation systems and ground-based airline controllers [1]..
In the Single-Pilot Operation (SPO) mode, in order to ensure flight safety, specific systems need to implement function allocation based on the pilot's workload, driving status, and physical status. Therefore, NASA proposes Standard Operating Procedure (SOP) based workload assessment in the Single-Pilot Operation (SPO) mode, and the assessment of the workload needs to be preceded by a high-accuracy real-time detection of the pilot's behavior, and then based on the SOP, the workload is assessed by the pilot's behavior. The assessment of workload requires a high-precision real-time detection of the pilot's behavior, and then based on the SOP to determine whether the pilot is in a normal physical state and whether to comply with the driving regulations [2]. Different SOPs for pilot workload assessment correspond to different assessment criteria, but the assessment methods are common and can be applied to both SOP and DPO flights.
In order to achieve high-precision real-time detection of pilot behavior, this study uses a behavior recognition model by fusing multi-source heterogeneous behavioral data to detect pilot behavior, which is a special behavior of a special object in a special scenario, and analyzes the performance of the model. Currently, there is a lack of pilot behavior detection algorithms based on the fusion of multi-source heterogeneous data for pilot workload assessment worldwide, so the significance of this research is to provide theoretical support for the workload assessment under the Single-Pilot model based on SOP proposed by NASA, and to help China's civil aviation industry to transition to unmanned pilots.
2. Analysis of the current state of research
2.1. Pilot workload assessment
The main assessment methods for pilots' workload include: performance assessment based on error or expert assessment, subjective assessment based on questionnaires, and objective assessment based on sensors. Regarding subjective assessment methods, K. Mohanavelu et al. utilized scales to assess pilots' loads and workloads, which are simple and reliable but do not provide real-time assessment [3]. Regarding performance assessment methods, Xiaodong Cao et al. and Andrea Alaimo et al. used examiners and corresponding indices to assess pilot tasks [4-5]. This method can assess workload more accurately compared to subjective measurements, but it is difficult to achieve real-time detection. Regarding objective assessment methods, Michael Wagner et al. assessed pilot workload through sensors, which is real-time but lacks generalizability [6]. Compared to the above methods SOP-based pilot workload assessment provides a more standardized and time-sensitive method.
2.2. Pilot behavior data acquisition
The main sources of pilot behavioral data include: wearable physiological sensors, Quick Access Recorder (QAR), and visual sensors. In terms of wearable physiological sensors, Li Yuhan et al. used physiological sensors to collect physiological indicators [7]. This method has high accuracy, but the wearable sensor has the defects of affecting the pilot's range of motion, distracting the pilot's attention, and having low measurement accuracy. In terms of QAR, Wang Lei et al. used QAR to achieve quantitative calculation of unsafe pilot behavior [8]. This approach improves the mining of QAR data information, but suffers from the shortcomings of low recognition accuracy and recognition time lag. In terms of visual sensors, Yu Shen et al. installed multiple cameras in the cabin to collect RGB-D data [9]. The data collected by this method can realize the real-time reflection of real and accurate pilot behavior within the computer.
2.3. Multi-source heterogeneous data fusion
Compared with single-source data, multi-source heterogeneous data can be reasonably processed and fused to describe the research object more comprehensively and accurately. Multi-source heterogeneous data are widely used in the field of computer vision, which can be categorized into pixel-level fusion, feature-level fusion and decision-level fusion according to the fusion stage. In terms of pixel-level fusion, Mrityunjay Kumar et al. proposed a full-variable regularization framework for pixel-level fusion of multi-type images [10]. This method can effectively fuse complementary information between different data, but the noise in the data is more likely to be fused directly. In terms of feature-level fusion, Yan Shengli et al. proposed that RGB and depth images are subjected to feature extraction and feature fusion by means of a two-stream convolutional neural network and a multimodal feature fusion module [11]. This method reduces the amount of data, but is prone to the defect of inaccurate feature extraction. For decision-level fusion, Yao Jun et al. fused the detection results with an object detection model [12]. This method provides more accurate detection results than a single data source, but lacks the direct utilization of complementary information between data.
2.4. Behavioral detection methods
Currently, behavioral detection is mainly realized by neural network models using collected information such as vision, speech, and text. The YOLO series, a one-stage detection model based on visual information, has a faster detection speed than a two-stage detection model, and thus is widely used in fields which requires fast detection. Haiwei Chen et al. used the improved YOLOv8 to study student classroom behavior detection and improved the average accuracy in multi-density and occlusion scenarios [13]. Mingyang Li et al. proposed a smoking behavior detection model based on YOLOv8 and transfer learning to improve the real-time and accuracy of smoking behavior detection [14].
3. A heterogeneous data processing approach based on typical pilot behavior
3.1. Typical pilot operational behavior data sources
The dataset used in this study is the APA dataset captured by Yu Shen et al. in the Level D simulator environment of 737MAX using the Intel Real Sense D435i camera, which contains multimodal data of 32 typical pilot maneuvers [5]. In this study, among them,pilot control column and thrust levers behavior data are selected, and the study is carried out based on two kinds of heterogeneous data, namely, RGB images and depth images.
3.2. Pre-processing of typical pilot behavior data
3.2.1. Data labeling
The RGB images in the pilot manipulation behavior data were batch labeled using the labeling software Labelme with 1 bounding box and 17 keypoint, including nose, left eye, right eye, left ear, right ear, left shoulder, right shoulder, left elbow, right elbow, left wrist, right wrist, left hip, right hip, left knee, right knee, left ankle, right ankle. The occluded keypoint was labeled based on the empirical judgment for labeling, as shown in Figure 1.

3.2.2. Pixel-level weighted fusion of RGB images with depth images
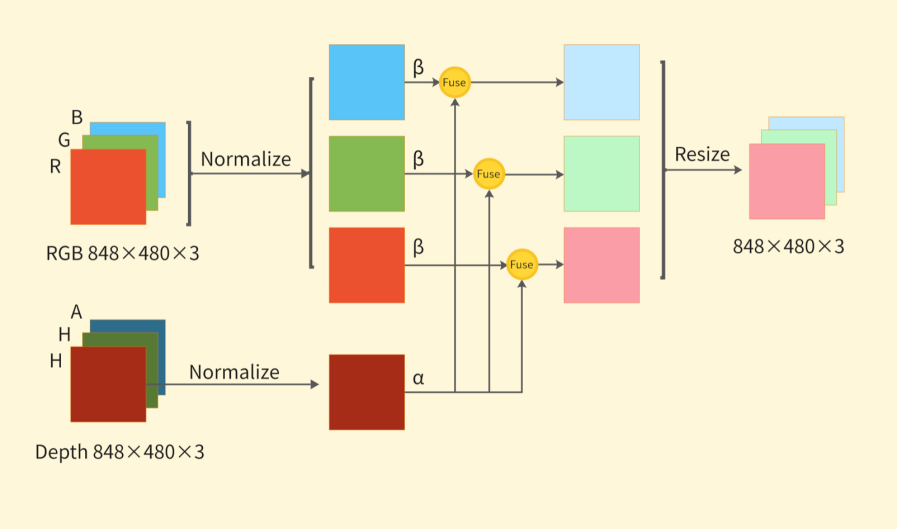
The Labelme format data is converted to YOLO format data, and the specific operations include coordinate normalization, adding category labels and visibility labels. Perform pixel-level weighted fusion of RGB image and depth image as shown in Figure 2. The specific process is as follows:
1) Align the dimensions of RGB image and depth image;
2) The R channel of the color-coded depth image, which is less affected by noise, is selected and normalized with the pixel values of the three RGB channels:
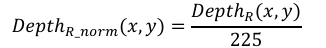 (1)
(1)
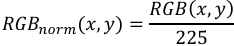 (2)
(2)
3) Weighted fusion of the three RGB channels with the Horizontal Disparity channel respectively;
4) The fusion result is scaled to the range of 0-225 and saved as a three-channel JPG image.
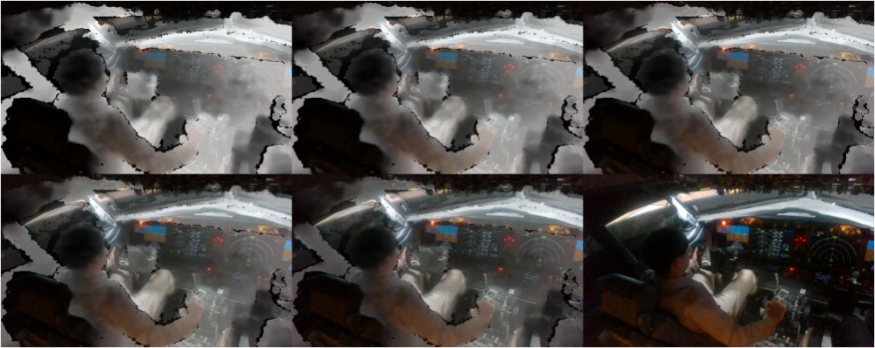
In order to effectively utilize the complementary information of the two kinds of data and suppress the redundant information, six groups of fusion data with different weights are generated so that the weights that make the model detection accuracy the highest can be obtained through experiments. The weight combinations are shown in Table 1 and the fusion diagram is shown in Figure 3.
|
α(RGB) |
0.3 |
0.4 |
0.5 |
0.6 |
0.7 |
1.0 |
|
β(Depth) |
0.7 |
0.6 |
0.5 |
0.4 |
0.3 |
0 |
3.3. Data analysis of typical pilot operational behavior
Analysis of the data revealed that:
1) The pilot's behavior in manipulating the joystick was mainly a large movement of the left elbow and left wrist, and the joystick manipulation was mainly a large movement of the right elbow and right wrist, while the rest of the keypoint remained basically unchanged;
2) During the whole maneuvering process, more than 50% of the key points are blocked by cockpit facilities or other parts of the pilot.
Therefore, the use of the attitude estimation model trained on the common life scene as a dataset to detect the pilot's behavior may have low accuracy, which will be verified by experiments in the subsequent part of this paper
3.4. Training dataset composition
Due to the Single-Pilot attitude change in a single behavioral data, training with one behavioral data alone may suffer from overfitting or poor generalization over other behavioral data, so the dataset in this study mixes pilot manipulation of the joystick behavioral data with pilot manipulation of the thrust handle behavioral data. In addition, according to the original dataset has the characteristics of scene fixation and small magnitude of attitude change, so the required features can be learned by applying the appropriate data volume model. The final training dataset is composed as follows: 921 images for the training set, 142 images for the validation set, and 50 images for the test set, distributed in a ratio of approximately 18:3:1.
4. Pilot behavior detection based on the YOLOv8-pose model
4.1. YOLOv8-pose detector model
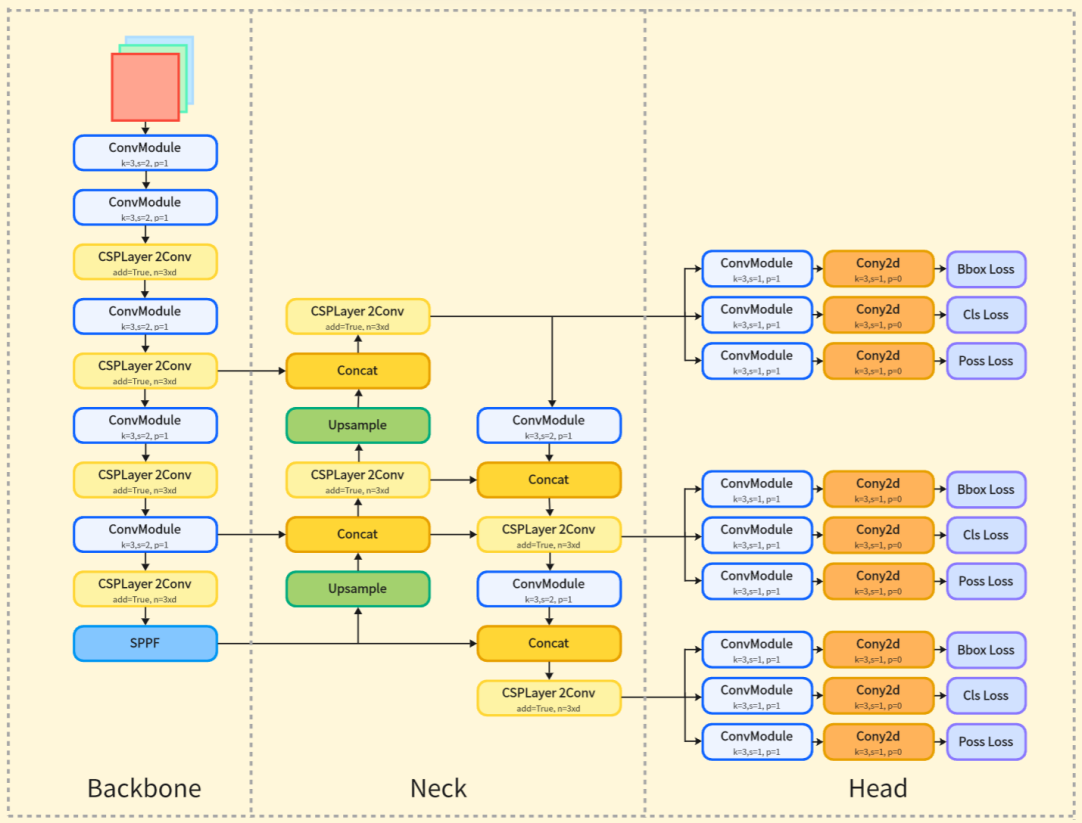
YOLOv8 is a typical one-stage detection model, which implemented better balance between speed and accuracy . Its network structure consists of three parts: backbone, neck, and head. backbone network extracts multilevel features from three-channel images based on EfficientNet, neck fuses features from backbone across scales based on NAS-FPN, and head decouples the multilevel fused features to output the category probability and bounding box coordinates and their confidence [15].YOLOv8-pose model adds the output of keypoint coordinates on the basis of YOLOv8 head, and the network structure is shown in Figure 4.
4.2. Pilot behavior detection method based on pixel-level weighted fusion
4.2.1. Training process
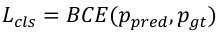
The fused three-channel JPG image is first preprocessed through resolution adjustment and pixel value normalization. It is then fed into the model, where the backbone performs feature extraction, followed by the neck for cross-scale feature fusion. Finally, the head outputs keypoints, classification, and bounding box branches in parallel, and the composite loss function is computed as follows:
 (3)
(3)
where λ is the loss weight.
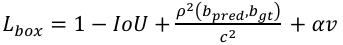 (4)
(4)
where IoU denotes the intersection and concurrency ratio of the predicted frame to the real frame,
 (5)
(5)
where
 (6)
(6)
Where t denotes the true coordinate value,
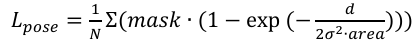 (7)
(7)
where d denotes the squared Euclidean distance between the predicted keypoint and the true keypoint, σ denotes the standard deviation corresponding to the keypoint type, area denotes the area of the target box, and mask denotes the keypoint visibility mask.
 (8)
(8)
where
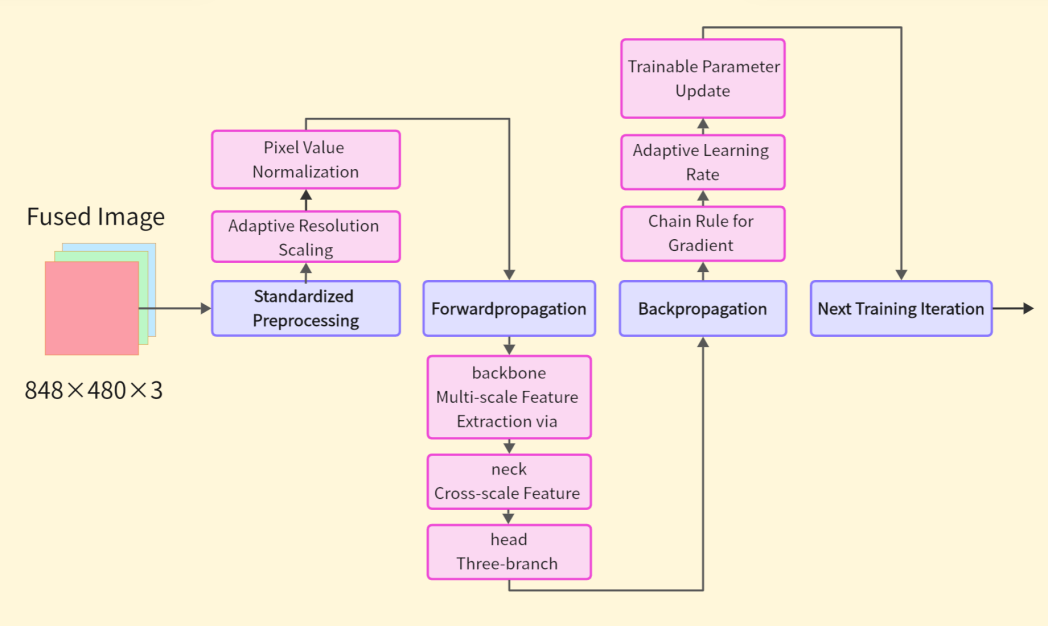
Then, backpropagation is performed to calculate the gradient of the loss to the trainable parameters, combined with the adaptive learning rate, the trainable parameters are updated by the gradient descent method, and the training flow is shown in Figure 5.
Hyperparameters need to be adjusted before training, including learning rate and its related parameters, data enhancement, training strategy. The following is the basis for adjustment:
1) Adaptive learning rate: The initial learning rate (lr0) is finally selected as 0.001 through three experiments, which can make the loss decrease steadily, and the cosine learning rate scheduler (cos_lr) is enabled to update the learning rate to prevent convergence oscillation:
 (9)
(9)
where
Enable the AdamW optimizer for parameter updates to prevent overfitting:
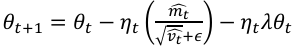 (10)
(10)
Where
2) Data Enhancement: Simulate the change of lighting conditions in the cockpit, and enhance the size of hue enhancement (hsv_h), saturation enhancement (hsv_s) and brightness enhancement (hsv_v). Simulate changes in camera angles by slightly increasing the size of the random rotation angle range (degrees), the random image translation scale (translate), and the perspective transformation intensity (perspective). Simulate the possible scenario of detecting pilots in different cockpit seats by enabling the horizontal flip probability (fliplr). During the detection process, the cockpit scene and the position of the pilot are usually more fixed, so the channel BGR order adjustment probability (bgr), vertical flip probability (flipud), and MixUp data enhancement strength (mixup) are disabled to prevent data distortion.
3) Training strategy: epochs is set to 40, batch Size is set to 32, and Patience is set to 8, which can avoid overfitting or underfitting.
The specific parameter values are shown in Table 2.
|
The basis for tuning the parameter |
Parameter name |
Worth |
|
Stabilizes loss reduction, learning rate adaptive |
lr0 |
0.001 |
|
cos_lr |
True |
|
|
optimizer |
AdamW |
|
|
Simulate changes in cockpit lighting conditions |
hsv_h |
0.06 |
|
hsv_s |
0.8 |
|
|
hsv_v |
0.9 |
|
|
Simulate changes in camera angle |
degrees |
5 |
|
translate |
0.2 |
|
|
perspective |
0.001 |
|
|
Simulates detection of pilots in different cockpit positions |
fliplr |
0.3 |
|
Prevent data distortion |
bgr |
0 |
|
flipud |
0 |
|
|
MixUp |
0 |
|
|
Avoid overfitting or underfitting |
epochs |
40 |
|
batch Size |
32 |
|
|
patience |
8 |
4.2.2. Testing process
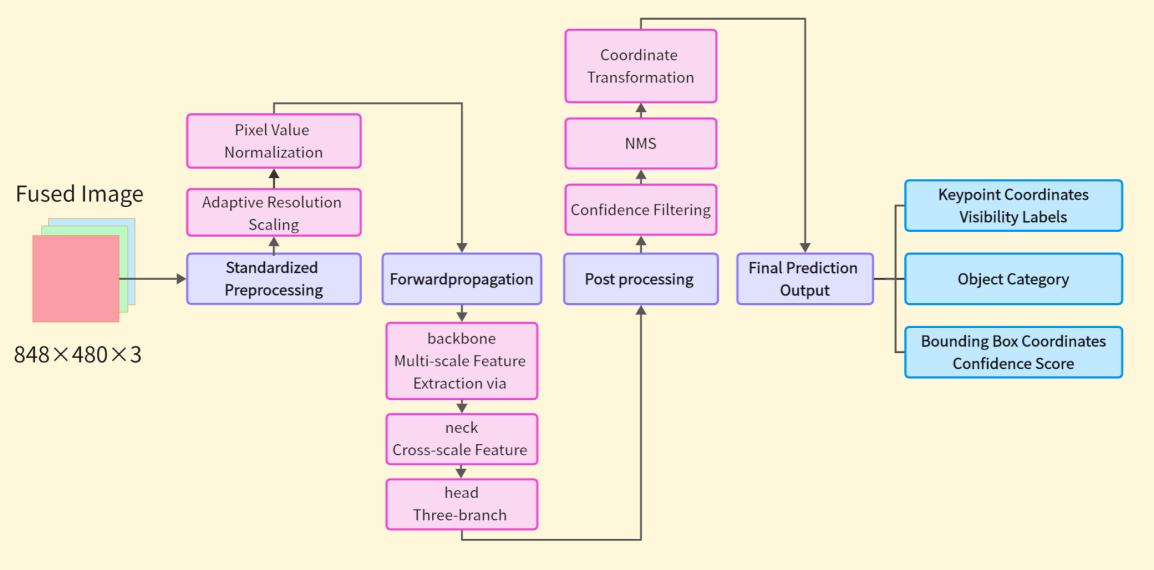
The image to be detected is input into the detection model, preprocessed, and then forward propagated, after feature extraction and cross-scale feature fusion, the keypoint, classification, and bounding box prediction results are output, and then post-processed, through Confidence Thresholding (predict_conf=0.25,val_conf=0.001) and Non-Maximum Suppression (iou=0.7), filter out the results with high confidence and suppress the results with high overlap with them, and finally perform coordinate transformation to output the prediction results, the detection process is shown in Figure 6.
4.2.3. Assessment of indicators
In order to quantitatively evaluate the detection accuracy and detection speed of the models trained by fusing data with different weights, we apply the Mean Average Precision (mAP) and the Frames Per Second (FPS) as evaluation metrics:
Precision: the proportion of true positive samples that are predicted as positive by the model:
 (11)
(11)
where TP denotes true positives and FP denotes false positives.
Recall: the proportion of true positives that are correctly predicted by the model.
 (12)
(12)
where FN indicates false negative.
Average Precision (AP): assay performance measured by the area of the precision-recall curve at different confidence thresholds.
 (13)
(13)
where P denotes Precision and r denotes Recall.
Mean Average Precision (mAP): The average of the APs computed for the pose estimation task. mAP@0.5:0.95 denotes the mean mAP of IoU thresholds from 0.5 to 0.95 strictly and comprehensively reflects the model's ability to detect:.
 (14)
(14)
Frames Per Second (FPS): indicates the number of complete images that the model can process per second, reflecting the speed of detection:
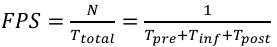 (15)
(15)
where
4.2.4. Experimental environment
The hardware environment for the training process in this study is: AMD Ryzen 7 5800H with Radeon Graphics CPU, the software environment is: python-3.10.0, torch-2.7.0+cpu; the hardware environment for the detection process is: NVIDIA GeForce RTX 3060 GPU, the software environment is: Python-3.10.16, torch-2.5.1+cu121. YOLOv8m-pose, which has a good balance of detection speed and accuracy, was used as the pre-training model for training.
4.3. Typical pilot operational behavior data simulation and performance analysis
4.3.1. Training results and analysis
In this study, the fusion graph of 6 weights is trained with a minimum change threshold min_delta=0, the counter is triggered when the current metrics are not at their historical best, and the training is automatically stopped when val_loss or mAP does not improve significantly for more than 8 epochs.
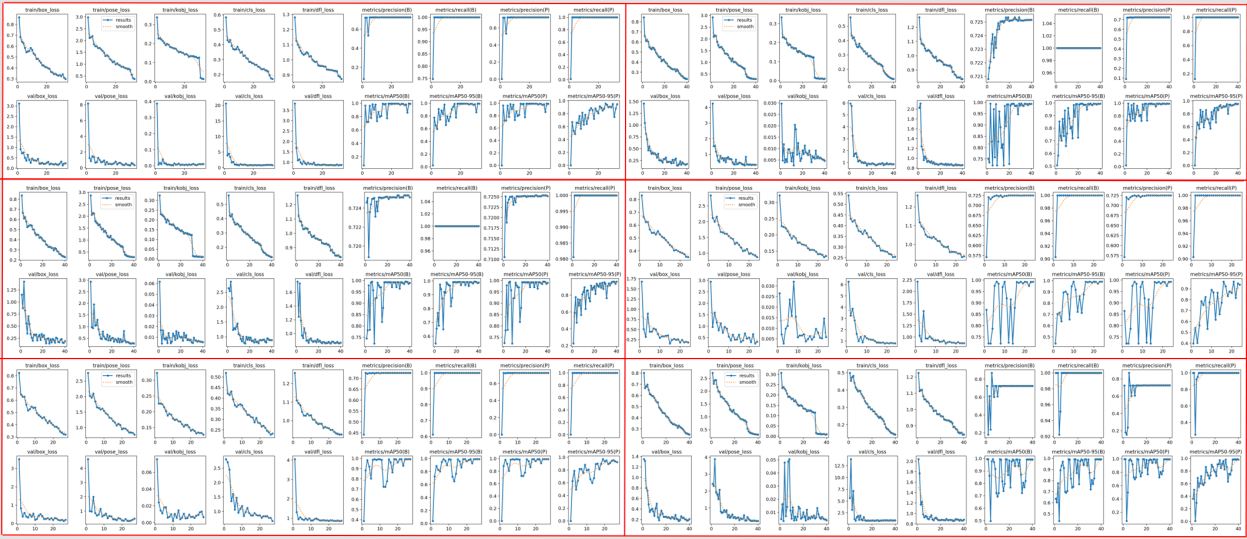
Figure 7 shows the training results, the first three columns of the results represent the training loss and validation loss, mainly focusing on the keypoint loss and the bounding box loss, and the last four columns represent the detection precision, recall, and average precision mean of the bounding box and keypoint. With the increase of epoch, the training loss and validation loss decrease steadily and converge, and the precision, recall, and average precision mean increase rapidly at first, fluctuate a little in the middle, but finally stabilize with a higher value. The results show that the training effect is good, and there is no overfitting and underfitting.
4.3.2. Results and analysis of pilot's pilot stick maneuvering behavior detection
The results of different models tested on 50 datasets of manipulating the driver's stick behavior are shown in Table 3, Weights(α) -mAP@0.5:0.95. The fitted curves are shown in Figure 8, the mAP@0.5:0.95 and FPS objectively reflect the model detection ability.
|
Model |
mAP@0.5:0.95 |
FPS |
|
YOLOv8m-pose |
0.22 |
28 |
|
YOLOv8m-pose-α0.3 |
0.662 |
26 |
|
YOLOv8m-pose-α0.4 |
0.672 |
34 |
|
YOLOv8m-pose-α0.5 |
0.676 |
29 |
|
YOLOv8m-pose-α0.6 |
0.631 |
34 |
|
YOLOv8m-pose-α0.7 |
0.617 |
27 |
|
YOLOv8m-pose-α1.0 |
0.566 |
27 |
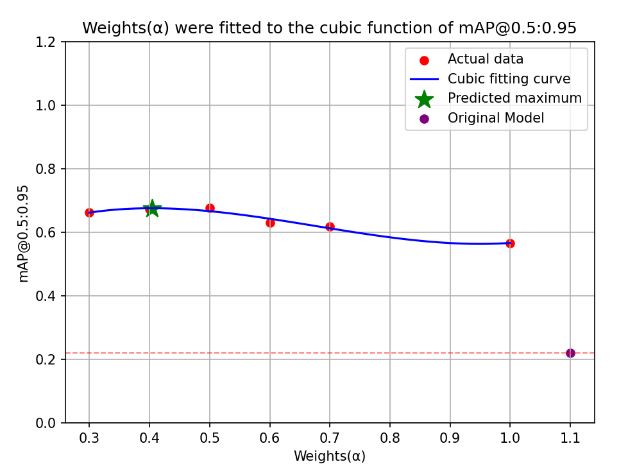
Table 3 shows the original YOLOv8m-pose model in the first row, followed by the model trained using fused data with different weights. Figure 8 shows mAP@0.5:0.95 Maximum values occur between α = 0.4 and α = 0.5. The analysis shows that when the weights α=0.4, β=0.6, mAP@0.5:0.95 is 0.672, which improves 205.5% compared to YOLOv8m-pose, although it is faster than mAP@0.5:0.95 slightly lower when α=β=0.5, but its speed is a faster 34FPS, which is able to guarantee the detection accuracy and detection speed at the same time. Therefore, the weight α=0.4 and β=0.6 has the best detection effect on the pilot's joystick manipulation behavior.
4.3.3. Results and analysis of pilot handle manipulation behavior detection
The results of the different models tested on manipulating the thrust handle behavior on 50 datasets are shown in Table 4, Weights(α)-mAP@0.5:0.95 fitted curves are shown in Figure 9.
|
Model |
mAP@0.5:0.95 |
FPS |
|
YOLOv8m-pose |
0.269 |
28 |
|
YOLOv8m-pose-α0.3 |
0.867 |
28 |
|
YOLOv8m-pose-α0.4 |
0.917 |
26 |
|
YOLOv8m-pose-α0.5 |
0.909 |
26 |
|
YOLOv8m-pose-α0.6 |
0.725 |
29 |
|
YOLOv8m-pose-α0.7 |
0.725 |
27 |
|
YOLOv8m-pose-α1.0 |
0.901 |
34 |
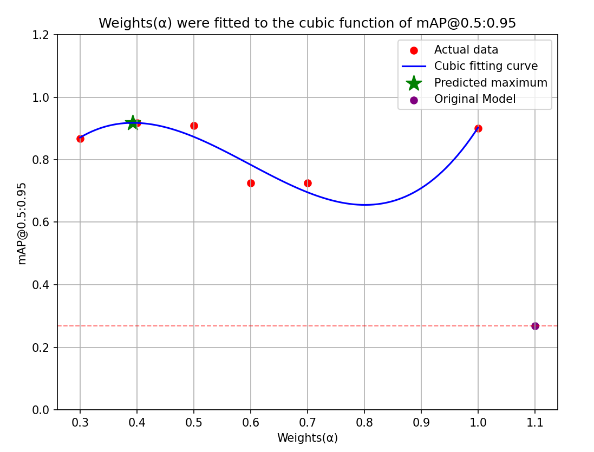
Table 4 shows the original YOLOv8m-pose model in the first row, followed by the model trained using fused data with different weights. Figure 9 shows the maximum value of mAP@0.5:0.95 occurs between α = 0.4 and α = 0.5. The analysis shows that when the weights α=0.4 and β=0.6, its mAP@0.5:0.95 is 0.917 improves 240.9% compared to YOLOv8m-pose with a speed of 26FPS, and when the weights α=1.0 and β=0, its mAP@0.5:0.95 is 0.901 improves 234.9% compared to YOLOv8m-pose with a speed of 34FPS, both of which are excellent at different levels.
4.3.4. Results and analysis of mixed behavior detection
The results of the different models tested on a mixed dataset of 25 sheets for each of the two behaviors are shown in Table 5, Weights(α)-mAP@0.5:0.95 fitted curve is shown in Figure 10.
|
Model |
mAP@0.5:0.95 |
FPS |
|
YOLOv8m-pose |
0.241 |
38 |
|
YOLOv8m-pos-α0.3 |
0.708 |
29 |
|
YOLOv8m-pos-α0.4 |
0.744 |
39 |
|
YOLOv8m-pos-α0.5 |
0.728 |
37 |
|
YOLOv8m-pos-α0.6 |
0.651 |
31 |
|
YOLOv8m-pos-α0.7 |
0.635 |
22 |
|
YOLOv8m-pos-α1.0 |
0.67 |
22 |
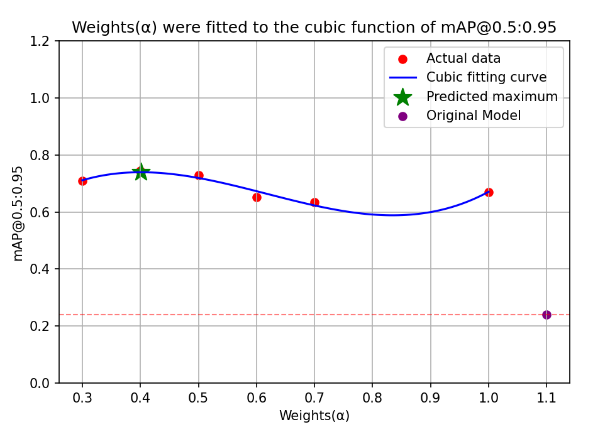
The first row of Table 5 shows the original YOLOv8m-pose model, followed by the model trained using different weights to fuse the data. The analysis of Figure 10 shows the maximum value of mAP@0.5:0.95 occurs at α=0.4, which shows that when the weights α=0.4 and β=0.6, mAP@0.5:0.95 is 0.744, which improves 208.7% compared to YOLOv8m-pose, with a speed of 39FPS, which is the best performance in terms of both accuracy and speed.
Through the analysis in section 3 above, when weights α=0.4, β=0.6, the trained model performs well in detection speed and detection accuracy on both behaviors.
5. Conclusion
In the transformation of civil aviation driving mode from DPO to SPO, a pilot behavior detection model based on pixel-level weighted fusion is proposed for the problem of SOP-based pilot workload assessment, which realizes high-precision real-time monitoring of typical pilot maneuvering behavior.
In this study, an improved pilot behavior detection model based on YOLOv8m-pose is proposed and the corresponding model performance is evaluated. Pixel-level weighted fusion is performed using multiple sets of RGB images and depth images with different weighting parameters, and the fused images are used to train in the YOLOv8m-pose model, and the final model is obtained with a detection speed of 39 FPS in the detection of a mixed behavioral dataset, mAP@0.5:0.95 is 208.7% better than YOLOv8m-pose. This study provides an innovative pixel-level weighted fusion-based pilot behavior detection method for NASA's proposed problem of evaluating a single flight workload and for our country's realization of the civil aviation driving mode shift from DPO to SPO.
Problems required to be solved in the future research are:
1) Insufficient diversity in data sources, such as cockpit voice and text data;
2)Weak sample diversity , the research object is only from one model and two behaviors of one pilot, and the generalization ability to different models of cockpits, different abilities of pilots, and different behaviors of pilots is untested;
3)The implementation of pixel-level fusion is relatively simple, with weak anti-interference ability, large computation, difficulty in realizing dynamic fusion weights, and difficulty in fusing high-level semantic features, which can be effectively avoided in the future by using feature-level fusion.
Future research will focus on feature-level fusion of RGB images and depth images based on YOLOv8-pose, modifying the network architecture of YOLOv8-pose to dual-branch feature extraction, performing cross-modal feature fusion based on the attention mechanism, and imitating the original network to perform cross-scale feature fusion, with the aim of realizing a more accurate and fast pilot behavior detection.
References
[1]. Comerford D , Brandt S L , Lachter J B , et al.NASA's Single-Pilot Operations Technical Interchange Meeting: Proceedings and Findings [J]. 2013: 67-97.
[2]. WANGM, XIAO G, WANGGQSingle-Pilot operation mode technology [J. Acta Aeronautica et Astronautica Sinica, 2020, 41(4); 323541 (in Chinese). doi10.7527/S1000-6893.2019.23541.
[3]. Mohanavelu K , Poonguzhali S , Ravi D , et al.Cognitive Workload Analysis of Fighter Aircraft Pilots in Flight Simulator Environment [J].Defence Science Journal, 2020, 70(2): 131-139.DOI: 10.14429/dsj.70.14539.
[4]. Cao, X.; MacNaughton, P.; Cadet, L.R.; Cedeno-Laurent, J.G.; Flanigan, S.; Vallarino, J.; Donnelly-McLay, D.; Christiani, D.C.; Spengler, J.D.; Allen, J.G. Heart Rate Variability and Performance of Commercial Airline Pilots during Flight Simulations. Int. J. Environ. Res. Public Health 2019, 16, -237.
[5]. Alaimo, A.; Esposito, A.; Orlando, C.; Simoncini, A. Aircraft Pilots Workload Analysis: Heart Rate Variability Objective Measures and NASA-Task Load Index Subjective Evaluation. Aerospace 2020, 7-137.
[6]. Wagner, M.; Sahar, Y.; Elbaum, T.; Botzer, A.; Berliner, E. Grip force as a measure of stress in aviation. Int. J. Aviat. Psychol. 2015, 25, 157–170.
[7]. Li, Y.; Li, K.; Wang, S.; Chen, X.; Wen, D. Pilot Behavior Recognition Based on Multi-Modality Fusion Technology Using Physiological Characteristics. Biosensors 2022, 12, 404.
[8]. WANG Lei, 20U Ying, WANG Shuo. Ouantitative evaluation of pilots'unsate operation behavior driven by OAR data.China Safety Science Journal, 2023.33(5).49-56.
[9]. yu shen, "Airline Pilot Action (APA)", IEEE Dataport, November 14, 2024, doi: 10.21227/kat2-s264.
[10]. Kumar M .Total variation regularization-based pixel level image fusion [C]//Signal Processing Systems.IEEE, 2010.DOI: 10.1109/SIPS.2010.5624819.
[11]. Yan S , Rao Y , Hou W .Detection in Complex Scenes Using Rgb and Depth Multimodal Feature Fusion [C]//ICASSP 2024 - 2024 IEEE International Conference on Acoustics, Speech and Signal Processing (ICASSP).0 [2025-04-30].DOI: 10.1109/ICASSP48485.2024.10448205.
[12]. ]Yao J , Zhang Y , Liu F , et al.Object Detection Based On Decision Level Fusion [J]. 2019.DOI: 10.1109/CAC48633.2019.8997222.
[13]. Chen H , Zhou G , Jiang H .Student Behavior Detection in the Classroom Based on Improved YOLOv8 [J].Sensors (14248220), 2023, 23(20).DOI: 10.3390/s23208385.
[14]. M. Li and F. Liu, "A Novel Finetuned YOLOv8 Transfer Learning Model for Smoking Behavior Detection, " 2024 International Conference on Image Processing, Computer Vision and Machine Learning (ICICML), Shenzhen, China, 2024, pp. 1944-1949, doi: 10.1109/ICICML63543.2024.10957847.
[15]. R. Varghese and S. M., "YOLOv8: A Novel Object Detection Algorithm with Enhanced Performance and Robustness, " 2024 International Conference on Advances in Data Engineering and Intelligent Computing Systems (ADICS), Chennai, India, 2024, pp. 1-6, doi: 10.1109/ADICS58448.2024.10533619.
Cite this article
Zu,Z.;Shen,Y. (2025). Research on Pilot Behavior Detection Model Based on Multi-Source Heterogeneous Data. Applied and Computational Engineering,169,86-98.
Data availability
The datasets used and/or analyzed during the current study will be available from the authors upon reasonable request.
Disclaimer/Publisher's Note
The statements, opinions and data contained in all publications are solely those of the individual author(s) and contributor(s) and not of EWA Publishing and/or the editor(s). EWA Publishing and/or the editor(s) disclaim responsibility for any injury to people or property resulting from any ideas, methods, instructions or products referred to in the content.
About volume
Volume title: Proceedings of CONF-MSS 2025 Symposium: Machine Vision System
© 2024 by the author(s). Licensee EWA Publishing, Oxford, UK. This article is an open access article distributed under the terms and
conditions of the Creative Commons Attribution (CC BY) license. Authors who
publish this series agree to the following terms:
1. Authors retain copyright and grant the series right of first publication with the work simultaneously licensed under a Creative Commons
Attribution License that allows others to share the work with an acknowledgment of the work's authorship and initial publication in this
series.
2. Authors are able to enter into separate, additional contractual arrangements for the non-exclusive distribution of the series's published
version of the work (e.g., post it to an institutional repository or publish it in a book), with an acknowledgment of its initial
publication in this series.
3. Authors are permitted and encouraged to post their work online (e.g., in institutional repositories or on their website) prior to and
during the submission process, as it can lead to productive exchanges, as well as earlier and greater citation of published work (See
Open access policy for details).
References
[1]. Comerford D , Brandt S L , Lachter J B , et al.NASA's Single-Pilot Operations Technical Interchange Meeting: Proceedings and Findings [J]. 2013: 67-97.
[2]. WANGM, XIAO G, WANGGQSingle-Pilot operation mode technology [J. Acta Aeronautica et Astronautica Sinica, 2020, 41(4); 323541 (in Chinese). doi10.7527/S1000-6893.2019.23541.
[3]. Mohanavelu K , Poonguzhali S , Ravi D , et al.Cognitive Workload Analysis of Fighter Aircraft Pilots in Flight Simulator Environment [J].Defence Science Journal, 2020, 70(2): 131-139.DOI: 10.14429/dsj.70.14539.
[4]. Cao, X.; MacNaughton, P.; Cadet, L.R.; Cedeno-Laurent, J.G.; Flanigan, S.; Vallarino, J.; Donnelly-McLay, D.; Christiani, D.C.; Spengler, J.D.; Allen, J.G. Heart Rate Variability and Performance of Commercial Airline Pilots during Flight Simulations. Int. J. Environ. Res. Public Health 2019, 16, -237.
[5]. Alaimo, A.; Esposito, A.; Orlando, C.; Simoncini, A. Aircraft Pilots Workload Analysis: Heart Rate Variability Objective Measures and NASA-Task Load Index Subjective Evaluation. Aerospace 2020, 7-137.
[6]. Wagner, M.; Sahar, Y.; Elbaum, T.; Botzer, A.; Berliner, E. Grip force as a measure of stress in aviation. Int. J. Aviat. Psychol. 2015, 25, 157–170.
[7]. Li, Y.; Li, K.; Wang, S.; Chen, X.; Wen, D. Pilot Behavior Recognition Based on Multi-Modality Fusion Technology Using Physiological Characteristics. Biosensors 2022, 12, 404.
[8]. WANG Lei, 20U Ying, WANG Shuo. Ouantitative evaluation of pilots'unsate operation behavior driven by OAR data.China Safety Science Journal, 2023.33(5).49-56.
[9]. yu shen, "Airline Pilot Action (APA)", IEEE Dataport, November 14, 2024, doi: 10.21227/kat2-s264.
[10]. Kumar M .Total variation regularization-based pixel level image fusion [C]//Signal Processing Systems.IEEE, 2010.DOI: 10.1109/SIPS.2010.5624819.
[11]. Yan S , Rao Y , Hou W .Detection in Complex Scenes Using Rgb and Depth Multimodal Feature Fusion [C]//ICASSP 2024 - 2024 IEEE International Conference on Acoustics, Speech and Signal Processing (ICASSP).0 [2025-04-30].DOI: 10.1109/ICASSP48485.2024.10448205.
[12]. ]Yao J , Zhang Y , Liu F , et al.Object Detection Based On Decision Level Fusion [J]. 2019.DOI: 10.1109/CAC48633.2019.8997222.
[13]. Chen H , Zhou G , Jiang H .Student Behavior Detection in the Classroom Based on Improved YOLOv8 [J].Sensors (14248220), 2023, 23(20).DOI: 10.3390/s23208385.
[14]. M. Li and F. Liu, "A Novel Finetuned YOLOv8 Transfer Learning Model for Smoking Behavior Detection, " 2024 International Conference on Image Processing, Computer Vision and Machine Learning (ICICML), Shenzhen, China, 2024, pp. 1944-1949, doi: 10.1109/ICICML63543.2024.10957847.
[15]. R. Varghese and S. M., "YOLOv8: A Novel Object Detection Algorithm with Enhanced Performance and Robustness, " 2024 International Conference on Advances in Data Engineering and Intelligent Computing Systems (ADICS), Chennai, India, 2024, pp. 1-6, doi: 10.1109/ADICS58448.2024.10533619.