


1. Introduction
With the rapid progression of high technology, new-style fraud has emerged in the past decade, among which credit card fraud has been exceptionally grave. Cybercriminals utilize the Internet and technology to steal people's credit card information. They then use this stolen data to fabricate fake identities, which they employ to carry out credit card fraud. According to Key Credit Card Fraud Statistics Consulting published by Merchant Cost Consulting [1], by 2025, US credit card fraud losses will have surpassed $12.5 billion, accounting for 46% of all credit card theft worldwide. Hence, the credit card fraud detection is of vital importance in preventing financial loss, establishing consumer protection and maintaining trust in digital transactions.
Previous studies tend to implement dimensionality reduction methods to preprocess the data. In one study carried out by Pitsane et al.[2], in order to compare the results before and after decrease of dimensionality, t-Distributed Stochastic Neighbor Embedding (t-SNE) was implemented. This study shows that the Logistic Regression model had a 95.0% accuracy rating. before the implementation while it reached 97.02% accuracy after applying t-SNE. Besides, different models like Logistic Regression, Naïve Bayes, Decision Tree and Random Forest were used separately to assess how well each model performs in preceding research. The result of each model was compared respectively with those of other models to figure out the model with the best performance. However, there exist mainly two research gaps. While dimensionality reduction techniques are widely adopted in preprocessing pipelines, few studies have implemented dimensionality elevation strategies. Since the sample size of fraud cases is limited, models may suffer from high bias due to insufficient features. However, through increasing the number of features, the feature space is artificially enriched and therefore a relative balance could be achieved as well as certain subtle but critical signals could be captured. Besides, the stacking model has rarely been used in credit card fraud detection while in other areas like infection diagnosis carried out by Taspinar et al. [3], the stacking model has a 0.2%-6.7% increase in accuracy compared to that of a single model. Since each model has its own strengths and weaknesses, a comprehensive ensemble could be a way to make full use of the strengths in each model and output the most accurate result. Stacking models also allows the combination of fundamentally different algorithms (heterogeneous models), each capturing unique patterns in the data. Another advantage of stacking models is its robustness to noisy data since noise affects models differently, which leads that one model’s overestimation may offset another’s underestimation, making their consensus more reliable.
Therefore, in this study, the dimensionality elevation method PolynomialFeatures is utilized to compare with the dimensionality reduction method t-SNE to see which data preprocessing method has better accuracy. Compared with other dimensionality elevation methods, PolynomialFeatures is more straightforward since it creates features by raising original features to powers and combining them multiplicatively. In addition, a stacking model is implemented to explore whether it will have a higher accuracy compared to a single model. This study chooses Logistic Regression as the stacking model due to its simple linear form, making it less prone to overfitting compared to complex meta-models like Random Forests or Deep Neural Networks.
2. Methodology
2.1. Data collection and data preparation
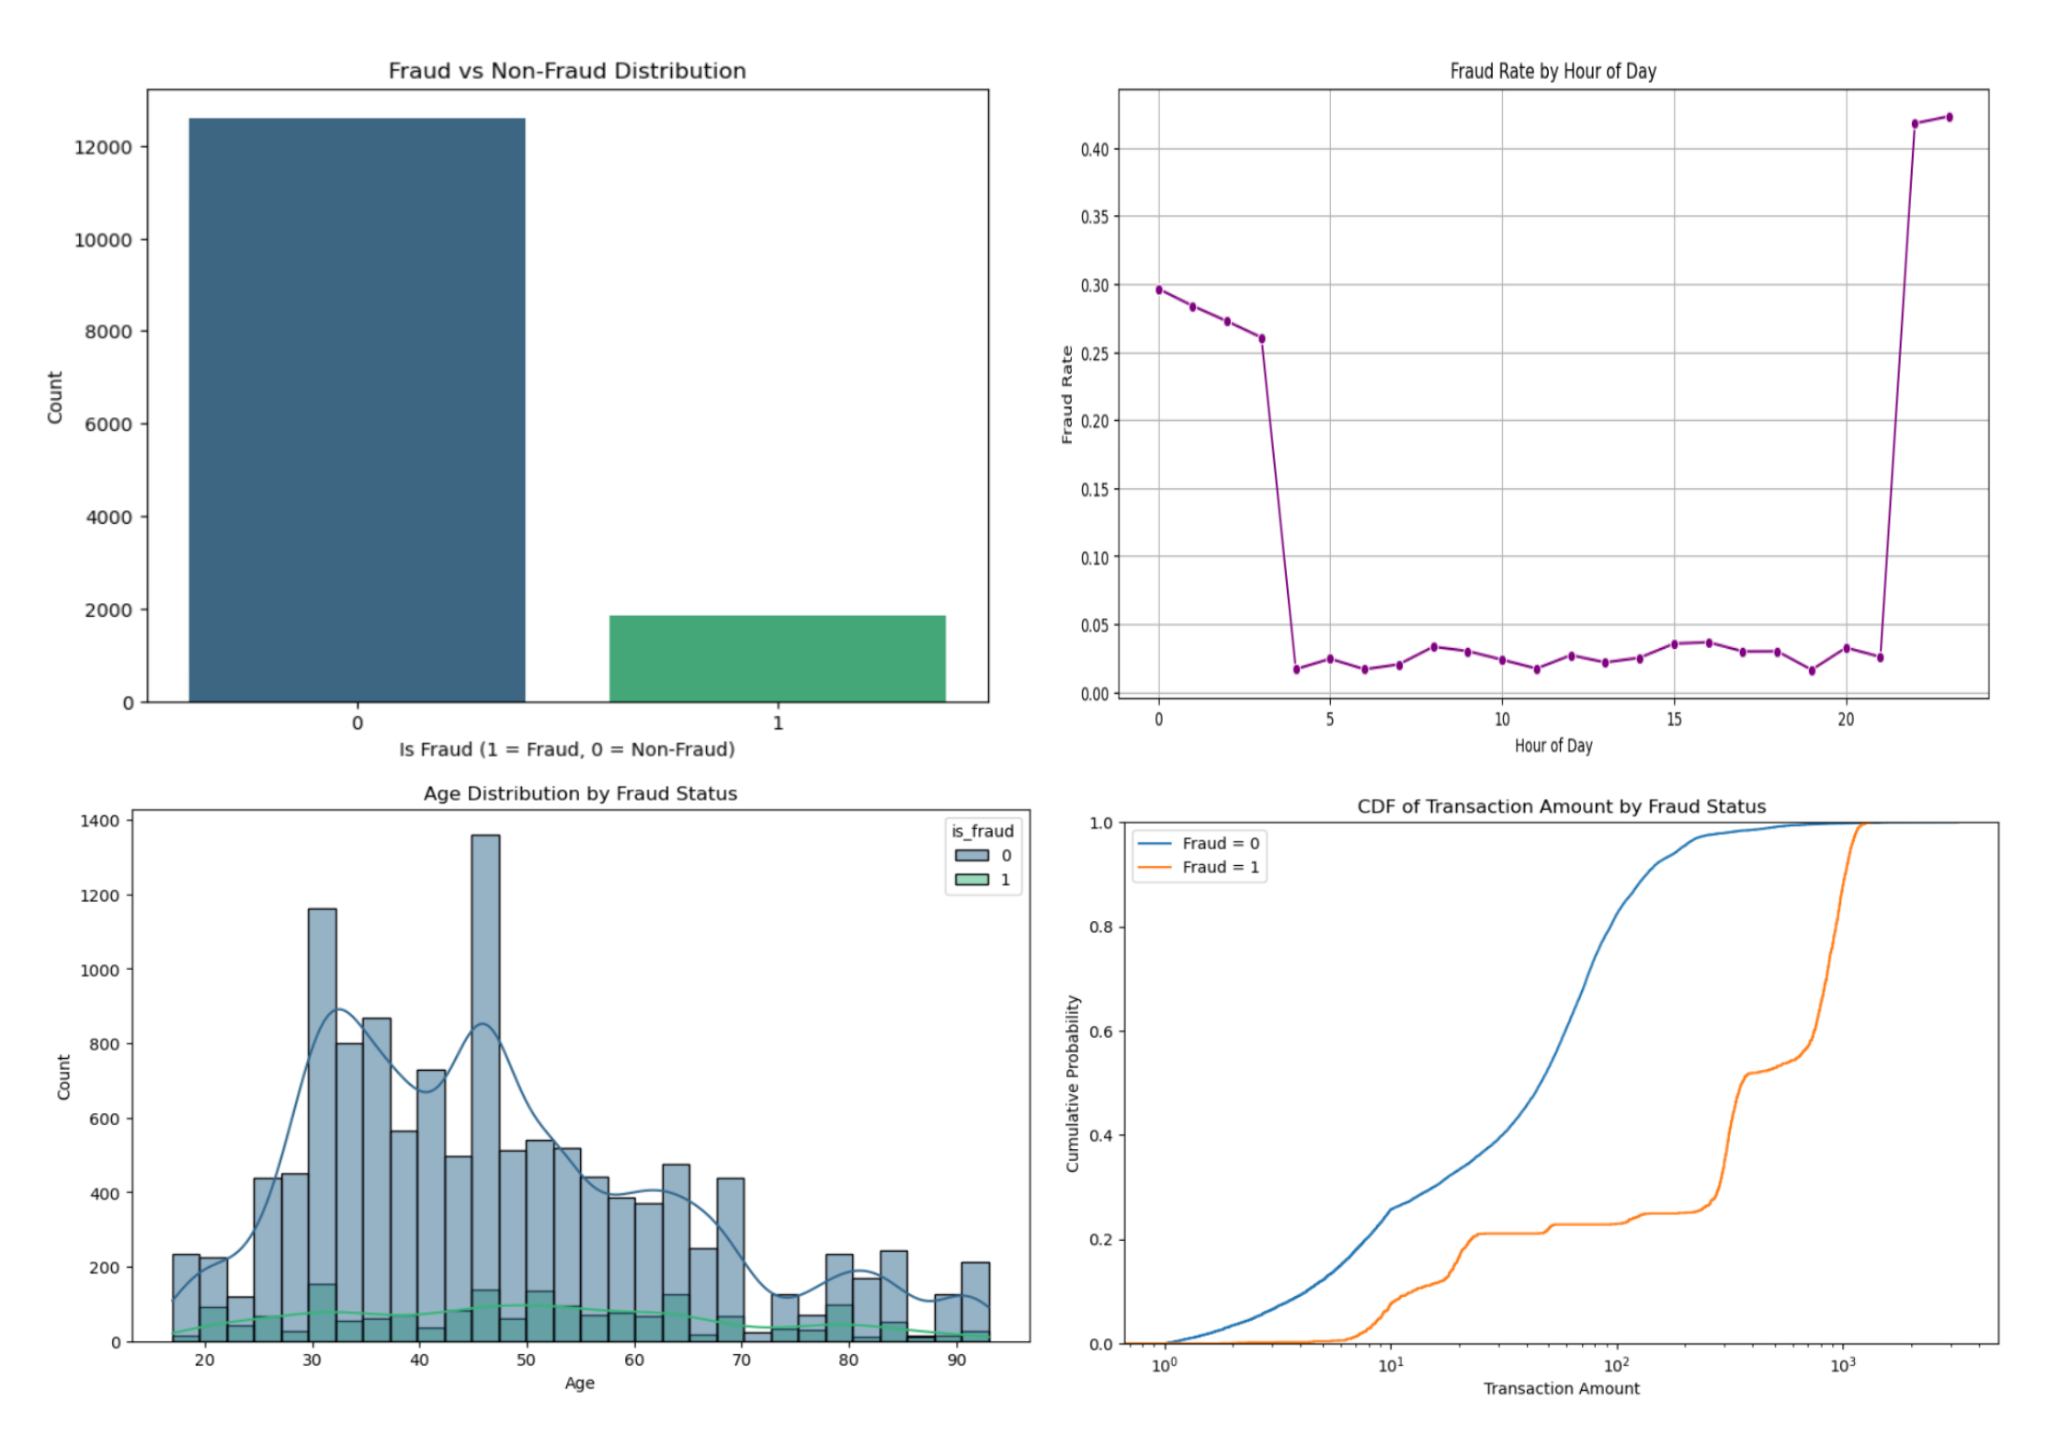
The research uses the western United States data set, which was obtained from Kaggle [4]. This data set contains 14,446 transactions with only 1,844 labeled as frauds which only accounts for 12.7% of the total transactions. All the features in the data set are transparent without any preprocessing methods.
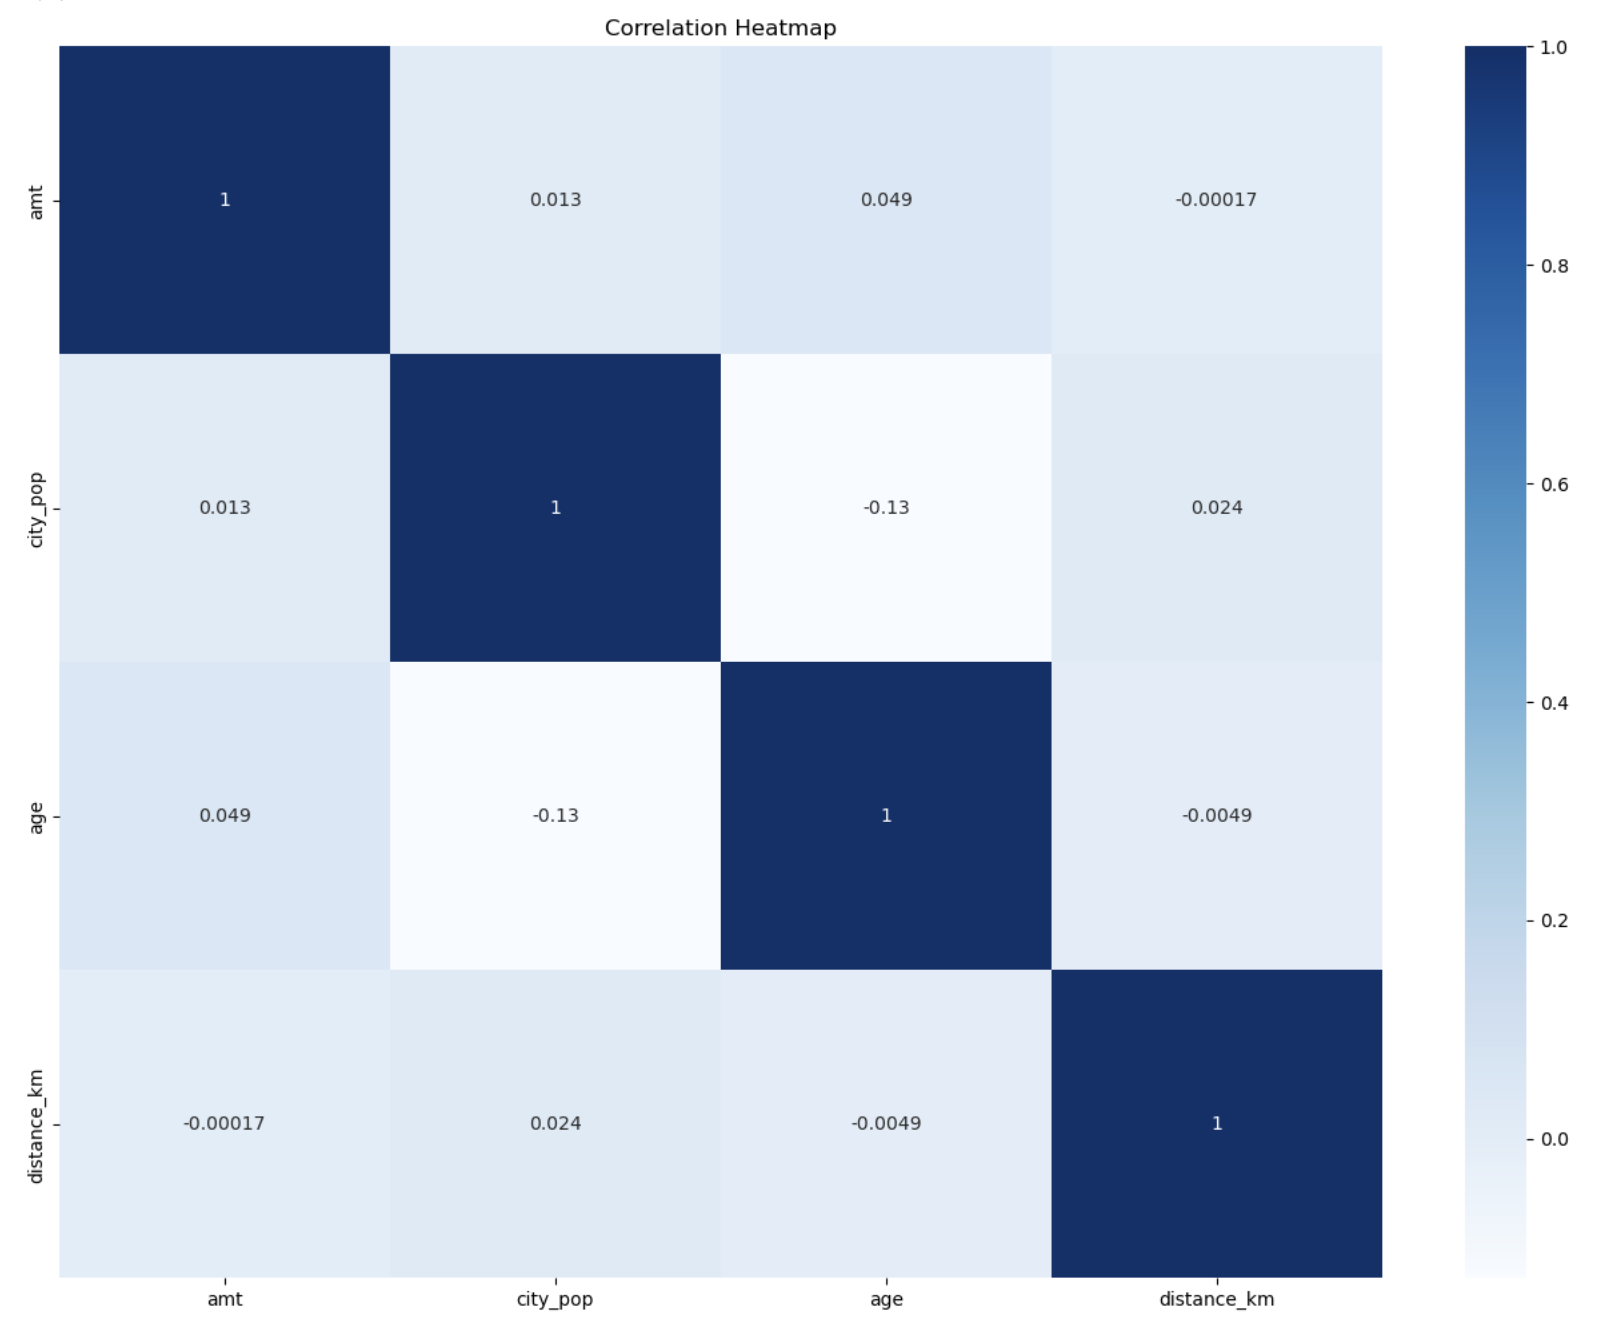
Data sets can be analyzed using exploratory data analysis (EDA), which summarizes the key features of the data (Figure 1). These visualizations collectively offer a comprehensive view of the dataset, facilitating a more thorough comprehension of the connections and distributions that can inform further analysis or predictive modeling. The correlation heatmap (Figure 2) was also provided to check if there is a duplicate feature that needs deleting.
2.2. Dimensionality reduction and dimensionality elevation
2.2.1. Dimensionality reduction
t-SNE is a statistical technique that assigns a location to each data point on a two- or three-dimensional map in order to visualize high-dimensional data. This study chooses t-SNE because it is particularly good at preserving local relationships in the data. This means it can highlight small groups of similar transactions, which is useful for identifying fraudulent transactions that may form distinct clusters or outliers [5]. Also, t-SNE can help visualize the imbalanced distribution of both classes (fraudulent and non-fraudulent) in a low-dimensional space, making it easier to identify regions where fraud might be concentrated.
2.2.2. Dimensionality elevation
With this method, all polynomial combinations of features with degree less than or equal to the specified degree are combined to create a new feature matrix. Since fraudulent behavior may depend on interactions between multiple features, PolynomialFeatures automatically generates interaction terms, which can help the model detect these scenarios. PolynomialFeatures could control the degree of the polynomial, which is proper to handle the 15 features in the data set.
2.3. Model training
Four models were employed to do the training including Logistic Regression, Decision Tree, Random Forest and Support Vector Machine. The dataset was partitioned into an 80% training set and a 20% testing set.
2.3.1. Logistic regression
Using a continuous curve as the final result, Logistic Regression forecasts discrete groupings. The logistic function curve contains the ultimate outcome. The model assigns the input to class 1 if the output is larger than or equal to 0.5, and class 0 if the final output is less than or equal to 0.5 [6]. The logistic model is simple to implement and computationally efficient, making it an ideal choice as a baseline model for binary classification tasks. Furthermore, the logistic model provides a strong foundation for comparison with more complex models. By starting with logistic regression, it is possible to establish a performance benchmark that helps evaluate whether the added complexity of advanced models.
2.3.2. Decision tree
A decision tree is a recursive partitioning structure for decision support that employs a tree-like representation of decisions and their potential outcomes [6]. An algorithm with only conditional control statements can be shown in this manner. Here, Decision Tree was chosen since it is easy to interpret. Decision trees' visual representations and Boolean logic facilitate comprehension and consumption. Additionally, a decision tree's hierarchical structure facilitates the identification of the most crucial qualities.
2.3.3. Random Forest
To determine the categorization result, the Random Forest technique employs a forest or group of decision trees. The accuracy of the outcome improves with the number of trees. This study chose Random Forest because it could reduce risk of overfitting. Since decision trees have a tendency to closely fit every sample in training data, they are susceptible to overfitting. Nonetheless, the classifier won't overfit the model when a random forest has a large number of decision trees because the averaging of uncorrelated trees reduces the total variance and prediction error.
2.3.4. Support vector machine
SVM is used to compare with other models. When it comes to high-dimensional and unstructured datasets, SVM usually outperforms logistic regression. Additionally, SVM is easier to understand and less susceptible to overfitting, which makes them potentially more computationally costly [7]. Additionally, SVM can be modified to deal with unbalanced datasets by utilizing cost-sensitive learning or class weights, which impose harsher penalties for incorrectly classifying members of the minority class. This advantage is quite suitable for the data set used in this study.
2.3.5. Stacking model
In order to arrive at a final forecast, a machine learning technique called stacking aggregates the predictions of multiple base models. Using the same training dataset, many base models are trained, and their predictions are then fed into a higher-level model to get the final prediction [8-10]. This study chooses Logistic Regression, Decision Tree, Random Forest and SVM as four base models and picks Logistic Regression as the meta model to explore the result.
2.4. Evaluation metrics
The study uses a confusion matrix which consists of four segments, respectively true positive, true negative, false negative, and false positive to have an overview of the results. The research also uses recall, out of the total positive, what percentage are predicted positive. It is the same as True Positive Rate (TPR). F1 score is also utilized to evaluate the result. It is the harmonic mean of precision and recall. It takes both false positives and false negatives into account. Therefore, it performs well on an imbalanced dataset.
3. Results and discussion
Table 1 presents the classification results using t-SNE transformed features. Among the models tested, Random Forest achieved the highest recall (0.9241) and F1-score (0.99), demonstrating strong capability in detecting fraudulent transactions while maintaining high precision (0.99). The Decision Tree model also performed reasonably well, with a recall of 0.6179 and a precision of 0.95. However, Logistic Regression struggled with fraud detection, showing a recall of 0.0000, meaning it failed to correctly classify fraudulent transactions, despite achieving a high precision (0.87). Since t-SNE transforms the feature space into a highly non-linear manner, it may create highly complex and non-linear decision boundaries, which Logistic Regression cannot effectively capture. The Stacking Model, which combines predictions from multiple classifiers, performed similarly to Random Forest, having a 0.99 F1-score and a 0.9106 recall, making it one of the best-performing models in this setting.
Table 2 illustrates the results when polynomial feature expansion was applied. Random Forest maintained a strong recall (0.7344) while improving precision (0.96). The Decision Tree and SVM models also showed significant gains in recall, reaching 0.7100 and 0.6477, respectively. Notably, Logistic Regression improved substantially compared to the t-SNE setting, with recall increasing to 0.4905 while maintaining a strong precision (0.93). Polynomial feature expansion preserves the original data structure while introducing interaction terms, which help Logistic Regression model more complex relationships between features. The Stacking Model outperformed individual classifiers, achieving the highest recall (0.7236) while maintaining a balanced F1-score (0.97), suggesting that leveraging multiple models enhances fraud detection capability.
|
Model |
Accuracy |
Recall |
Precision |
F1-Score |
Support(0) |
Support(1) |
|
Logistic Regression |
0.8722 |
0.0000 |
0.87 |
0.93 |
2519 |
369 |
|
Decision Tree |
0.9301 |
0.6179 |
0.95 |
0.96 |
2519 |
369 |
|
Random Forest |
0.9782 |
0.9241 |
0.99 |
0.99 |
2519 |
369 |
|
SVM |
0.9117 |
0.3252 |
0.91 |
0.95 |
2519 |
369 |
|
Stacking Model |
0.9782 |
0.9106 |
0.99 |
0.99 |
2519 |
369 |
|
Model |
Accuracy |
Recall |
Precision |
F1-Score |
Support(0) |
Support(1) |
|
Logistic Regression |
0.9259 |
0.4905 |
0.93 |
0.96 |
2519 |
369 |
|
Decision Tree |
0.9515 |
0.7100 |
0.96 |
0.97 |
2519 |
369 |
|
Random Forest |
0.9526 |
0.7344 |
0.96 |
0.97 |
2519 |
369 |
|
SVM |
0.9394 |
0.6477 |
0.95 |
0.97 |
2519 |
369 |
|
Stacking Model |
0.9539 |
0.7236 |
0.96 |
0.97 |
2519 |
369 |
It could also be seen that both Random Forest and the stacking model perform better with t-SNE features. Random Forests, comprising multiple decision trees, inherently capture nonlinear interactions among features. When applied to t-SNE-transformed data, which emphasizes local structures and relationships, Random Forests can effectively exploit these nuanced patterns, leading to improved predictive performance. Stacking involves combining multiple learning algorithms to harness their individual strengths. When base learners are trained on t-SNE features, each may capture different aspects of the data structure. The meta-learner in the stacking ensemble can then integrate these diverse perspectives, resulting in a more robust and accurate model.
Another point worth noting is that base models and the stacking model are adapted to different dimensionality processing methods. Except for Random Forest, the remaining base models perform better under PolynomialFeatures while the stacking model has a better performance with t-SNE processing method. The result is relatively reasonable. Random Forest and the stacking model are both ensemble learning methods that combine multiple models to improve predictive performance, which may already generate high-dimensional intermediate features. Elevating dimensions exacerbates sparsity, making the meta-model prone to overfitting and amplifying noise through feature crosses or nonlinear transforms as well. However, introducing feature interactions enables base models to specialize in different subspaces and reduce the risk of underfitting.
4. Conclusion
This study evaluated the performance of four classification base models, respectively Logistic Regression, Decision Tree, Random Forest, and SVM by using two different feature engineering approaches: t-SNE for non-linear dimensionality reduction and Polynomial Feature Expansion for higher-dimensional transformations. It can be concluded that among the four base models, Random Forest performs the best either in t-SNE processed data set with 0.97 accuracy and 0.92 recall or in PolynomialFeatures data set with 0.95 accuracy and 0.73 recall. Since preventing credit card frauds from happening is the central task, recall is taken as the most significant indicator to evaluate the performance. In this case, Polynomial Feature Expansion is a better choice for the base models, while dimensionality reduction is more suitable for the stacking model.
Besides, the stacking model could slightly enhance the performance by organically combining the strengths of different base models. Here only Logistic Regression is utilized as the meta model, which shows a slight improvement. Therefore, future study could try other meta models like blending, boosting models etc. In addition, other dimensionality reduction methods like PCA could be attempted in future research to see if it could bring a better performance.
References
[1]. Merchant Cost Consulting. (2023) Credit Card Fraud Statistics. URL https: //merchantcostconsulting.com/lower-credit-card-processing-fees/credit-card-fraud-statistics/.
[2]. Pitsane, M.Y., Mogale, H., van Rensburg, J.J. (2022) Improving Accuracy of Credit Card Fraud Detection Using Supervised Machine Learning Models and Dimension Reduction. InInternational Conference on Intelligent and Innovative Computing Applications, 290-301.
[3]. Taspinar, Y.S., Cinar, I., Koklu, M. (2022) Classification by a Stacking Model Using CNN Features for COVID-19 Infection Diagnosis. Journal of X-ray Science and Technology, 30(1), 73-88.
[4]. Kaggle. (2024) Credit Card Fraud Data. URL https: //www.kaggle.com/datasets/neharoychoudhury/credit-card-fraud-data.
[5]. Bello, O.A., Olufemi, K. (2024) Artificial Intelligence in Fraud Prevention: Exploring Techniques and Applications Challenges and Opportunities. Computer Science & IT Research Journal, 5(6), 1505-1520.
[6]. Sharma, P., Banerjee, S., Tiwari, D., Patni, J.C. (2021) Machine Learning Model for Credit Card Fraud Detection-A Comparative Analysis. International Arab Journal of Information Technology, 18(6), 789-796.
[7]. Mammone, A., Turchi, M., Cristianini, N. (2009) Support Vector Machines. Wiley Interdisciplinary Reviews: Computational Statistics, 1(3), 283-289.
[8]. Pavlyshenko, B. (2018) Using Stacking Approaches for Machine Learning Models. In 2018 IEEE Second International Conference on Data Stream Mining & Processing (DSMP), 255-258.
[9]. Zhang, H., Zhu, T. (2022) Stacking Model for Photovoltaic-Power-Generation Prediction. Sustainability, 14(9), 5669.
[10]. Zhao, A.B., Cheng, T. (2022) Stock Return Prediction: Stacking a Variety of Models. Journal of Empirical Finance, 67, 288-317.
Cite this article
Mao,K. (2025). Credit Card Fraud Detection: Comparing Dimensionality Elevation and Reduction, Single Model and Stacking Model. Applied and Computational Engineering,178,262-268.
Data availability
The datasets used and/or analyzed during the current study will be available from the authors upon reasonable request.
Disclaimer/Publisher's Note
The statements, opinions and data contained in all publications are solely those of the individual author(s) and contributor(s) and not of EWA Publishing and/or the editor(s). EWA Publishing and/or the editor(s) disclaim responsibility for any injury to people or property resulting from any ideas, methods, instructions or products referred to in the content.
About volume
Volume title: Proceedings of CONF-CDS 2025 Symposium: Data Visualization Methods for Evaluatio
© 2024 by the author(s). Licensee EWA Publishing, Oxford, UK. This article is an open access article distributed under the terms and
conditions of the Creative Commons Attribution (CC BY) license. Authors who
publish this series agree to the following terms:
1. Authors retain copyright and grant the series right of first publication with the work simultaneously licensed under a Creative Commons
Attribution License that allows others to share the work with an acknowledgment of the work's authorship and initial publication in this
series.
2. Authors are able to enter into separate, additional contractual arrangements for the non-exclusive distribution of the series's published
version of the work (e.g., post it to an institutional repository or publish it in a book), with an acknowledgment of its initial
publication in this series.
3. Authors are permitted and encouraged to post their work online (e.g., in institutional repositories or on their website) prior to and
during the submission process, as it can lead to productive exchanges, as well as earlier and greater citation of published work (See
Open access policy for details).
References
[1]. Merchant Cost Consulting. (2023) Credit Card Fraud Statistics. URL https: //merchantcostconsulting.com/lower-credit-card-processing-fees/credit-card-fraud-statistics/.
[2]. Pitsane, M.Y., Mogale, H., van Rensburg, J.J. (2022) Improving Accuracy of Credit Card Fraud Detection Using Supervised Machine Learning Models and Dimension Reduction. InInternational Conference on Intelligent and Innovative Computing Applications, 290-301.
[3]. Taspinar, Y.S., Cinar, I., Koklu, M. (2022) Classification by a Stacking Model Using CNN Features for COVID-19 Infection Diagnosis. Journal of X-ray Science and Technology, 30(1), 73-88.
[4]. Kaggle. (2024) Credit Card Fraud Data. URL https: //www.kaggle.com/datasets/neharoychoudhury/credit-card-fraud-data.
[5]. Bello, O.A., Olufemi, K. (2024) Artificial Intelligence in Fraud Prevention: Exploring Techniques and Applications Challenges and Opportunities. Computer Science & IT Research Journal, 5(6), 1505-1520.
[6]. Sharma, P., Banerjee, S., Tiwari, D., Patni, J.C. (2021) Machine Learning Model for Credit Card Fraud Detection-A Comparative Analysis. International Arab Journal of Information Technology, 18(6), 789-796.
[7]. Mammone, A., Turchi, M., Cristianini, N. (2009) Support Vector Machines. Wiley Interdisciplinary Reviews: Computational Statistics, 1(3), 283-289.
[8]. Pavlyshenko, B. (2018) Using Stacking Approaches for Machine Learning Models. In 2018 IEEE Second International Conference on Data Stream Mining & Processing (DSMP), 255-258.
[9]. Zhang, H., Zhu, T. (2022) Stacking Model for Photovoltaic-Power-Generation Prediction. Sustainability, 14(9), 5669.
[10]. Zhao, A.B., Cheng, T. (2022) Stock Return Prediction: Stacking a Variety of Models. Journal of Empirical Finance, 67, 288-317.