


1. Introduction
Since the birth of the internet, there has been an increased amount of research in asset price prediction. Investors and sponsors can achieve more profit (alpha) through asset price prediction. Nowadays with the advancements of modern technology, large financial institutions harness the available amounts of processing power to perform sentiment analysis and evaluate comments from social media and message channels. In the text, we would like to discuss the relationship and algorithm of sentiment analysis and how it exactly achieves our goal of precision. As a mainstream communication platform in today’s era, twitter has played an indispensable role in the development of modern information. In 2013, twitter has reached nearly 500 million users, and there are nearly 54 million tweets (comments) every day [1]. As a larger data field, the source of information for the analysis mentioned will be mainly from twitter.
Yoshinaga et al. [2] shows the plausibility of predicting stock rates of return with sentiment analysis by using three market factors: market value, total risk, age. They take these three factors and transpose them to a matrix that illustrates the relationship between stock rates of return and the level of market sentiment. They concluded there exists a negative correlation between the sentiment factor of the market and the market rate of return. Furthermore, market sentiment is defined as the impression or beliefs of individuals to the scales [3]. Individual factors in the market can also affect the market as a whole by weighting equally. [4], [5]. In conclusion, there is a high relationship of influence among the public’s market sentiment (sentiment measures significantly affect the stock market) and asset prices.
The efficient market hypothesis(EMH) illustrates three types of market structure: weak, semi-weak, and strong. Within the weak form, nowadays asset prices would represent all the past information of price. Additionally, the semi-weak structure means that overt and information upon asset prices now are be considered present in this structure is only used to calculate the current stock price. Thirdly, Strong form means that all the past and future information are be presented and calculated directly to the current stock prices which are meaningless for investors’ foresight. This hypothesis is important by which determines whether or not there have chance to excess normal returns on the stock by technical analysis [6]. The Dow Jones Industrial Average (DJIA) is also as a common benchmark of extracting sentiment and is also widely used to predict future asset prices [7-9]. Memberships in S&P 500 can be represents the trends for the whole [10]. But there have been a doubt to their accuracy as a representation. It is noted, however, that forecasting the stock market through the S&P 500 often underestimates the prices of other stocks in the market. Also overestimates the returns of S&P 500 members [11].
Most stock price prediction models focus on stocks or indexes individually. For example, Yu & Yan [12] predicts S&P 500, the Nikkei 225, and the Dow Jones Industrial Average (DJIA) with different datasets. However, the approach ignores the interrelationships between different stocks, especially within the same market sector. For example, a piece of news could push up the price of different related stocks and vice versa. During the dot-com bubble, the stock prices of Internet-related companies peaked. When the bubble burst, several Internet companies went bankrupt. Companies that survived lost a large portion of their market value, with Amazon.com going from 102 dollars in 1999 to 6 dollars in 2001. Also, the overall economic situation impacts individual companies. For instance, during an economic recession, it is common for different companies to go bankrupt due to mass market participant panic. Therefore, when evaluating the outlook of stocks, it is necessary to consider the situation of the overall economy and the specific market sector.
In this paper, we propose MLStock, a method that models the market sentiment, the sector sentiment, and the stock sentiment to predict individual stock prices. We utilize the Gated Recurrent Unit (GRU) [13] and stock data to evaluate the market sentiment at different scales–for each stock, each market sector, and the whole market, then bring the information altogether to predict the changes in prices of the individual stocks.
This paper makes several contributions. First, we incorporated different market aspects to predict stock prices. Second, we propose a method based on GRU to model those parts of the market. Third, we have done extensive experiments to demonstrate the performance and plausibility of our method.
The rest of the paper is organized as follows: First, we present relevant literature in sentiment analysis and stock price prediction. Then, we introduce the source of our data and the preprocessing works. Next, we propose the MultiStock method. This is followed by the description of the experimental setup being used and the experimental results on our datasets. Finally, we propose future works in the area and conclude with Section VI.
2. Literature review
The MLStock model relies on previous works of sentiment analysis and stock prices prediction. In this section, we introduce the related works in the aspects for reference.
2.1. Sentiment analysis
Sentiment analysis is the task of detecting and evaluating the state of mind of humans from text [14]. We can divide common approaches into three categories: 1) Lexicon-based and rule-based methods, which use pre-prepared sentiment lexicon to aggregate the sentiment score of the words in a document and produce a holistic score, 2) Traditional machine learning methods that extract features from texts and detect sentiments with traditional machine learning models, and 3) Deep learning methods that represent texts with embeddings and predict sentiments with deep neural networks.
Typical lexicon-based methods include Linguistic Inquiry and Word Count (LIWC) [15], SentiWordNet [16], and VADER [17]. Using a dictionary of 4,500 words organized into 76 categories, LIWC classifies the sentiment of a document with the category of each word. However, it does not consider the intensity of sentiments. SentiWordNet annotates each word with three numerical scores about positivity, negativity, and subjectivity, ranging from 0.0 to 1.0, with a sum of 1.0.
The scores are generated with a semi-supervised approach. In contrast, VADER rates the sentiment scores of each word manually and includes acronyms, emoticons, and slang that are important for social media texts.
Even though the lexicon based method achieves some success, rating each word is costly and inflexible. Traditional machine learning methods eliminate the step by feature extraction. One can obtain features by counting the words. Alternatively, Term Frequency-Inverse Document Frequency (TF-IDF) gives the weights of each word. The TF-IDF value increases proportionally to the number of times a word appears in a document and decreases as the number of documents in the corpus that contain the word increases. Other possible features include punctuation, complete uppercase words, and sentence lengths. Afterward, one can input the features into classifiers, which outputs the sentiment of the text. For example, the Naive Bayes classifier is based on Bayesian probability and assumes that feature probabilities are independent; Support Vector Machines (SVMs) separate data points with hyperplanes (a subspace whose dimension is one less than that of its ambient space).
Recently, sentiment analysis with deep learning has gained increasing attention. Experiments have shown that they can better capture the semantic information within texts. Those methods depend on word embeddings, which learns latent, low-dimensional representations from the language structure. Early word embedding models assume that frequently cooccurring words tend to be similar semantically, and a unique vector represents every word. For instance, word2vec [18] consists of a neural network that reconstructs the linguistic context of the text. It is trained with a large corpus and produces a vector for each word. However, it omits polysemy and word ordering information. Newer models, such as BERT [19], address this issue. BERT tries to predict unseen words from the contexts. It utilizes word orderings with transformers and produces multiple vectors to tackle polysemy. BERT inspires a series of pre-trained models, such as GPT-3 [20] and XLNet [21]. The word embeddings are then input into deep neural networks, such as RNN, LSTM, and GRU, to generate a sentence-level representation and then a documentlevel representation, with which one can perform sentiment classifications.
Financial sentiment analysis helps investors make more accurate investing decisions by analyzing market sentiments with texts like Tweets or newspaper articles. They adapt standard sentiment techniques in the financial background. Loughran & Mcdonald [22] crafts a dictionary for financial terms and predicts whether a piece of news is “bullish” or “bearish,” similar to lexicon-based methods. Kraus & Feuerriegel [23] is one of the first works that predict stock price movements with deep learning methods. They apply an LSTM neural network to company announcements and demonstrate that deep neural networks are more accurate than traditional machine learning methods. FinBERT [24] adapts the revolutionary BERT model to financial-themed texts. Based on the pre-trained BERT model, the author further pre-trains it on a financial corpus and uses gradual freezing to prevent catastrophic forgetting. Experiments show improved results over existing models.
2.2. Challenges of sentiment analysis
The challenges of sentiment analysis can be divided into three categories: Pre-processing, scope and bias.
1) Pre-processing: The first challenge of the pre-processing lies in the heterogeneity of big data. Nowadays, big data has the characteristics of diversity (unstructured data). Generally, traditional sentiment classifiers deal with data from one source for example the company online review or company feedback records. However, in the era of big data, the sentiment classifiers should have the ability to handle diverse data from different data sources.
Another challenge is about invalid data and incomplete data. On social media, people constantly make irregular abbreviations and spelling mistakes. This phenomenon, known as data sparsity [25], has a negative effect on the accuracy of the sentiment classification. Moreover, many data (for example on social media sites) have limited accessibility due to privacy restrictions.
How to combine different types of data for sentiment analysis is also a challenge. Some messages on twitter may contain different kinds of information such as text, expression, video and so on. Analyzing these different kinds of information together will greatly improve the accuracy of the sentiment analysis system. Nevertheless, it is a challenge to construct such a semantic association based on models to fill the semantic gap between such heterogeneous data sources [26].
2) Scope: Solely using sentiment analysis has its limitations in a predictive framework. For example, some service industries may collect and analyze the sentiment of some customers on their products to further optimize their products to increase sales. However, sales volume is not only determined by customers’ preference. Factors like competitors’ information, country economic growth, consumer confidence index, and other factors may influence conclusive decisions [25]. Therefore, future research needs to combine sentiment analysis with these other factors to create a robust analysis framework.
3) Bias: Due to the influence of certain popular online users, bias is prevalent on social media [27]. The comments of some bloggers with a large number of followers will affect the comments of their fans. For example, a user (A) with a large number of followers posts a negative comment about product X, and a user (B) with few followers posts a positive comment about the same product. Statistically, we have the same number of positive and negative comments of product X, but in reality, the negative post should have more impact, since user A has more followers who can be influenced by his/her opinion compared to user B, who has few followers. Moreover, in many cases, the direct number of followers does not indicate high influence [28]. Therefore, future research should further investigate the influence of sentiment polarity within the connected networks of users.
On the other hand, some businesses or individuals will buy social bots and make a lot of favorable comments. Recently social bots have become sophisticated as well as threatening. The presence of social bots, especially in social media, can be a threat to online systems as well as to our society [29]. Two questions may arise: first, is the output of sentiment analysis based on the genuine opinion of the user or is it a bot-generated opinion? Second, to which extent can the social bot influence public opinion? Hence, in future research, these two questions must be investigated in order to know how the opinion is formed and to recognize how sentiment analysis should be designed to take this factor into consideration.
2.3. Other factors for asset price prediction
New features like “topic-sentiment” can improve the performance of stock market prediction [30]. The researchers used a combination of an existing topic model, the joint sentiment topic (JST) model [31], and their own proposed method to discover the topics covered in social media and the sentiment. The historical prices were derived from Yahoo Finance for the 18 stocks, and their message board data were collected from 18 message boards from Yahoo Finance Message Board. Their prediction revealed a 2.07% better result compared with using historical prices only. In addition, this paper demonstrated an evaluation of the effectiveness of multiple sentiment analysis methods. This is the first paper trying to do stock price prediction by extracting sentiments and topics simultaneously. However, they specified the number of topics for their LDA and JST models. Besides, their research only predicted a directional result of the stock price.
Big movements (big loss or gain) in the stock market can be used as labels in sentiment analysis [32]. Makrehchi et al. utilized them to label the unlabelled data from Twitter and built classifiers to predict future stock market prices. They used both supervised learning and unsupervised learning to take advantage of both methods- (i) using unlabelled tweets to generate training data automatically; (ii) using the data from the previous part to build classifiers. In their first method, they firstly marked any market event which has 3% higher than the return for S&P 500 as a good event and a 3% or lower as a bad market event. Meanwhile, they assumed that the tweets on a good day should be positive and those on a bad day should be negative. With these labeled data, they developed two classifiers which the first one used heuristic features and the other one employs a feature engineering task. Overall, their model, using 10-fold cross-validation, achieved precision and recall over 90%. However, they assumed that all tweets on a good day would be positive, despite considering the complexity of human sentiments on either a good or bad day. Additionally, they could develop more meticulous classifiers to further improve their precision and recall.
Financial news articles are often applied as a factor in stock price prediction [33]. Li et al. made use of financial news articles from FINET, which is an HK finance vendor, to make predictions on stock price with multiple sentiment analysis methods with a generic framework. To avoid any possible bias, they included two different sentiment dictionaries, explored various labeling methods, and made comparisons of the model’s performance on multiple levels. They discovered that the sentiment analysis model performed remarkably better than traditional bag-of-words methods. In addition, they revealed that the model using sentiment polarity worked not well on predicting stock price.
RSS (Really Simple Syndication) news feeds can also be leveraged to predict stock prices. Shri Bharathi and Angelina Geetha [34] designed and implemented a predictive system for guiding stock market investment. They combined both SENSEX index and RSS feeds for effective prediction. In their research process, RSS helped the system identify new opinions automatically. The experiment result indicates that the combination of SENSEX index and RSS is more efficient than existing algorithms.
It’s necessary to combine data mining techniques with NLP techniques in order to improve the accuracy of prediction. Ayman E. Khedr, S.E.Salama, and Nagwa Yaseen [35] achieved higher accuracy in the judgment of emotional polarity, and also gave a proper future trend of the stock market. They were not limited to the comparison between news polarity and actual stock prices, but added some applications of mathematical functions, which simplify the model and ensure the accuracy of the results. For example, Shynkevichl used the polynomial kernels on news categories, the satisfying results proved the feasibility of the creative method. However, the deficiency of their research is the limitation of time. The model just used the data of 5 previous days, which may cause instability of the result. Therefore, the whole process may need to refer to more data.
2.4. Machine learning methods
In recent years, with the rapid development of science and technology, artificial intelligence technology is widely used in stock price prediction. The application of machine learning in the financial field has become very necessary.
There are several kinds of machine learning applied in the financial field:(1) linear regression. For example, the traditional moving average method is used to fit the historical price of the stock, so as to analyze the future price of the stock [36-37]. Use the moving average tool to map and judge the fluctuation of stock price and obtain the trading signal of stock, so as to help investors make decisions [38]. (2) Prediction model. For example, Wang Jian [39] and others weighted the changes of stock historical volatility exponentially, so as to predict the development trend of stock price. Andradeet [40] proposed a prediction model combining discrete hidden Markov model and relative intensity index (RSI), which determines the development trend of stocks by judging the value of RSI. (3) Deep learning. San et al [41] used the deep learning technology long and short term memory (LSTM) to predict the stock price, which can capture the long-term correlation of stock data and improve the prediction accuracy. In order to predict the change trend and duration of stocks, Chen [42] proposed a method of extracting dual features using different time spans, and designed a dual attention mechanism using the encoder framework to predict the price trend of stocks. Lai [43] proposed the method of combining nonlinear cyclic neural network with traditional autoregressive model to predict the value of a certain time in the future in the time series, and used the model to predict the exchange rate, which has good historical memory function.
Among the above methods, the traditional regression fitting method is relatively simple, but lack of flexibility, while the method based on deep cyclic network is relatively complex, but has strong flexibility and interpretability. The above models adopt different depth network structures, which makes the historical data have selective memory function, reflecting that the use of neural network model is more flexible.
3. Data
3.1. Data collection
We choose six specific market sectors: Technology, Capital goods, Healthcare, Finance, Customer services, and Consumer, non-durables. For each market sector, eight stocks are selected as representatives, which are shown in Table 1.
For each of the stocks, tweets over a period of February 1st, 2020 to January 31st, 2022 are collected from Twitter to evaluate the public opinion. The Tweets are extracted with Selenium, an automated testing tool, and filtered with cashtags such as “$NVDA” and “$MSFT”. The total number of Tweets collected is 1,015,360. The stock opening and closing prices from February 1st, 2021, to January 31st, 2022, are obtained using Yahoo! Finance.
3.2. Data preprocessing
The dataset collected should be preprocessed to make it more reliable for future prediction tasks. First, the stock data collected is absent for weekends and other holidays when the market is closed, while the Twitter data is available for all days. Therefore, we fill in the gaps with a simple technique: Since the stock price generally follows a concave function, if the stock value on a day is x and the next value present is y, we approximate the first missing value after x to be (y+x)/2 and follow the same method till the gap is filled.
Next, Tweets often include special characters like # representing a hashtag and @ mentioning other users. Before they are tokenized, we remove the ‘#’ characters and replace all the ‘@’ mentions with a token @user. For example, #Apple is deleted and @jack with @user. For HTTP URLs in Tweets, we simply delete them. Also, for the retweet part in a Tweet, they are separated out and analyzed individually. Finally, the excessive spaces in the Tweets are deleted. This way, the Tweets are ready for sentiment analysis. Example Tweets that are processed are shown in Table 2.
4. Methods
4.1. Task definition
Given the Tweets about stocks in different market sectors, MLStock aims to use the historical sentiment information extracted from Tweets before a specific day to predict the stock price changes on that day. Formally, let K be the set of stocks, Ut,k be the set of utterances at day t about stock k, we predict the price changes of each stock k ∈ K at day t′, ∆pt′,k, with all historical Tweets prior to t′, namely, Uk∈K Ut,k. Market sectors {E1,E2,...,EC} are a manually-specified partitions on K, with each stock in one market sector, and the intersection of any two distinct market sectors is empty. Considering a market sector and the overall market climate can lead to price changes in the individual stock, our framework consists of five main stages:
Table 1. Representative stocks from six market sectors.
Technology | Capital Goods | Health Care | Finance | Customer Services | Consumer Non-durables |
MSFT | TSLA | UNH | JPM | AMZN | KO |
GOOG | TM | JNJ | BAC | WMT | PEP |
NVDA | LMT | PFE | MS | HD | NKE |
TSM | AMAT | ABBV | SCHW | COST | PM |
FB | DE | LLY | HSBC | MCD | SONY |
ASML | BA | DHR | AXP | T | UL |
AVGO | CAT | NVS | C | NFLX | EL |
CSCO | F | MRK | GS | LOW | BUD |
Table 2. Example tweets from the dataset.
Timestamp | Text |
2020-02-04 08:16:34 | This is good for ... Operationally and PR wise! |
2020-02-06 05:11:19 | I think this is a good buy IMO. It still has the gap to fill and it has been building a bullish channel. Even if it breaks to the downside I still think it would be a false breakdown. |
2020-02-06 16:02:48 | Facebook has sent a cease-and-desist letter to facial recognition startup Clearview AI for scraping billions of photos. Facebook has demanded that Clearview stop accessing or using information from its platforms after it scraped billions of images without permission. |
2020-02-08 06:21:21 | closed green today. 4hour chart watch for a break abov 213.50, will run toward 219. daily oversold rsi curling up. fb rests upon strong support here. |
2020-02-08 19:24:48 | I’m anxious for next week. I think it will be a great week for those who are long in Elastic ( ) after months of downside and accumulation!! |
1) Context independent feature extraction from pretrained transformer language models.
2) Obtain stock state for stock k at day t, st,k, through
3) Ut,k.
4) Obtain sector state for sector c at day t, et,c, through stock states st,k that k ∈ Ec.
5) Obtain market state at day t, mt, through all sector states et,c.
6) Predict the stock price changes for stock k in day t+1 through st,k ⊕ et,c ⊕ mt.
The overall architecture of the MLStock framework is shown in Figure 1.
4.2. Utterance feature extraction
In MLStock, the feature of each utterance can be extracted by BERT [19], a transformer-based language model. In our instance, its architecture has 12 layers of transformer block with a hidden size of 768 and 12 self-attention heads, resulting in a total of 110M trainable parameters. We fine-tune the pretrained BERT model by appending a special token [CLS] at the beginning of each utterance and train the model to predict the stock price without context. Once the model has been fine-tuned, we pass the [CLS] appended tokenized utterances and extract the activation from the last layer corresponding to the [CLS] token. The feature vector has a dimension of 768.
4.3. MLStock model
First we introduce the notations of the MLStock model. Each Tweet is an utterance u, and we denote the set of utterances made at day t for stock k Ut,k, and Ut,k = {ut,k,1,ut,k,2,...,ut,k,N}. For each utterance, we denote the BERT vector xt,k,i, and the BERT matrix for a set of utterances Xt,k correspondingly.
A stock state, sector state, and market state are used to model the market sentiment at different layer. They are denoted as st,k, et,c, and mt for day t, stock k, and sector c. The stock state is used to capture the market sentiment on the specified stock itself, which is necessary since different stocks, even though in the same sector, can have differing market prospects. The sector state and market state can offer us more insight, as it takes time for the sentiment of the sector to affect individual stocks. In our framework, all three states are modeled using unidirectional GRU cells [13], which can adapt to different number of inputs for each time period, and can selectively retain information from the past. As is shown in Figure 1, there is a GRU cell for each stock k, GRUSk, for each market sector c, GRUEc, and for the whole market GRUM.
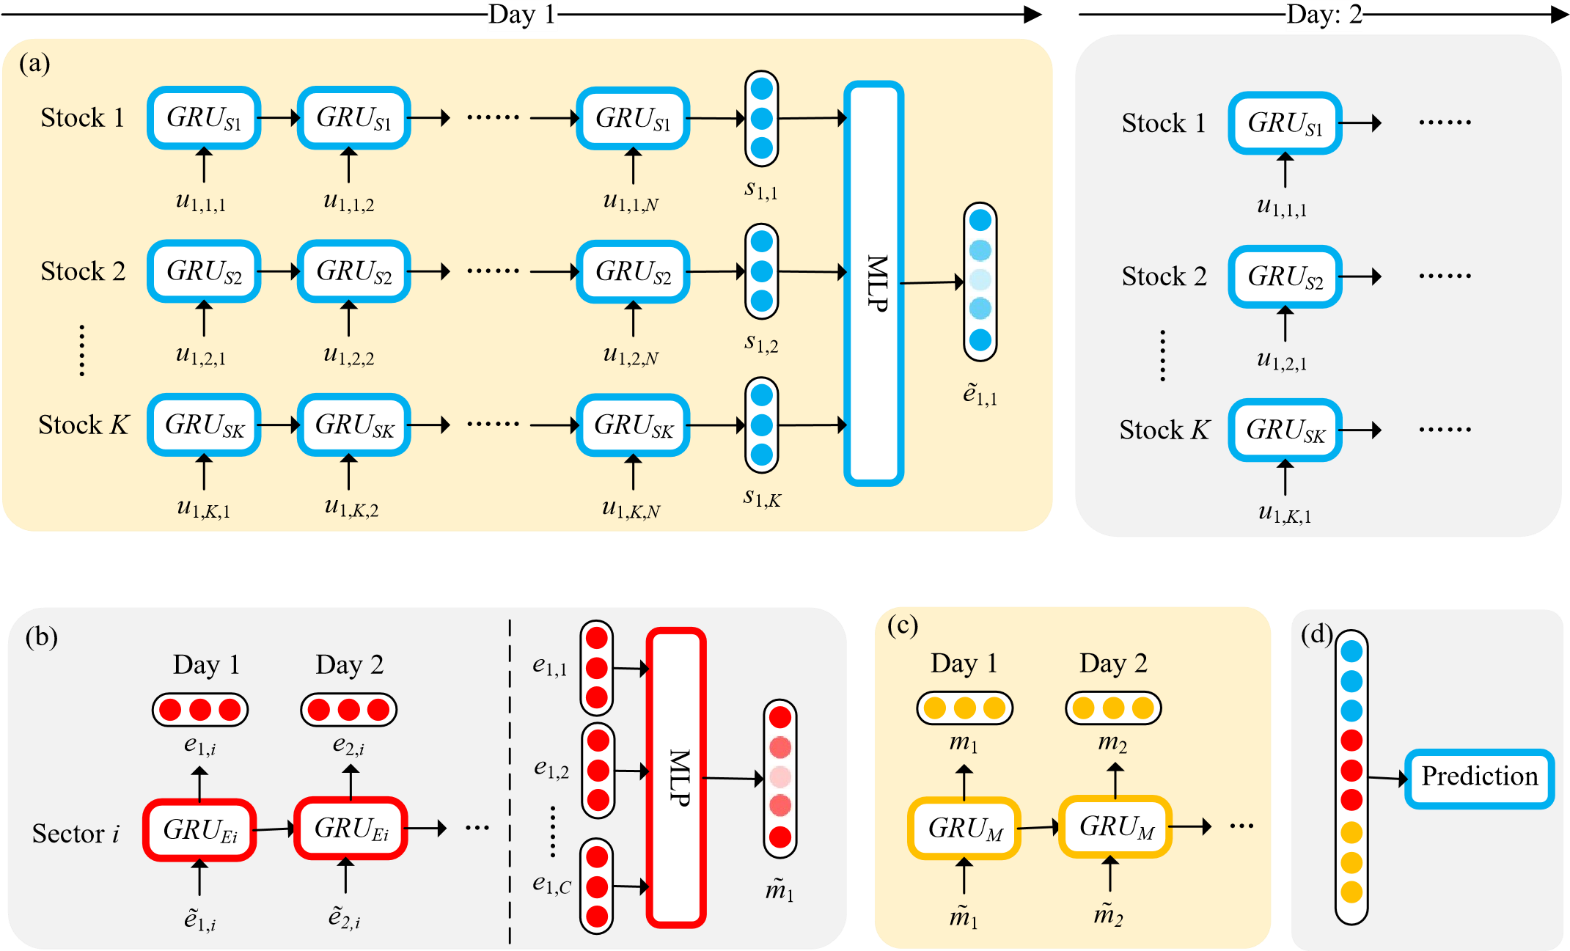
Figure 1. The architecture of the MLStock framework. (a) describes the network that generates the stock state, (b) for the sector state, (c) for the market state, and (d) illustrates that the three states are concatenated for the price prediction task.
1) Stock state: The stock state stores the information about the market sentiment about individual stocks. It is updated with the GRU cell GRUSk for stock k. During each day t, for each utterance i about stock k, we update and gain a stock state st,k,i with the representation of the utterance xt,k,i. When i = 0, we use st−1,k as st,k,0. When every utterance for day t is fed into GRUSk, we take the last state as st,k.
st,k,i = GRUSk(xt,k,i,st,k,i−1)(1)
Let St,c be the matrix of all stock states in the market sector Ec. As the impact of stocks on the market varies, a Multi-Layer Perceptron (MLP) is used to differentiate between them and output a candidate sector state (e˜) which is used later.
e˜t,c = MLP(St,c)(2)
2) Sector state: The sector state represents the market sentiment at a higher layer. It is modeled with the GRU cell GRUEc for market sector c. For each day t, the sector state is updated with the candidate sector state.
et,c = GRUEc(e˜t,c,et−1,c)(3)
Similarly, after all the sector states for each day are collected, an MLP is used to extract a candidate market sentiment (m˜ ) to facilitate the calculation of the market state. Let Et be the matrix of all sector states for day t, we have
m˜ t = MLP(Et).(4)
3) Market state: The market state represents the sentiment of the whole market. For each day t, the candidate market state is fed into the GRU cell GRUM to output the market state:
mt = GRUM (m˜ t,mt−1). (5)
4) Stock Price Prediction: Finally, we predict the changes in the stock price by concatenating the three states together and run a linear regression. The loss function is the sum of the Mean Squared Error (MSE) for each stock.
\( {C_{t,k}}={s_{t,k}}⊕{e_{t,c}}⊕{m_{t}} \) (6)
\( Δ{\widetilde{p}_{t+1,k}}={W_{{C_{t,k}}}}+b \) (7)
\( L=\frac{1}{|K|}\sum _{k∈K}{(∆{p_{t+1,k}}-∆{\widetilde{p}_{t+1,k}})^{2}} \) (8)
5. Results and analysi
In this section, we report the performance of our proposed methods in comparison to other state-of-the-art methods.
5.1. Experiment setup
The stock market prices are labeled as up and down by calculating the differences of two market days adjusted close price. These directional labels are represented by 0, representing “fall”, and 1, representing “rise”. In this research, the algorithms are utilized to make such directional predictions.
Each algorithm generates a result predicting the stock price under each of the three states: stock state, sector state, and market state. The performance of each algorithm will be evaluated by its precision, recall, and accuracy.
5.2. Experiment results
Table 3. Comparison of results against various methods.
Technology | Capital Goods | Healthcare | Finance | Customer Services | Consumer Non-durables | All | |
Logistic Regression | 0.323 | 0.402 | 0.301 | 0.38 | 0.382 | 0.41 | 0.394 |
Naive Bayes | 0.388 | 0.455 | 0.41 | 0.44 | 0.422 | 0.43 | 0.439 |
Support Vector Machine | 0.46 | 0.49 | 0.43 | 0.511 | 0.49 | 0.46 | 0.487 |
MLStock | 0.485 | 0.514 | 0.493 | 0.45 | 0.5 | 0.516 | 0.493 |
As a comparison to the MLStock, multiple machine learning algorithms are introduced in this research. Logistic Regression is leveraged to predict the stock price as a baseline in comparison with other algorithms. Na¨ıve Bayes and Support Vector Machine (SVM) are also utilized in predicting the stock price.
The performance for each algorithm is listed in Table 3. To make a more noticeable comparison, only the accuracies of the four listed methods on the six market sectors are presented (Complete experiment data are shown in Table 4).
Table 4. Complete experiment data of machine learning methods.
Machine Learning Methods | |||
Logistic Regression | Naive Bayes | Support Vector Machine | |
UMH | 0.348 | 0.493 | 0.493 |
JNJ | 0.36 | 0.489 | 0.49 |
PFE | 0.37 | 0.487 | 0.486 |
ABBV | 0.519 | 0.401 | 0.54 |
LLY | 0.318 | 0.486 | 0.49 |
DHR | 0.318 | 0.438 | 0.438 |
NVS | 0.33 | 0.48 | 0.487 |
MRK | 0.32 | 0.44 | 0.44 |
Sector: Health Care | 0.301 | 0.41 | 0.43 |
MSFT | 0.48 | 0.41 | 0.481 |
GOOG | 0.462 | 0.44 | 0.44 |
NVDA | 0.441 | 0.39 | 0.493 |
TSM | 0.45 | 0.455 | 0.49 |
FB | 0.33 | 0.438 | 0.501 |
ASML | 0.36 | 0.481 | 0.5 |
AVGO | 0.31 | 0.468 | 0.522 |
CSCO | 0.388 | 0.4 | 0.51 |
Sector: Technology | 0.323 | 0.388 | 0.46 |
TSLA | 0.501 | 0.41 | 0.481 |
TM | 0.41 | 0.44 | 0.44 |
LMT | 0.45 | 0.39 | 0.493 |
AMAT | 0.37 | 0.455 | 0.49 |
DE | 0.412 | 0.438 | 0.501 |
BA | 0.377 | 0.481 | 0.5 |
CAT | 0.36 | 0.468 | 0.522 |
F | 0.47 | 0.4 | 0.51 |
Sector: Capital Goods | 0.402 | 0.455 | 0.49 |
JPM | 0.44 | 0.41 | 0.481 |
BAC | 0.401 | 0.44 | 0.44 |
MS | 0.37 | 0.39 | 0.493 |
SCHW | 0.41 | 0.455 | 0.49 |
HSBC | 0.37 | 0.438 | 0.501 |
AXP | 0.36 | 0.481 | 0.5 |
C | 0.48 | 0.468 | 0.522 |
GS | 0.421 | 0.4 | 0.51 |
Sector: Finance | 0.38 | 0.44 | 0.511 |
AMZN | 0.388 | 0.48 | 0.5 |
WMT | 0.51 | 0.37 | 0.52 |
HD | 0.401 | 0.41 | 0.44 |
COST | 0.46 | 0.433 | 0.513 |
MCD | 0.377 | 0.44 | 0.51 |
T | 0.38 | 0.42 | 0.477 |
NFLX | 0.33 | 0.48 | 0.48 |
LOW | 0.39 | 0.408 | 0.43 |
Sector: Customer Services | 0.382 | 0.422 | 0.49 |
KO | 0.44 | 0.38 | 0.45 |
PEP | 0.43 | 0.442 | 0.44 |
NKE | 0.372 | 0.476 | 0.501 |
PM | 0.38 | 0.472 | 0.48 |
SONY | 0.388 | 0.42 | 0.52 |
UL | 0.33 | 0.49 | 0.511 |
EL | 0.381 | 0.44 | 0.526 |
BUD | 0.41 | 0.411 | 0.5 |
Sector: Customer Non-durables | 0.41 | 0.43 | 0.46 |
Average | 0.393907407 | 0.438462963 | 0.487296296 |
The best result of each column is in bold. It is shown that the MLStock shows improvement on all market sectors other than Finance, and reaches the best overall performance over traditional machine learning models. However, the accuracy is still approximately 0.5, making it impractical to be utilized as valuable investing advice. Next are a few factors that may be responsible for the unsatisfactory model performance:
1) Imbalanced data & Lack of Quality Data: Due to the limitations of the Twitter platform, it is challenging to build a robust dataset based on tweets. First, only a handful of stocks garner enough attention. In our data, 45,609 tweets are related to HSBC, while EL (The Estee Lauder Companies) only has 4,916 tweets. Moreover, the data needs extensive pre-processing, as a large proportion of stocks are irrelevant, only listing the name of stocks without further explanation. Therefore, despite the large number of tweets we collected, the useful information drawn from them is still limited.
2) Weak Connection Between Twitter Sentiment and Stocks: The paper is based on the assumption that Twitter sentiments are linked to fluctuations in the stock market. However, given the performance (even after we have pruned tweets with neutral sentiments), we suspect that tweets can, at best, be used as auxiliary data sources instead of primary ones as we have done in the paper.
6. Future works
Looking forward, further attempts could prove quite beneficial to the literature. Specifically, we plan to work on the following aspects to improve the performance of our model:
1) Injecting More Features: As is stated in Section V-B, Twitter sentiments are likely to be a weak indicator of stock market activities. Therefore, we expect to see a rise in prediction accuracy after more features are included, such as opening prices, closing prices, and trading volume. Other Twitter statistics, including the number of followers, likes, and retweets, can be used as well.
2) Scraping More Valuable Texts: Rather than tweets which needs extensive cleaning, news articles or blog articles from well-known authors should be more information dense. For further improvement, those sources can be integrated into our model.
3) Toward Real-Time Trading: Our model predicts the direction of stocks on the next day, which does not meet the standard of real-time trading. To utilize our model in a real-time situation, the tweets should be extracted and cleaned in real time and lifelong learning (LL) techniques can be employed to keep the model updated. Considering the economic benefits it can bring, real-time trading with machine learning models is a research-worthy topic despite its difficulty.
7. Conclusion
In this work, we present MLStock, a multi-layer framework that models the market sentiment with the stock layer, the sector layer, and the market layer using the Gated Recurrent Unit (GRU). The modeled sentiment is then used to predict the direction of stocks on the next day. Using the GRU, our model can selectively retain information from the past and summarize the sector and market states through individual states, thus reaching higher accuracy. Experiments have shown improved performance over traditional machine learning methods, but future works are needed before it can provide practical investing advice.
References
[1]. D. Murthy, Twitter. Polity Press Cambridge, 2018.
[2]. C. E. Yoshinaga and F. H. F. d. Castro Junior, “The relationship between market sentiment index and stock rates of return: a panel data analysis,” BAR - Brazilian Administration Review, vol. 9, no. 2, pp. 189–210, Jun. 2012.
[3]. C. Zhang, “Defining, Modeling, and Measuring Investor Sentiment,” University of California, Berkeley, Department of Economics, p. 43, 2008.
[4]. N. Barberis, A. Mukherjee, and B. Wang, “Prospect Theory and Stock Returns: An Empirical Test,” The Review of Financial Studies, vol. 29, no. 11, pp. 3068–3107, Nov. 2016.
[5]. S. Ebert and P. Strack, “Until the Bitter End: On Prospect Theory in a Dynamic Context,” American Economic Review, vol. 105, no. 4, pp. 1618–1633, Apr. 2015.
[6]. E. F. Fama, “Efficient capital markets: A review of theory and empirical work,” The journal of Finance, vol. 25, no. 2, pp. 383–417, 1970.
[7]. Mittal and A. Goel, “Stock Prediction Using Twitter Sentiment Analysis,” p. 5.
[8]. V. S. Pagolu, K. N. R. Challa, G. Panda, and B. Majhi, “Sentiment Analysis of Twitter Data for Predicting Stock Market Movements,” arXiv:1610.09225 [cs], Oct. 2016, arXiv: 1610.09225.
[9]. J. Bollen, H. Mao, and X.-J. Zeng, “Twitter mood predicts the stock market,” Journal of Computational Science, vol. 2, no. 1, pp. 1–8, Mar. 2011, arXiv: 1010.3003.
[10]. H. Chen, G. Noronha, and V. Singal, “The price response to s&p 500 index additions and deletions: Evidence of asymmetry and a new explanation,” The Journal of Finance, vol. 59, no. 4, pp. 1901–1930, 2004.
[11]. M. Vijh, “S&p 500 trading strategies and stock betas,” The Review of Financial Studies, vol. 7, no. 1, pp. 215–251, 1994.
[12]. P. Yu and X. Yan, “Stock price prediction based on deep neural networks,” Neural Computing and Applications, vol. 32, no. 6, pp. 1609– 1628, Mar. 2020.
[13]. K. Cho, B. Van Merrienboer, D. Bahdanau, and Y. Bengio, “On the¨ properties of neural machine translation: Encoder-decoder approaches,” arXiv preprint arXiv:1409.1259, 2014.
[14]. Yadollahi, A. G. Shahraki, and O. R. Zaiane, “Current State of Text Sentiment Analysis from Opinion to Emotion Mining,” ACM Computing Surveys, vol. 50, no. 2, pp. 1–33, Mar. 2018.
[15]. Y. R. Tausczik and J. W. Pennebaker, “The Psychological Meaning of Words: LIWC and Computerized Text Analysis Methods,” Journal of Language and Social Psychology, vol. 29, no. 1, pp. 24–54, Mar. 2010. [16] S. Baccianella, A. Esuli, and F. Sebastiani, “SENTIWORDNET 3.0: An Enhanced Lexical Resource for Sentiment Analysis and Opinion Mining,” in Proceedings of the Seventh International Conference on Language Resources and Evaluation (LREC’10), 2010, p. 5.
[16]. C. Hutto and E. Gilbert, “VADER: A Parsimonious Rule-Based Model for Sentiment Analysis of Social Media Text,” Proceedings of the International AAAI Conference on Web and Social Media, vol. 8, no. 1, pp. 216–225, May 2014, number: 1.
[17]. T. Mikolov, K. Chen, G. Corrado, and J. Dean, “Efficient Estimation of Word Representations in Vector Space,” arXiv:1301.3781 [cs], Sep. 2013, arXiv: 1301.3781.
[18]. J. Devlin, M.-W. Chang, K. Lee, and K. Toutanova, “BERT: Pretraining of Deep Bidirectional Transformers for Language Understanding,” arXiv:1810.04805 [cs], May 2019, arXiv: 1810.04805.
[19]. T. B. Brown, B. Mann, N. Ryder, M. Subbiah, J. Kaplan, P. Dhariwal, A. Neelakantan, P. Shyam, G. Sastry, A. Askell, S. Agarwal, A. Herbert-Voss, G. Krueger, T. Henighan, R. Child, A. Ramesh, D. M. Ziegler, J. Wu, C. Winter, C. Hesse, M. Chen, E. Sigler, M. Litwin
[20]. S. Gray, B. Chess, J. Clark, C. Berner, S. McCandlish, A. Radford, I. Sutskever, and D. Amodei, “Language Models are Few-Shot Learners,” arXiv:2005.14165 [cs], Jul. 2020, arXiv: 2005.14165.
[21]. Z. Yang, Z. Dai, Y. Yang, J. Carbonell, R. Salakhutdinov, and Q. V. Le, “XLNet: Generalized Autoregressive Pretraining for Language Understanding,” arXiv:1906.08237 [cs], Jan. 2020, arXiv: 1906.08237.
[22]. T. Loughran and B. Mcdonald, “When Is a Liability Not a Liability? Textual Analysis, Dictionaries, and 10-Ks,” The Journal of Finance, vol. 66, no. 1, pp. 35–65, Feb. 2011.
[23]. M. Kraus and S. Feuerriegel, “Decision support from financial disclosures with deep neural networks and transfer learning,” Decision Support Systems, vol. 104, pp. 38–48, Dec. 2017, arXiv: 1710.03954.
[24]. D. Araci, “FinBERT: Financial Sentiment Analysis with Pre-trained Language Models,” arXiv:1908.10063 [cs], Aug. 2019, arXiv: 1908.10063.
[25]. Giachanou and F. Crestani, “Like It or Not: A Survey of Twitter Sentiment Analysis Methods,” ACM Computing Surveys, vol. 49, no. 2, pp. 28:1–28:41, Jun. 2016.
[26]. Xindong Wu, Xingquan Zhu, Gong-Qing Wu, and Wei Ding, “Data mining with big data,” IEEE Transactions on Knowledge and Data Engineering, vol. 26, no. 1, pp. 97–107, Jan. 2014.
[27]. T.-P. Liang, X. Li, C.-T. Yang, and M. Wang, “What in Consumer Reviews Affects the Sales of Mobile Apps: A Multifacet Sentiment Analysis Approach,” International Journal of Electronic Commerce, vol. 20, no. 2, pp. 236–260, Dec. 2015.
[28]. D. Kim, D. Kim, E. Hwang, and H.-G. Choi, “A user opinion and metadata mining scheme for predicting box office performance of movies in the social network environment,” New Review of Hypermedia and Multimedia, vol. 19, no. 3-4, pp. 259–272, Dec. 2013. [Online]. Available: https://doi.org/10.1080/13614568.2013.835450
[29]. E. Ferrara, O. Varol, C. Davis, F. Menczer, and A. Flammini, “The Rise of Social Bots,” Communications of the ACM, vol. 59, no. 7, pp. 96–104, Jun. 2016, arXiv: 1407.5225.
[30]. T. H. Nguyen, K. Shirai, and J. Velcin, “Sentiment analysis on social media for stock movement prediction,” Expert Systems with Applications, vol. 42, no. 24, pp. 9603–9611, Dec. 2015.
[31]. C. Lin and Y. He, “Joint sentiment/topic model for sentiment analysis,” in Proceedings of the 18th ACM conference on Information and knowledge management, ser. CIKM ’09. New York, NY, USA: Association for Computing Machinery, Nov. 2009, pp. 375–384.
[32]. M. Makrehchi, S. Shah, and W. Liao, “Stock Prediction Using EventBased Sentiment Analysis,” in 2013 IEEE/WIC/ACM International Joint Conferences on Web Intelligence (WI) and Intelligent Agent Technologies (IAT), vol. 1, Nov. 2013, pp. 337–342.
[33]. X. Li, H. Xie, L. Chen, J. Wang, and X. Deng, “News impact on stock price return via sentiment analysis,” Knowledge-Based Systems, vol. 69, pp. 14–23, Oct. 2014.
[34]. S. Bharathi and A. Geetha, “Sentiment analysis for effective stock market prediction,” International Journal of Intelligent Engineering and Systems, vol. 10, no. 3, pp. 146–154, 2017.
[35]. E. Khedr, N. Yaseen et al., “Predicting stock market behavior using data mining technique and news sentiment analysis,” International Journal of Intelligent Systems and Applications, vol. 9, no. 7, p. 22, 2017.
[36]. [R. Gencay, “Non-linear prediction of security returns with moving average rules,” Journal of Forecasting, vol. 15, no. 3, pp. 165–174, 1996.
[37]. S. M. Idrees, M. A. Alam, and P. Agarwal, “A prediction approach for stock market volatility based on time series data,” IEEE Access, vol. 7, pp. 17287–17298, 2019.
[38]. S. D. Vashishtha, U. Singh, and R. Kumar, “Prediction of buy and sell signals using a moving average-tool of technical analysis,” International Journal of Marketing Financial Services & Management Research, 2013.
[39]. J. Wang and J. Kim, “Predicting stock price trend using macd optimized by historical volatility,” Mathematical Problems in Engineering, vol. 2018, no. PT.17, pp. 9280590.1–9280590.12, 2018.
[40]. L. Andrade, “Stock market index trading algorithm using discrete hidden markov models and technical analysis,” 2017.
[41]. T. Sanboon, K. Keatruangkamala, and S. Jaiyen, “A deep learning model for predicting buy and sell recommendations in stock exchange of thailand using long short-term memory,” in 2019 IEEE 4th International Conference on Computer and Communication Systems (ICCCS), 2019.
[42]. Y. Chen, W. Lin, and J. Z. Wang, “A dual-attention-based stock price trend prediction model with dual features,” IEEE Access, vol. PP, no. 99, pp. 1–1, 2019.
[43]. G. Lai, W. C. Chang, Y. Yang, and H. Liu, “Modeling long- and shortterm temporal patterns with deep neural networks,” ACM, 2018.
Cite this article
Xu,T.;Xiang,Z.;Lu,B.;Chen,N.;Dai,Z. (2023). MLStock: Multi-layer model for sentiment analysis based stock price prediction. Applied and Computational Engineering,2,162-175.
Data availability
The datasets used and/or analyzed during the current study will be available from the authors upon reasonable request.
Disclaimer/Publisher's Note
The statements, opinions and data contained in all publications are solely those of the individual author(s) and contributor(s) and not of EWA Publishing and/or the editor(s). EWA Publishing and/or the editor(s) disclaim responsibility for any injury to people or property resulting from any ideas, methods, instructions or products referred to in the content.
About volume
Volume title: Proceedings of the 4th International Conference on Computing and Data Science (CONF-CDS 2022)
© 2024 by the author(s). Licensee EWA Publishing, Oxford, UK. This article is an open access article distributed under the terms and
conditions of the Creative Commons Attribution (CC BY) license. Authors who
publish this series agree to the following terms:
1. Authors retain copyright and grant the series right of first publication with the work simultaneously licensed under a Creative Commons
Attribution License that allows others to share the work with an acknowledgment of the work's authorship and initial publication in this
series.
2. Authors are able to enter into separate, additional contractual arrangements for the non-exclusive distribution of the series's published
version of the work (e.g., post it to an institutional repository or publish it in a book), with an acknowledgment of its initial
publication in this series.
3. Authors are permitted and encouraged to post their work online (e.g., in institutional repositories or on their website) prior to and
during the submission process, as it can lead to productive exchanges, as well as earlier and greater citation of published work (See
Open access policy for details).
References
[1]. D. Murthy, Twitter. Polity Press Cambridge, 2018.
[2]. C. E. Yoshinaga and F. H. F. d. Castro Junior, “The relationship between market sentiment index and stock rates of return: a panel data analysis,” BAR - Brazilian Administration Review, vol. 9, no. 2, pp. 189–210, Jun. 2012.
[3]. C. Zhang, “Defining, Modeling, and Measuring Investor Sentiment,” University of California, Berkeley, Department of Economics, p. 43, 2008.
[4]. N. Barberis, A. Mukherjee, and B. Wang, “Prospect Theory and Stock Returns: An Empirical Test,” The Review of Financial Studies, vol. 29, no. 11, pp. 3068–3107, Nov. 2016.
[5]. S. Ebert and P. Strack, “Until the Bitter End: On Prospect Theory in a Dynamic Context,” American Economic Review, vol. 105, no. 4, pp. 1618–1633, Apr. 2015.
[6]. E. F. Fama, “Efficient capital markets: A review of theory and empirical work,” The journal of Finance, vol. 25, no. 2, pp. 383–417, 1970.
[7]. Mittal and A. Goel, “Stock Prediction Using Twitter Sentiment Analysis,” p. 5.
[8]. V. S. Pagolu, K. N. R. Challa, G. Panda, and B. Majhi, “Sentiment Analysis of Twitter Data for Predicting Stock Market Movements,” arXiv:1610.09225 [cs], Oct. 2016, arXiv: 1610.09225.
[9]. J. Bollen, H. Mao, and X.-J. Zeng, “Twitter mood predicts the stock market,” Journal of Computational Science, vol. 2, no. 1, pp. 1–8, Mar. 2011, arXiv: 1010.3003.
[10]. H. Chen, G. Noronha, and V. Singal, “The price response to s&p 500 index additions and deletions: Evidence of asymmetry and a new explanation,” The Journal of Finance, vol. 59, no. 4, pp. 1901–1930, 2004.
[11]. M. Vijh, “S&p 500 trading strategies and stock betas,” The Review of Financial Studies, vol. 7, no. 1, pp. 215–251, 1994.
[12]. P. Yu and X. Yan, “Stock price prediction based on deep neural networks,” Neural Computing and Applications, vol. 32, no. 6, pp. 1609– 1628, Mar. 2020.
[13]. K. Cho, B. Van Merrienboer, D. Bahdanau, and Y. Bengio, “On the¨ properties of neural machine translation: Encoder-decoder approaches,” arXiv preprint arXiv:1409.1259, 2014.
[14]. Yadollahi, A. G. Shahraki, and O. R. Zaiane, “Current State of Text Sentiment Analysis from Opinion to Emotion Mining,” ACM Computing Surveys, vol. 50, no. 2, pp. 1–33, Mar. 2018.
[15]. Y. R. Tausczik and J. W. Pennebaker, “The Psychological Meaning of Words: LIWC and Computerized Text Analysis Methods,” Journal of Language and Social Psychology, vol. 29, no. 1, pp. 24–54, Mar. 2010. [16] S. Baccianella, A. Esuli, and F. Sebastiani, “SENTIWORDNET 3.0: An Enhanced Lexical Resource for Sentiment Analysis and Opinion Mining,” in Proceedings of the Seventh International Conference on Language Resources and Evaluation (LREC’10), 2010, p. 5.
[16]. C. Hutto and E. Gilbert, “VADER: A Parsimonious Rule-Based Model for Sentiment Analysis of Social Media Text,” Proceedings of the International AAAI Conference on Web and Social Media, vol. 8, no. 1, pp. 216–225, May 2014, number: 1.
[17]. T. Mikolov, K. Chen, G. Corrado, and J. Dean, “Efficient Estimation of Word Representations in Vector Space,” arXiv:1301.3781 [cs], Sep. 2013, arXiv: 1301.3781.
[18]. J. Devlin, M.-W. Chang, K. Lee, and K. Toutanova, “BERT: Pretraining of Deep Bidirectional Transformers for Language Understanding,” arXiv:1810.04805 [cs], May 2019, arXiv: 1810.04805.
[19]. T. B. Brown, B. Mann, N. Ryder, M. Subbiah, J. Kaplan, P. Dhariwal, A. Neelakantan, P. Shyam, G. Sastry, A. Askell, S. Agarwal, A. Herbert-Voss, G. Krueger, T. Henighan, R. Child, A. Ramesh, D. M. Ziegler, J. Wu, C. Winter, C. Hesse, M. Chen, E. Sigler, M. Litwin
[20]. S. Gray, B. Chess, J. Clark, C. Berner, S. McCandlish, A. Radford, I. Sutskever, and D. Amodei, “Language Models are Few-Shot Learners,” arXiv:2005.14165 [cs], Jul. 2020, arXiv: 2005.14165.
[21]. Z. Yang, Z. Dai, Y. Yang, J. Carbonell, R. Salakhutdinov, and Q. V. Le, “XLNet: Generalized Autoregressive Pretraining for Language Understanding,” arXiv:1906.08237 [cs], Jan. 2020, arXiv: 1906.08237.
[22]. T. Loughran and B. Mcdonald, “When Is a Liability Not a Liability? Textual Analysis, Dictionaries, and 10-Ks,” The Journal of Finance, vol. 66, no. 1, pp. 35–65, Feb. 2011.
[23]. M. Kraus and S. Feuerriegel, “Decision support from financial disclosures with deep neural networks and transfer learning,” Decision Support Systems, vol. 104, pp. 38–48, Dec. 2017, arXiv: 1710.03954.
[24]. D. Araci, “FinBERT: Financial Sentiment Analysis with Pre-trained Language Models,” arXiv:1908.10063 [cs], Aug. 2019, arXiv: 1908.10063.
[25]. Giachanou and F. Crestani, “Like It or Not: A Survey of Twitter Sentiment Analysis Methods,” ACM Computing Surveys, vol. 49, no. 2, pp. 28:1–28:41, Jun. 2016.
[26]. Xindong Wu, Xingquan Zhu, Gong-Qing Wu, and Wei Ding, “Data mining with big data,” IEEE Transactions on Knowledge and Data Engineering, vol. 26, no. 1, pp. 97–107, Jan. 2014.
[27]. T.-P. Liang, X. Li, C.-T. Yang, and M. Wang, “What in Consumer Reviews Affects the Sales of Mobile Apps: A Multifacet Sentiment Analysis Approach,” International Journal of Electronic Commerce, vol. 20, no. 2, pp. 236–260, Dec. 2015.
[28]. D. Kim, D. Kim, E. Hwang, and H.-G. Choi, “A user opinion and metadata mining scheme for predicting box office performance of movies in the social network environment,” New Review of Hypermedia and Multimedia, vol. 19, no. 3-4, pp. 259–272, Dec. 2013. [Online]. Available: https://doi.org/10.1080/13614568.2013.835450
[29]. E. Ferrara, O. Varol, C. Davis, F. Menczer, and A. Flammini, “The Rise of Social Bots,” Communications of the ACM, vol. 59, no. 7, pp. 96–104, Jun. 2016, arXiv: 1407.5225.
[30]. T. H. Nguyen, K. Shirai, and J. Velcin, “Sentiment analysis on social media for stock movement prediction,” Expert Systems with Applications, vol. 42, no. 24, pp. 9603–9611, Dec. 2015.
[31]. C. Lin and Y. He, “Joint sentiment/topic model for sentiment analysis,” in Proceedings of the 18th ACM conference on Information and knowledge management, ser. CIKM ’09. New York, NY, USA: Association for Computing Machinery, Nov. 2009, pp. 375–384.
[32]. M. Makrehchi, S. Shah, and W. Liao, “Stock Prediction Using EventBased Sentiment Analysis,” in 2013 IEEE/WIC/ACM International Joint Conferences on Web Intelligence (WI) and Intelligent Agent Technologies (IAT), vol. 1, Nov. 2013, pp. 337–342.
[33]. X. Li, H. Xie, L. Chen, J. Wang, and X. Deng, “News impact on stock price return via sentiment analysis,” Knowledge-Based Systems, vol. 69, pp. 14–23, Oct. 2014.
[34]. S. Bharathi and A. Geetha, “Sentiment analysis for effective stock market prediction,” International Journal of Intelligent Engineering and Systems, vol. 10, no. 3, pp. 146–154, 2017.
[35]. E. Khedr, N. Yaseen et al., “Predicting stock market behavior using data mining technique and news sentiment analysis,” International Journal of Intelligent Systems and Applications, vol. 9, no. 7, p. 22, 2017.
[36]. [R. Gencay, “Non-linear prediction of security returns with moving average rules,” Journal of Forecasting, vol. 15, no. 3, pp. 165–174, 1996.
[37]. S. M. Idrees, M. A. Alam, and P. Agarwal, “A prediction approach for stock market volatility based on time series data,” IEEE Access, vol. 7, pp. 17287–17298, 2019.
[38]. S. D. Vashishtha, U. Singh, and R. Kumar, “Prediction of buy and sell signals using a moving average-tool of technical analysis,” International Journal of Marketing Financial Services & Management Research, 2013.
[39]. J. Wang and J. Kim, “Predicting stock price trend using macd optimized by historical volatility,” Mathematical Problems in Engineering, vol. 2018, no. PT.17, pp. 9280590.1–9280590.12, 2018.
[40]. L. Andrade, “Stock market index trading algorithm using discrete hidden markov models and technical analysis,” 2017.
[41]. T. Sanboon, K. Keatruangkamala, and S. Jaiyen, “A deep learning model for predicting buy and sell recommendations in stock exchange of thailand using long short-term memory,” in 2019 IEEE 4th International Conference on Computer and Communication Systems (ICCCS), 2019.
[42]. Y. Chen, W. Lin, and J. Z. Wang, “A dual-attention-based stock price trend prediction model with dual features,” IEEE Access, vol. PP, no. 99, pp. 1–1, 2019.
[43]. G. Lai, W. C. Chang, Y. Yang, and H. Liu, “Modeling long- and shortterm temporal patterns with deep neural networks,” ACM, 2018.