


1. Introduction
The development of social media has made it a terrific place for people to connect with like-minded peers and express their thoughts, feelings, and sentiments. This offers the chance to examine user sentiments and feelings in social media data to learn more about their views and moods when conversing. People who are depressed often broadcast their thoughts and ideas on social media about personal lives and further expressive difficulties. Using these postings, comments, and tweets, one may readily determine their feelings and emotions. The data source for determining peoples' moods will be social media.
In general, mental disease is caused by being sad and lack of interest in routine works. Finding depression early on is crucial since it needs to be monitored and treated to prevent serious repercussions. In order to identify a person's indicators of sadness from their social media comments, where persons express their sentiments and emotions, automatic approaches are required. Social media and modern technology give us the chance to quickly identify depression's signs.
From social media postings in English language, the proposed system have to detect the depression types into three classes such as not depressed, moderately depressed, and severely depressed. To detect depression, sentiment analysis is utilized which identifies both polarity and emotions together. The proposed system concentrates on developing various learning approaches such as machine learning models, deep learning models and hybrid model to perform sentiment analysis on shared task social media text and classify them into appropriate classes.
The organization of this research work is as follows: Section 2 discusses about literature survey on sentiment analysis and depression detection. Section 3 provides information about data and methods like a shared task dataset description, preprocessing, feature extraction techniques and proposed learning models description. Section 4 explores results and discussion. Finally, we conclude the shared task work in Section 5.
2. Related work
There were between 200 and 3200 tweets per person in the sample tweets that was gathered. Using Term Frequency-Inverse Document Frequency, as in [1] choose the 100 most frequently used words from the tweets (TF-IDF). Later, they classified these words into emotions using the 14 psychological characteristics from Linguistic Inquiry and Word Count (LIWC). Following categorization by LIWC and training machine learning classifiers, weights were added to each word from joyful to sad to categorize the users into three types of depression as Low, Medium and High. In [2], the authors studied the sentiment analysis on social media content for the detection of unease or despair using several artificial intelligence approaches was presented in 2022. When performing sentiment analysis, the Multi Class Classification using Deep Learning algorithm demonstrates improved precision values. They developed a detection model that detects depression using machine learning techniques, demonstrating that data in blog could be utilized to identify depressed readers.
Depressive disease is the subject of “Sentiment Analysis for Depression Based on Social Media Stream”. The main flaw of the current system is the necessity for human assistance to decipher uncommon symbols, stop words, and punctuation. This system takes more time to operate, and alerts are not sent out when depression is still in its early stages. This was addressed in [3], who developed a real-time chat application in which feelings from social interactions are recorded and Support Vector Machine, a machine learning approach, is used to forecast a person’s level of mental distress. This method involves looking at chats, strange symbols, stop words, numbers, and punctuation in posts with depressing and stressful content. Using the SMTP and MIME protocols, it transmits the comforting quote to the appropriate person and notifies their guardian of their distress in accordance with the prediction. Time is saved, and the prediction is accurate right away 95%.
The goal of the study, “Detecting Depression Signs on Social Media” is to locate and compile all available data on the subject of identifying depression signs on social media using computer tools, linguistic feature extraction techniques, statistical analysis methods, and machine-learning algorithms. The study uses the approach suggested by [4] to review recent literature that was gathered from significant academic digital libraries. The most popular machine learning algorithm was support vector machine (SVM). Similar to that, Python libraries produced the most widely used computing tool.
Mental state Knowledge-aware and Contrastive Network was proposed by [5] known as KC-Net. In order to formally model the mental states, he first extracted knowledge about mental states from the common sense knowledge base COMET and infused it with Gated Recurrent Units (GRUs). Then, in order to appropriately attend to the most pertinent knowledge aspects, he presented a knowledge-aware mentalization based on dot-product attention. Another method used is supervised contrastive learning. On three datasets—Depression Mixed with 3165 Reddit and blog posts, Stress Dreaddit with 3553 Reddit posts, and Stress Factors Recognition dataset SAD with 6850 SMS-like messages—he tested the proposed approaches. The experimental results demonstrated that the technique produces new set of results on all datasets: 95.4% of F1 scores on Depression Mixed, 83.54% on Dreaddit, and 77.84% on SAD, with an improvement of 2.07% on average.
To demonstrate how their intended content-based method can be utilised for the creation and manipulation of the Multi-class label Emotion Classification task, [6] deployed information based methods to tweets. Extensive experimentation yielded the following results, which show that content-based word unigrams outperformed other content-based features: Multi-label Accuracy = 0.452, MicroF1 = 0.573, MacroF1 = 0.559, Exact Match = 0.141, Hamming Loss = 0.179. [7] used natural language processing to analyse emotions with an emphasis on depression in Twitter feeds. Based on a well-chosen word list to identify depressive tendencies, each tweet is assigned to one of two categories: neutral or negative. Support vector machines and Naive-Bayes classifiers have both been utilised in the class prediction process. The main classification measures, such as the F1-score, accuracy, and confusion matrix, have been used to present the results.
[8] first used crowdsourcing to gather a group of Twitter users who claim to have been given a clinical depression diagnosis based on a widely used psychometric test. We examine behavioural traits related to social interaction, mood, speech and language styles and antidepressant medications through their social media postings over the course of a year before the onset of depression. He uses these behavioural indicators to test and analyze classifier that predicts the likelihood of developing depression before symptoms are actually noticed. He discovered that social media has helpful indicators for identifying the cause of depression in people, including a decline in social interaction, an increase in strongly clustered egonetworks, a rise in relationship and health-related worries, and a larger expression of religious commitment.
In [9] researchers attempt to provide timely depression diagnosis through social media data collection. They create a well-labeled dataset on depression and non-depression on Twitter and extract six feature groups related to depression that encompass both online behaviours and the clinical depression criteria. They suggest a multimodal depression learning - based model to identify the stressed users on Twitter using these feature categories. A set of tests are carried out to verify the model, which surpasses multiple baselines (+3 percent to +10 percent). The main goal of [10] study is to investigate Reddit user posts to find any elements that might indicate relevant online users; attitudes toward depression. They use machine learning techniques and Natural Language Processing (NLP) methods to train the data for this reason and assess the effectiveness of our suggested methodology. They identify a vocabulary that is more prevalent in narratives of depression. The outcomes demonstrate that the suggested approach can greatly increase performance accuracy. Bigram is the most effective single feature when used with the Support Vector Machine (SVM) classifier to identify sadness with an accuracy of 80% and F1 scores of 0.80. With the Multilayer Perceptron (MLP) classifier, the strength and efficiency of the selected features (LIWC+LDA+bigram) were mostly successfully demonstrated, with the best performance for depression diagnosis achieving 91 percent accuracy and 0.93 F1 scores.
In order to study how language is used to describe depressive moods, [11] offer an early finding on developing the research framework that makes use of real-time moods of users gathered in the Twitter page. In order to learn more about how depression is discussed on Twitter, they started by looking at some sample tweets posted by the whole Twitter community over the course of two months. They studied 69 people to see if depressed user’s use of sentimental terms differed from that of a regular user. They discovered that as compared to users without serious depressive symptoms, Twitter users with these symptoms significantly more frequently used words associated with negative emotions and anger.
[12] take into account the task of automatically identifying depression symptoms from text messages sent by users of the Russian social network analysis. They provided details on the process used to prepare the dataset of user profiles and suggested psycholinguistic and stylistic indicators of depression in writing. They tested machine learning techniques for identifying depressive symptoms in social media posts. According to experiment results, features based on psycholinguistic signals scored 66 percent F1 on a binary classification task, which is a positive result when compared to previous efforts. The current study as specified by [13] investigates the application of machine learning methods to identify sadness in social media users. Recent research suggests that using social media is linked to higher depression rates. This can be done by developing classifiers from user posts and training and testing them to determine whether or not the person is depressed. He developed a web gateway for blogs and, using a trained model, can forecast their entries with an accuracy of 71.37 percent.
The purpose of the study mentioned in [14] is to use natural language processing to analyze emotions, namely depression, in Twitter feeds. The tweets are divided into good and negative categories based on a carefully chosen word list. Algorithms like Naive-Bayes and support vector machines are used to categorize the text data pulled from a twitter feed. The findings are displayed using classification measures including recall, memory accuracy, recall precision, and confusion matrix. On Facebook data gathered from a public online source, in [15] did depression analysis. They suggested using a scalable and effective machine learning technology to look into the impact of depression detection [16]. They demonstrated how the suggested strategy might drastically lower the classification error rate and increase accuracy [17][18]. Additionally, the results demonstrate that Decision Tree (DT) provides higher accuracy in many tests than other ML techniques to identify depression [19][20][21].
3. Methodology
3.1. Dataset description
The dataset used to identify the signs of depression consists of training, validation and test data collected from social media made available through shared task on ACL 2022. The sample instances are presented in Table 1.
Table 1. Sample instances from the dataset.
Comments | Class Label |
Just Cried While Watching [KUNG FU PANDA] At A Family Gathering because of the Nostalgia | Not depression |
My problems become bad every year | moderate |
I truly wish someone would shoot me I hope I die thinking about life and my past like I always am. There’s no getting away except death | severe |
The dataset description is provided in Table 2. The training dataset consists of 4815 comments in moderate class, 1576 comments in not depression class and 720 comments in severe depression category. In development dataset, there are 1204 comments in moderate category, 395 comments in not depression and 181 comments in severe category.
Table 2. Class wise distribution of dataset.
Class Label | Training Data | Test Data |
moderate | 4815 | 1204 |
not depression | 1576 | 395 |
severe | 720 | 181 |
3.2. Preprocessing
Text data gathered from social media has been utilised for analysing the depression state of the person. The information by getting comments from social media will be pre-processed so that all the unnecessary information will be eliminated. The first and most important stage in every classification operation is data preprocessing. In the proposed system, the dataset is preprocessed by tokenizing the texts, removing the stop words and lemmatize the words. Tokenization is the process of dividing the texts into tokens. The result of applying tokenization technique is presented in Table 3.
Table 3. Tokenization process.
Comment | Tokens |
New year someone else feeling like will be there last year on earth because even when your hammered your feeling like a moron that’s depressed | new,year,somone,else,feeling,like,will,be,there,last,year,on,earth,because,even,when,your,hammerd,your,feeling,like,a,moron,thats,depressed |
Stop words are frequently occurring insignificant words. One of the preprocessing techniques that is most frequently utilised across many NLP applications is stop word removal. The simple idea is to exclude words that appear frequently throughout all of the corpus's documents. Pronouns and articles are typically categorised as stop words. After applying stop words removal, the sample comment is represented as in Table 4.
Table 4. Stop words removal process.
Comment | Tokens |
I feel lonely and alone in the family | Feel lonely alone family |
In order to remove just inflectional endings and restore a word's lemma, or dictionary form, lemmatization refers to accurately carrying out tasks utilising a vocabulary list and by performing morphological analysis of tokens. After performing wordnet lemmatization, the sample comment is represented as in Table 5.
Table 5. Lemmatization process.
Comment | Tokens |
He was running out of fear. | He was run out of fear |
3.3. Feature extraction
Feature extraction is the process of extracting salient portion of text. The process of choosing and merging data into features while minimising the original data size is known as feature extraction. In the proposed machine learning models, Term Frequency-Inverse Document Frequency (TF-IDF) is used to calculate the significance of the tokens in a document among the total tokens. The proposed Deep learning models utilized Word2Vec to link between tokens in the comments. These deep learning models were able to detect synonym tokens or provide some additional tokens.
3.4. Proposed models
After preprocessing, the extracted features are applied various machine learning models like Multinomial Naïve Bayes, Linear Support Vector Classifier, Logistic Regression and Random Forest. After performing word embedding, the features are fed into various deep learning techniques such as Convolutional Neural Network (CNN), Long Short Term Memory (LSTM), Bidirectional Long Short Term Memory (Bi-LSTM), Bidirectional Gated Recurrent Unit (Bi-GRU). Further to improve the accuracy of these models, hybrid learning techniques such as CNN-LSTM, LSTM-CNN, CNN-BiLSTM and BiLSTM-CNN.
4. Results and discussion
This section discusses about the results of the machine learning, deep learning and hybrid learning models developed for automatic detection of signs of depression using the dataset of shared task on Detecting Signs of Depression from Social Media text at LT-EDI 2022-ACL 2022. The proposed system train machine learning models and test the models using the test dataset. The performance of the different machine learning, deep learning and hybrid learning models have been analyzed using the metrics like Accuracy, Precision, Recall and F1-Score. The values of the performance metrics obtained for the test dataset for each of the machine learning classifiers are presented in Table 6. The result shows that out of all machine learning models better F1-score of 0.93 is obtained by LSVC and LR for moderate category.
Table 6. Performance evaluation of machine learning models.
Machine Learning models | Class Labels | Precision | Recall | F1-score |
MNB | moderate | 0.75 | 1.00 | 0.86 |
not in depression | 0.99 | 0.38 | 0.55 | |
severe | 0.20 | 0.20 | 0.33 | |
LSVC | moderate | 0.89 | 0.96 | 0.93 |
not in depression | 0.87 | 0.72 | 0.79 | |
severe | 0.84 | 0.74 | 0.79 | |
LR | moderate | 0.89 | 0.96 | 0.93 |
not in depression | 0.87 | 0.72 | 0.79 | |
severe | 0.84 | 0.74 | 0.79 | |
RF | moderate | 0.85 | 0.98 | 0.91 |
not in depression | 0.90 | 0.63 | 0.74 | |
severe | 0.96 | 0.62 | 0.75 |
The precision, recall, F1-score obtained by various deep learning models are presented in Table 7. Among the mentioned deep learning models, the highest F1-score of 0.92 is obtained by both Bi-GRU and CNN deep learning models.
Table 7. Performance evaluation of deep learning models.
Deep Learning models | Class Labels | Precision | Recall | F1-score |
LSTM | moderate | 0.93 | 0.88 | 0.90 |
not in depression | 0.84 | 0.63 | 0.73 | |
severe | 0.83 | 0.65 | 0.73 | |
BI-LSTM | moderate | 0.93 | 0.88 | 0.90 |
not in depression | 0.80 | 0.67 | 0.70 | |
severe | 0.83 | 0.65 | 0.73 | |
BI-GRU | moderate | 0.90 | 0.94 | 0.92 |
not in depression | 0.80 | 0.67 | 0.70 | |
severe | 0.75 | 0.62 | 0.68 | |
CNN | moderate | 0.87 | 0.97 | 0.92 |
not in depression | 0.86 | 0.44 | 0.50 | |
severe | 0.91 | 0.40 | 0.55 |
The precision, recall, F1-score of various hybrid models are depicted in Table 8. The result shows that highest F1-score of 0.92 is obtained by BiLSTM-CNN, CNN-BiLSTM and CNN-LSTM models. Among all the three different types of learning are obtained by CNN-LSTM hybrid model.
Table 8. Performance Evaluation of Hybrid models.
Hybrid models | Class Labels | Precision | Recall | F1-score |
BILSTM-CNN | moderate | 0.91 | 0.93 | 0.92 |
not in depression | 0.90 | 0.55 | 0.65 | |
severe | 0.92 | 0.54 | 0.68 | |
CNN-BILSTM | moderate | 0.92 | 0.92 | 0.92 |
not in depression | 0.91 | 0.60 | 0.73 | |
severe | 0.93 | 0.61 | 0.74 | |
LSTM-CNN | moderate | 0.84 | 0.96 | 0.90 |
not in depression | 0.80 | 0.65 | 0.72 | |
severe | 0.79 | 0.63 | 0.70 | |
CNN-LSTM | moderate | 0.92 | 0.92 | 0.92 |
not in depression | 0.93 | 0.62 | 0.74 | |
severe | 0.93 | 0.61 | 0.74 |
The confusion matrix obtained by all machine learning, deep learning and hybrid learning models are represented in Figure 1. In general confusion matrix is used to compare the target values with those predicted by the models. The confusion matrix is generated based on the indices. In confusion matrix, diagonal values represent correctly classified comments. The X axis represents the predicted label, whereas the Y axis represents the true label.
|
|
|
|
|
|
|
|
|
|
|
|
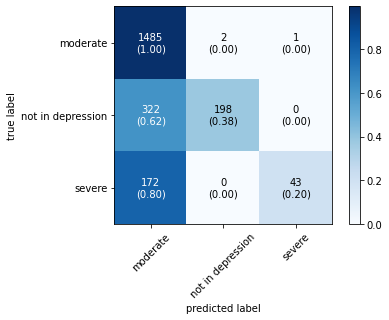

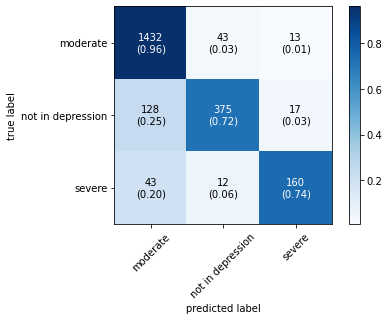
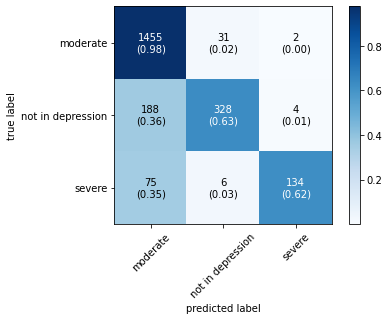
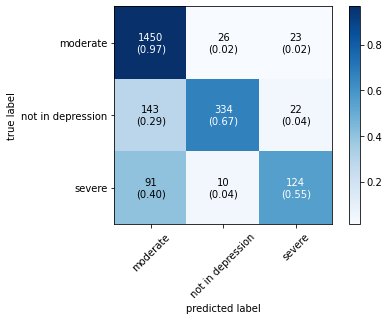
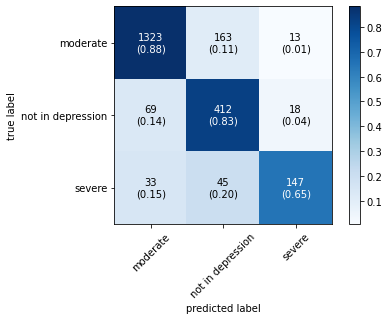
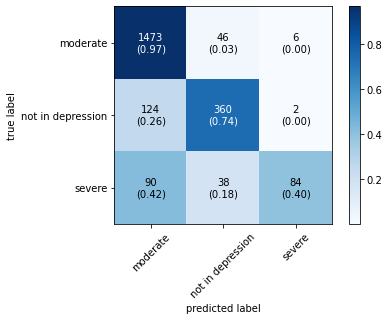

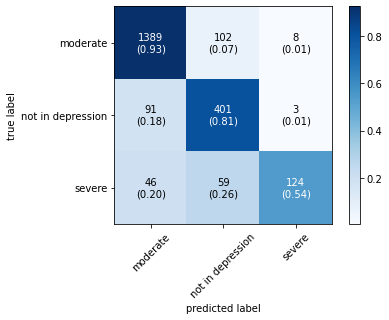

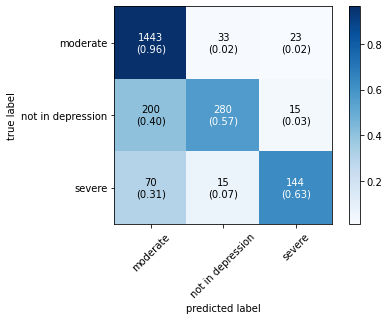
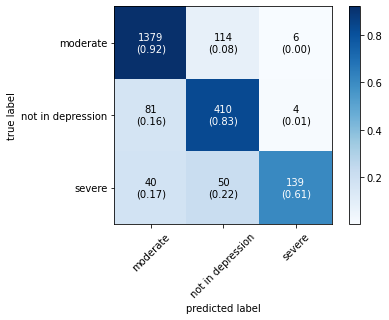
Figure 1. Confusion matrix for machine learning, deep learning and hybrid learning models.
5. Conclusion
This goal of this research work is to apply the shared task dataset into various learning methods to spot depressive symptoms on social media comments. Detecting signs of depression from social media being widely explored using linguistic feature extraction and word embedding based methods, machine learning algorithms, deep learning algorithms and hybrid models. The result obtained indicates that among all the mentioned models, hybrid models produced better results compared to machine learning and deep learning models. Further this research work will be extended by applying imbalanced dataset into data augmentation process in order to obtain balanced dataset which will provide more accurate results.
References
[1]. [Mustafa, Raza & Ashraf, Noman & Ahmed, Fahad & Ferzund, Javed & Shahzad, Basit & Gelbukh, Alexander. (2020). A Multiclass Depression Detection in Social Media Based on Sentiment Analysis.10.1007/978-3-030-43020-7_89.
[2]. Babu, Nirmal Varghese & Kanaga (2022). Sentiment Analysis in Social Media Data for Depression Detection Using Artificial Intelligence: A Review. SN Computer Science. 3. 10.1007/s42979-021-00958-1.
[3]. A, Punitha, et al. Sentiment Analysis for Depression Based on Social Media Stream. no. 3, ManakulaVinayagar Institute of Technology, Aug. 2021.
[4]. Salas-Zárate R, Alor-Hernández G, Salas-Zárate MDP, Paredes-Valverde MA, Bustos-López M,Sánchez-Cervantes JL. Detecting Depression Signs on Social Media: A Systematic Literature Review.Healthcare (Basel). 2022 Feb 1;10(2):291. doi: 10.3390/healthcare10020291. PMID: 35206905;PMCID: PMC8871802.
[5]. Kailai Yang, Tianlin Zhang, Sophia Ananiadou, A mental state Knowledge–aware and Contrastive Network for early stress and depression detection on social media, Information Processing &Management, Volume 59, Issue 4, 2022, 102961, ISSN 0306-4573
[6]. Ameer, I., Ashraf, N., Sidorov, G., & Gómez-Adorno, H. (2020). Multi-label Emotion Classification using Content-Based Features in Twitter. Computación y Sistemas, 24. Ameer, Iqra et al. “Multi-label Emotion Classification using Content-Based Features in Twitter.” Computación y Sistemas 24 (2020):
[7]. M. Deshpande and V. Rao, "Depression detection using emotion artificial intelligence, 2017 International Conference on Intelligent Sustainable Systems (ICISS), 2017, pp. 858-862, doi: 10.1109/ISS1.2017.8389299.
[8]. Choudhury, M.D., Gamon, M., Counts, S., & Horvitz, E. (2013). Predicting Depression via Social Media. ICWSM.
[9]. Shen, G., Jia, J., Nie, L., Feng, F., Zhang, C., Hu, T., Chua, T., & Zhu, W. (2017). Depression Detection via Harvesting Social Media: A Multimodal Dictionary Learning Solution. IJCAI.
[10]. Tadesse, M.M., Lin, H., Xu, B., & Yang, L. (2019). Detection of Depression-Related Posts in Reddit Social Media Forum. IEEE Access, 7, 44883-44893.
[11]. Park, M., Cha, C., & Cha, M. (2012). Depressive Moods of Users Portrayed in Twitter.
[12]. Maxim Stankevich, et al. Depression Detection from Social Media Texts.
[13]. Matharu, Ishmeet Singh. Depression Detection using Social Media forum. no. 5, 5 May 2022.
[14]. M, Hemanthkumar, and Latha A. Depression Detection with Sentiment Analysis of Tweets. no. 5.
[15]. Islam, M. R., Kabir, M. A., Ahmed, A., Kamal, A., Wang, H., & Ulhaq, A. (2018). Depression detection from social network data using machine learning techniques. Health information science and systems, 6(1), 8. https://doi.org/10.1007/s13755-018-0046-0
[16]. Sathishkumar V E, Changsun Shin, Youngyun Cho, “Efficient energy consumption prediction model for a data analytic-enabled industry building in a smart city”, Building Research & Information, Vol. 49. no. 1, pp. 127-143, 2021.
[17]. Sathishkumar V E, Youngyun Cho, “A rule-based model for Seoul Bike sharing demand prediction using Weather data”, European Journal of Remote Sensing, Vol. 52, no. 1, pp. 166-183, 2020.
[18]. Sathishkumar V E, Jangwoo Park, Youngyun Cho, “Seoul Bike Trip duration prediction using data mining techniques”, IET Intelligent Transport Systems, Vol. 14, no. 11, pp. 1465-1474, 2020.
[19]. Sathishkumar V E, Jangwoo Park, Youngyun Cho, “Using data mining techniques for bike sharing demand prediction in Metropolitan city”, Computer Communications, Vol. 153, pp. 353-366, 2020.
[20]. Sathishkumar V E, Yongyun Cho, “Season wise bike sharing demand analysis using random forest algorithm”, Computational Intelligence, pp. 1-26, 2020.
[21]. Sathishkumar, V. E., Wesam Atef Hatamleh, Abeer Ali Alnuaim, Mohamed Abdelhady, B. Venkatesh, and S. Santhoshkumar. "Secure Dynamic Group Data Sharing in Semi-trusted Third Party Cloud Environment." Arabian Journal for Science and Engineering (2021): 1-9.
Cite this article
S.,S.K.;Shanmugavadivel,K.;V.,S.R.;Subramanian,M.;R.,S.;E.,S.V. (2023). Leveraging multi-class sentiment analysis on social media text for detecting signs of depression. Applied and Computational Engineering,2,242-251.
Data availability
The datasets used and/or analyzed during the current study will be available from the authors upon reasonable request.
Disclaimer/Publisher's Note
The statements, opinions and data contained in all publications are solely those of the individual author(s) and contributor(s) and not of EWA Publishing and/or the editor(s). EWA Publishing and/or the editor(s) disclaim responsibility for any injury to people or property resulting from any ideas, methods, instructions or products referred to in the content.
About volume
Volume title: Proceedings of the 4th International Conference on Computing and Data Science (CONF-CDS 2022)
© 2024 by the author(s). Licensee EWA Publishing, Oxford, UK. This article is an open access article distributed under the terms and
conditions of the Creative Commons Attribution (CC BY) license. Authors who
publish this series agree to the following terms:
1. Authors retain copyright and grant the series right of first publication with the work simultaneously licensed under a Creative Commons
Attribution License that allows others to share the work with an acknowledgment of the work's authorship and initial publication in this
series.
2. Authors are able to enter into separate, additional contractual arrangements for the non-exclusive distribution of the series's published
version of the work (e.g., post it to an institutional repository or publish it in a book), with an acknowledgment of its initial
publication in this series.
3. Authors are permitted and encouraged to post their work online (e.g., in institutional repositories or on their website) prior to and
during the submission process, as it can lead to productive exchanges, as well as earlier and greater citation of published work (See
Open access policy for details).
References
[1]. [Mustafa, Raza & Ashraf, Noman & Ahmed, Fahad & Ferzund, Javed & Shahzad, Basit & Gelbukh, Alexander. (2020). A Multiclass Depression Detection in Social Media Based on Sentiment Analysis.10.1007/978-3-030-43020-7_89.
[2]. Babu, Nirmal Varghese & Kanaga (2022). Sentiment Analysis in Social Media Data for Depression Detection Using Artificial Intelligence: A Review. SN Computer Science. 3. 10.1007/s42979-021-00958-1.
[3]. A, Punitha, et al. Sentiment Analysis for Depression Based on Social Media Stream. no. 3, ManakulaVinayagar Institute of Technology, Aug. 2021.
[4]. Salas-Zárate R, Alor-Hernández G, Salas-Zárate MDP, Paredes-Valverde MA, Bustos-López M,Sánchez-Cervantes JL. Detecting Depression Signs on Social Media: A Systematic Literature Review.Healthcare (Basel). 2022 Feb 1;10(2):291. doi: 10.3390/healthcare10020291. PMID: 35206905;PMCID: PMC8871802.
[5]. Kailai Yang, Tianlin Zhang, Sophia Ananiadou, A mental state Knowledge–aware and Contrastive Network for early stress and depression detection on social media, Information Processing &Management, Volume 59, Issue 4, 2022, 102961, ISSN 0306-4573
[6]. Ameer, I., Ashraf, N., Sidorov, G., & Gómez-Adorno, H. (2020). Multi-label Emotion Classification using Content-Based Features in Twitter. Computación y Sistemas, 24. Ameer, Iqra et al. “Multi-label Emotion Classification using Content-Based Features in Twitter.” Computación y Sistemas 24 (2020):
[7]. M. Deshpande and V. Rao, "Depression detection using emotion artificial intelligence, 2017 International Conference on Intelligent Sustainable Systems (ICISS), 2017, pp. 858-862, doi: 10.1109/ISS1.2017.8389299.
[8]. Choudhury, M.D., Gamon, M., Counts, S., & Horvitz, E. (2013). Predicting Depression via Social Media. ICWSM.
[9]. Shen, G., Jia, J., Nie, L., Feng, F., Zhang, C., Hu, T., Chua, T., & Zhu, W. (2017). Depression Detection via Harvesting Social Media: A Multimodal Dictionary Learning Solution. IJCAI.
[10]. Tadesse, M.M., Lin, H., Xu, B., & Yang, L. (2019). Detection of Depression-Related Posts in Reddit Social Media Forum. IEEE Access, 7, 44883-44893.
[11]. Park, M., Cha, C., & Cha, M. (2012). Depressive Moods of Users Portrayed in Twitter.
[12]. Maxim Stankevich, et al. Depression Detection from Social Media Texts.
[13]. Matharu, Ishmeet Singh. Depression Detection using Social Media forum. no. 5, 5 May 2022.
[14]. M, Hemanthkumar, and Latha A. Depression Detection with Sentiment Analysis of Tweets. no. 5.
[15]. Islam, M. R., Kabir, M. A., Ahmed, A., Kamal, A., Wang, H., & Ulhaq, A. (2018). Depression detection from social network data using machine learning techniques. Health information science and systems, 6(1), 8. https://doi.org/10.1007/s13755-018-0046-0
[16]. Sathishkumar V E, Changsun Shin, Youngyun Cho, “Efficient energy consumption prediction model for a data analytic-enabled industry building in a smart city”, Building Research & Information, Vol. 49. no. 1, pp. 127-143, 2021.
[17]. Sathishkumar V E, Youngyun Cho, “A rule-based model for Seoul Bike sharing demand prediction using Weather data”, European Journal of Remote Sensing, Vol. 52, no. 1, pp. 166-183, 2020.
[18]. Sathishkumar V E, Jangwoo Park, Youngyun Cho, “Seoul Bike Trip duration prediction using data mining techniques”, IET Intelligent Transport Systems, Vol. 14, no. 11, pp. 1465-1474, 2020.
[19]. Sathishkumar V E, Jangwoo Park, Youngyun Cho, “Using data mining techniques for bike sharing demand prediction in Metropolitan city”, Computer Communications, Vol. 153, pp. 353-366, 2020.
[20]. Sathishkumar V E, Yongyun Cho, “Season wise bike sharing demand analysis using random forest algorithm”, Computational Intelligence, pp. 1-26, 2020.
[21]. Sathishkumar, V. E., Wesam Atef Hatamleh, Abeer Ali Alnuaim, Mohamed Abdelhady, B. Venkatesh, and S. Santhoshkumar. "Secure Dynamic Group Data Sharing in Semi-trusted Third Party Cloud Environment." Arabian Journal for Science and Engineering (2021): 1-9.