


1. Introduction
Cross-chain bridges and payment hubs have become critical financial infrastructure, stitching heterogeneous ledgers into a practical value-routing fabric. Users traverse these corridors to reach yield, arbitrage mispricings, and access application-specific ecosystems. The benefits are clear, capital mobility, composability, convenience, but the risks are subtle: micro-liquidity imbalances, inclusion-delay spikes, and brief oracle drift can propagate through inter-ledger paths and escalate into system-wide stress within minutes [1]. Because contagion windows track block cadence rather than daily cycles, traditional stress testing, built around slow topology and ex-post aggregation, misses the decisive moments when intervention is still cheap [2].
Monitoring faces two challenges. Representationally, a live transfer stream must be turned into block-sampled graphs that preserve counterparties, value, settlement speed, and routing evolution under load. Operationally, we must infer, on commodity hardware and sub-second latency, a risk signal capturing immediate load and multi-hop propagation so venues can trigger rate limits, throttle fragile corridors, or adjust collateral before cascades harden.
We address these with a block-synchronous pipeline that builds a directed multigraph per block, attaches features summarizing short-horizon intensity and delay, and applies a temporal graph attention network with sparsified neighborhoods and residual gating. The model outputs node-level distress, aggregated into a normalized systemic risk index suitable for supervisory dashboards. Thresholds tied to historical quantiles trigger playbooks such as temporary outflow throttles or corridor caps [3].
For realism and control, we pair a large public bridge archive (over ten million transfers across major chain pairs and assets) with an agent-based simulator injecting stylized shocks: exploit-driven drains, staged liquidity migration, and oracle drift. We report discrimination (AUROC, AUPRC), calibration (Brier, expected calibration error), early-warning lead time in blocks and seconds, false alerts per hour at matched sensitivity, and end-to-end latency and throughput. The method issues earlier, better-calibrated alerts than strong baselines while meeting sub-second inference targets without GPUs. The paper follows the uploaded framework: Section 2 reviews related work, Section 3 formalizes representation and index construction, Section 4 details data and training, Section 5 presents results and ablations, and Section 6 concludes.
2. Literature review
2.1. Systemic risk in decentralized finance
Systemic risk in decentralized finance emerges when composability binds balance sheets across venues. Collateral recycling, synthetic exposure via wrapped assets, and flash liquidity synchronize positions, while asynchronous finality creates short windows during which adverse flows propagate faster than participants can re-hedge. Analyses confined to single chains understate risk precisely when users accelerate cross-chain transfers in volatile markets [4]. A monitoring framework must therefore be cross-chain, block-synchronous, and sensitive to multi-hop effects.
2.2. Cross-chain payment infrastructures
Cross-chain value transfer typically uses intermediary liquidity hubs, hash time-locked constructions, optimistic verification layers, or message-passing protocols. These mechanisms improve user experience but introduce failure modes tied to relayer liveness, verification delay, and liquidity fragmentation [5]. Under stress, routing adapts endogenously; flexibility that keeps routes alive can also concentrate flows through fragile bottlenecks. Effective measurement must track topology and weights at block cadence and normalize exposures by contemporaneous value.
2.3. Graph neural networks for risk analysis
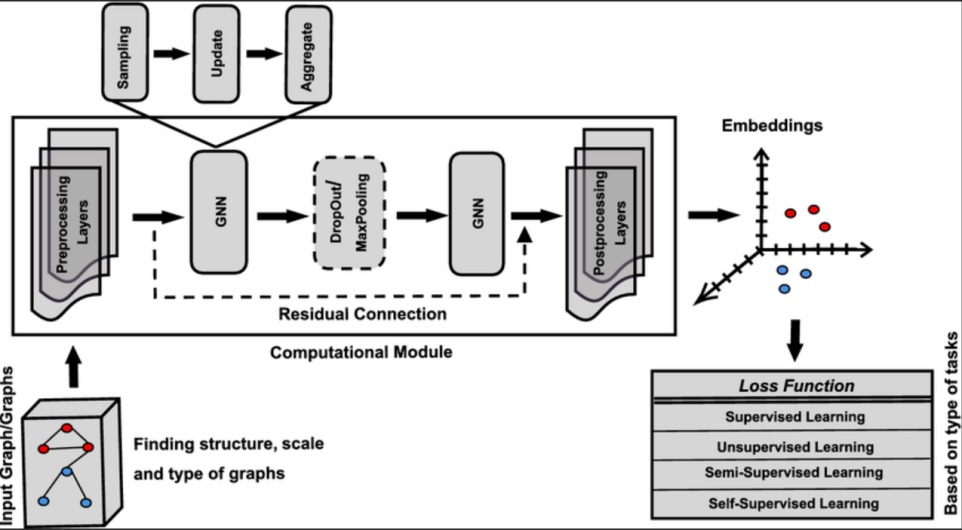
Graph neural networks (GNNs) are well-suited to systems with interdependent nodes and multi-hop propagation, and their standard pipeline, input graphs → preprocessing → stacked message-passing layers with residual links → embedding space → task-specific loss—is sketched in Figure 1. Static GNNs capture structure but miss rapid temporal regimes; temporal variants are needed to distinguish transient bursts from structural change [6]. Attention helps identify which neighbors and time lags matter, but real-time deployment requires sparsified computation and quantized weights to achieve sub-second latency on CPUs.
3. Methodology
3.1. Network representation and streaming ingestion
Each block induces a directed multigraph whose vertices are chain–address tuples and whose edges represent transfers observed within the block. On-chain transactions are ingested via WebSockets, deduplicated by transaction hash, and aligned by block height. Off-chain price snapshots (mid quotes) normalize edge values to a common currency so that exposures are comparable across assets and chains. Node features summarize recent activity over a rolling window of 64 blocks: rolling in/out degree, approximate betweenness via sparsified power iteration, realized slippage (execution price vs. contemporaneous mid), and queue-time anomalies (submission-to-inclusion delay vs. chain-pair baseline) [7]. Edge features include native amount, normalized value at execution, fee paid, and inclusion delay. The representation is append-only and supports constant-time integration as blocks arrive.
3.2. Temporal attention with residual gating
A temporal graph attention network encodes short-horizon dynamics and current topology. Attention coefficients incorporate timing gaps to emphasize neighbors whose recent interactions predict near-future stress, while residual gating stabilizes hidden states when neighborhoods are volatile. Attention is sparsified by retaining only the top-scoring neighbors, sharply reducing latency and suppressing noise from weak links. The layer update used throughout this paper is expressed in Equation (1):
3.3. Systemic risk index
The model outputs node-level distress probabilities that estimate the likelihood a vertex becomes a source or conduit of stress over the next few blocks [8]. These scores are propagated through value-normalized edges to produce a single, normalized systemic risk index per block. Propagation is truncated at shallow depth to capture short contagion paths without overcounting diffuse routes; rescaling maps the index to the unit interval for dashboard thresholds. The aggregation is given by Equation (2):
4. Experimental setup
4.1. Datasets and stress scenarios
We evaluate on two complementary sources. First, a six-month public bridge archive comprises 10,512,936 transfers across 13,122 block snapshots, covering 17 chain pairs and 42 assets. Median block cadence is 3.0 s. The USD-normalized transfer distribution is heavy-tailed: median 2,147, 95th percentile 58,204, with a Pareto tail fit (shape ≈ 1.37) on the top decile by maximum likelihood. End-to-end inclusion delay is multimodal across chain pairs: median 7.2 s, interquartile range 3.1–12.8 s, 99th percentile > 90 s during congestion [9]. Each scenario has 1,000 Monte Carlo runs; finality lags are uniformly sampled 2–20 blocks; order-flow arrivals follow Hawkes processes calibrated to observed bursts (see table 1).
|
Component |
Duration / Size |
Topology Scope |
Temporal Granularity |
Key Statistics |
|
Public bridge archive |
6 months; 10,512,936 transfers; 13,122 block snapshots |
17 chain pairs; 42 assets; >1.2M active addresses |
Median 3.0 s per block |
Median transfer 2,147 USD; p95 58,204 USD; latency median 7.2 s (IQR 3.1–12.8 s); Pareto tail shape ≈ 1.37 |
|
Simulator S1 (exploit drains) |
1,000 runs × 10 min |
Liquidity nodes tagged; same scope as archive |
Block-synchronous |
Liquidity removal 30% ± 7% within 120 ± 35 s; finality lag 6–14 blocks |
|
Simulator S2 (migration) |
1,000 runs × 30 min |
Market-maker hubs; alternate routes |
Block-synchronous |
Inventory re-route 20–35% over 15 min; betweenness Gini 0.41 → 0.57 |
|
Simulator S3 (oracle drift) |
1,000 runs × 10 min |
Price oracles as features |
Block-synchronous |
Drift 40 bps for 12.7 ± 2.6 blocks; correction within 22.1 ± 4.0 blocks |
4.2. Training protocol, runtime, and baselines
Training uses rolling windows of 64 blocks with stride 8 and a chronological 70/15/15 train/validation/test split. Optimization uses AdamW (weight decay 1e-4) with a triangular learning-rate schedule cycling 1e-5 ↔ 3e-4. Bayesian search tunes hidden dimension, attention heads, dropout, top-K neighbor cap, and propagation depth Kp. Early stopping monitors a smoothed validation Brier score. We quantize weights to 8-bit and run inference in WebAssembly to satisfy latency targets.
Baselines: (i) temporal graph convolution with identical windows and features; (ii) vector autoregression on chain-pair aggregates; (iii) multilayer perceptron over per-block graph statistics (degree moments, assortativity, max-flow proxies).
5. Results and discussion
5.1. Predictive accuracy, calibration, and latency
Across five non-overlapping temporal folds on the public archive, the proposed method attains AUROC 0.943±0.006 and AUPRC 0.712±0.014. The temporal graph convolution baseline reaches 0.903±0.008 and 0.614±0.018; vector autoregression reaches 0.741±0.012 and 0.402±0.021; the multilayer perceptron reaches 0.804±0.010 and 0.463±0.017. Brier score improves from 0.138±0.003 (temporal graph convolution) to 0.112±0.002; expected calibration error falls from 0.042±0.004 to 0.019±0.003 with ten equal-mass bins. Stratifying by corridor shows the largest absolute AUPRC gain (≈ 0.13) on routes with long-tailed inclusion delays, consistent with the temporal weighting in Equation (1). The temporal graph convolution requires 1.41 s median (p95 2.09 s). Vector autoregression is fast (0.18 s) but less robust (Sections 5.2–5.3). Sustained throughput is 2.1 blocks/s with quantized WebAssembly; a float32 backend is ~4× slower at equal accuracy [10].
5.2. Early-warning lead time and case studies
Exploit-driven drains (S1). In 1,000 runs with 30%±7% liquidity removed within 120±35s, the risk index rises by 0.82±0.05 within two blocks of exploit initiation and peaks at 0.91±0.03 after six blocks. The first significant uptick precedes realized slippage by 12.4±2.1 blocks (≈ 37.2±6.3 s). A simulated outflow throttle of 10% for 60 s after alert reduces breaches of a critical threshold Rt=0.85 by 2.7× relative to no throttle.
Staged liquidity migration (S2). Re-routing 20–35% inventory over 15 min increases betweenness Gini from 0.41 to 0.57. The index trends linearly with slope +0.0063±0.0007 per block across 300 blocks. Time to cross an operational threshold Rt=0.65 averages 210±34 s; mild 8–12% rate limiting during the rise keeps Rt<0.65 in 81% of runs without materially depressing post-migration throughput. Attention patterns shift toward the newly dominant corridors roughly three blocks before standard centrality metrics reflect the change.
Oracle drift (S3). With 40 bps mispricing sustained for 12.7±2.6 blocks, the index increases modestly by 0.18±0.04 and reverts within 22.1±4.0 blocks after correction. Vector autoregression overshoots (peak +0.36±0.11) and takes >40 blocks to return to baseline, producing ~10× more false alerts per hour at matched sensitivity.
5.3. Ablations, sensitivity, and robustness
Removing attention (retaining message passing) reduces AUROC by 0.106±0.012 and increases Brier by 0.017], confirming the value of time-aware weighting. Dropping edge features increases expected calibration error by 0.011, driven by overconfidence on low-value corridors. De-quantizing weights to float32 increases median latency by 2.6× with negligible accuracy change (ΔAUROC ≈ +0.003), validating 8-bit inference for production. Injecting ±20% perturbations into edge values for 10% of transfers keeps index variance within ±0.03; Kendall’s τ between perturbed and unperturbed Rtexceeds 0.90±0.02.
Adversarial reordering. Reordering edges within blocks (MEV-like effects) reduces AUROC modestly to 0.917±0.007; median latency stays < 0.45 s.
6. Conclusion and future work
We introduced a block-synchronous framework for real-time systemic-risk monitoring in cross-chain payment networks. By constructing per-block dynamic graphs and applying sparsified temporal attention with residual gating, the system produces a normalized, actionable risk index that integrates cleanly into supervisory dashboards and venue playbooks. On a large bridge archive and in controlled shocks, the framework delivers earlier alerts, better calibration, and sub-second inference relative to strong baselines. Future work will couple the index with optimal control for automated mitigation, incorporate mempool features to capture pre-inclusion stress, and extend simulation realism to include validator behavior and auction dynamics, all while preserving the latency and robustness required for production deployment.
References
[1]. Weingärtner, T., Fasser, F., Reis Sá da Costa, P., & Farkas, W. (2023). Deciphering DeFi: A comprehensive analysis and visualization of risks in decentralized finance. Journal of risk and financial management, 16(10), 454.
[2]. Gomes, H. M. D. A. V. (2022). The Interconnectedness of Decentralized Finance with the Traditional Financial System and Potential Implications for Systemic Risk (Master's thesis, Universidade do Algarve (Portugal)).
[3]. Auer, R., Haslhofer, B., Kitzler, S., Saggese, P., & Victor, F. (2024). The technology of decentralized finance (DeFi). Digital Finance, 6(1), 55-95.
[4]. Bekemeier, F. (2021, December). Deceptive assurance? a conceptual view on systemic risk in decentralized finance (DeFi). In Proceedings of the 2021 4th International Conference on Blockchain Technology and Applications (pp. 76-87).
[5]. Luo, X., Xue, K., Sun, Q., & Lu, J. (2024). CrossChannel: Efficient and scalable cross-chain transactions through cross-and-off-blockchain micropayment channel. IEEE Transactions on Dependable and Secure Computing, 22(1), 649-663.
[6]. Bi, W., Xu, B., Sun, X., Wang, Z., Shen, H., & Cheng, X. (2022, August). Company-as-tribe: Company financial risk assessment on tribe-style graph with hierarchical graph neural networks. In Proceedings of the 28th ACM SIGKDD Conference on Knowledge Discovery and Data Mining (pp. 2712-2720).
[7]. Datta, A., Reijsbergen, D., Zhang, J., & Majumder, S. (2024). Blockchain i/o: Enabling cross-chain commerce. IEEE Access, 12, 90915-90928.
[8]. Ou, W., Huang, S., Zheng, J., Zhang, Q., Zeng, G., & Han, W. (2022). An overview on cross-chain: Mechanism, platforms, challenges and advances. Computer Networks, 218, 109378.
[9]. Mojdehi, K. F., Amiri, B., & Haddadi, A. (2025). A novel hybrid model for credit risk assessment of supply chain finance based on topological data analysis and graph neural network. IEEE Access.
[10]. Kosasih, E. E., Margaroli, F., Gelli, S., Aziz, A., Wildgoose, N., & Brintrup, A. (2024). Towards knowledge graph reasoning for supply chain
Cite this article
Hu,S. (2025). Real-Time Systemic Risk Monitoring of Cross-Chain Payment Networks Using Graph Neural Networks. Applied and Computational Engineering,170,121-126.
Data availability
The datasets used and/or analyzed during the current study will be available from the authors upon reasonable request.
Disclaimer/Publisher's Note
The statements, opinions and data contained in all publications are solely those of the individual author(s) and contributor(s) and not of EWA Publishing and/or the editor(s). EWA Publishing and/or the editor(s) disclaim responsibility for any injury to people or property resulting from any ideas, methods, instructions or products referred to in the content.
About volume
Volume title: Proceedings of the 7th International Conference on Computing and Data Science
© 2024 by the author(s). Licensee EWA Publishing, Oxford, UK. This article is an open access article distributed under the terms and
conditions of the Creative Commons Attribution (CC BY) license. Authors who
publish this series agree to the following terms:
1. Authors retain copyright and grant the series right of first publication with the work simultaneously licensed under a Creative Commons
Attribution License that allows others to share the work with an acknowledgment of the work's authorship and initial publication in this
series.
2. Authors are able to enter into separate, additional contractual arrangements for the non-exclusive distribution of the series's published
version of the work (e.g., post it to an institutional repository or publish it in a book), with an acknowledgment of its initial
publication in this series.
3. Authors are permitted and encouraged to post their work online (e.g., in institutional repositories or on their website) prior to and
during the submission process, as it can lead to productive exchanges, as well as earlier and greater citation of published work (See
Open access policy for details).
References
[1]. Weingärtner, T., Fasser, F., Reis Sá da Costa, P., & Farkas, W. (2023). Deciphering DeFi: A comprehensive analysis and visualization of risks in decentralized finance. Journal of risk and financial management, 16(10), 454.
[2]. Gomes, H. M. D. A. V. (2022). The Interconnectedness of Decentralized Finance with the Traditional Financial System and Potential Implications for Systemic Risk (Master's thesis, Universidade do Algarve (Portugal)).
[3]. Auer, R., Haslhofer, B., Kitzler, S., Saggese, P., & Victor, F. (2024). The technology of decentralized finance (DeFi). Digital Finance, 6(1), 55-95.
[4]. Bekemeier, F. (2021, December). Deceptive assurance? a conceptual view on systemic risk in decentralized finance (DeFi). In Proceedings of the 2021 4th International Conference on Blockchain Technology and Applications (pp. 76-87).
[5]. Luo, X., Xue, K., Sun, Q., & Lu, J. (2024). CrossChannel: Efficient and scalable cross-chain transactions through cross-and-off-blockchain micropayment channel. IEEE Transactions on Dependable and Secure Computing, 22(1), 649-663.
[6]. Bi, W., Xu, B., Sun, X., Wang, Z., Shen, H., & Cheng, X. (2022, August). Company-as-tribe: Company financial risk assessment on tribe-style graph with hierarchical graph neural networks. In Proceedings of the 28th ACM SIGKDD Conference on Knowledge Discovery and Data Mining (pp. 2712-2720).
[7]. Datta, A., Reijsbergen, D., Zhang, J., & Majumder, S. (2024). Blockchain i/o: Enabling cross-chain commerce. IEEE Access, 12, 90915-90928.
[8]. Ou, W., Huang, S., Zheng, J., Zhang, Q., Zeng, G., & Han, W. (2022). An overview on cross-chain: Mechanism, platforms, challenges and advances. Computer Networks, 218, 109378.
[9]. Mojdehi, K. F., Amiri, B., & Haddadi, A. (2025). A novel hybrid model for credit risk assessment of supply chain finance based on topological data analysis and graph neural network. IEEE Access.
[10]. Kosasih, E. E., Margaroli, F., Gelli, S., Aziz, A., Wildgoose, N., & Brintrup, A. (2024). Towards knowledge graph reasoning for supply chain