


1. Introduction
Skin diseases are one of the most common diseases in the world that seriously affect human health. Many skin diseases not only endanger the patient's health, but also seriously affect the patient's mental state. For example, Acne [1], which is extremely common in adolescents, and vitiligo [2], whose cause is not yet known, are relatively common skin diseases. Traditional testing methods for patients' skin diseases are mainly detected through the naked eye and the learning experience of dermatologists. This method not only takes a lot of time to detect, but is also easily affected by some doctors' subjective factors. Especially for some inexperienced doctors, the probability of misjudgment or misjudgment will greatly increase [3]. It can seriously affect the patient's health.
Artificial intelligence technology can provide good solutions to the above problems. As early as the 60s of the 20th century, artificial intelligence technology began to be applied in medicine [4, 5, 6]. With the development of artificial intelligence technology in recent years, the application of artificial intelligence in medical imaging has become more mature [7], and many breakthroughs have been made. In 2015, Wang et al. [8] trained CNN models to diagnose melanocytic nevus (MN) and seborrheic keratosis (SK). The accuracy rate can reach 88.33%, which is even higher than the average diagnosis accuracy of 95 dermatologists. MAKENA et al. [9] identified clinical photographs of vitiligo patients based on the CNN model of InceptionResnetV and U-Net. The result of the Jaccard similarity coefficient (JI) is 73.6%. In addition to these studies, Junayed et al. [10] used a deep CNN-based ScarNet to implement an artificial intelligence recognition system for acne scars. The the model can reach 92.53% accuracy and 95.38% specificity.
The purpose of this study was to implement and analyze the recognition ability of MobileNetV2 (96×96 0.35), MobileNetV2 (160×160 0.75) and EfficientNet models on skin disease images. The three models were evaluated by accuracy, AUC, F1 score, Confusion matrix and other indicators.
Part 2 of this article describes the dataset and the three models used in this experiment. The third part of this article introduces the configuration of the experiment. In addition, the results of this experiment will be analyzed and summarized in this part. The final part will summarize and look forward to this experiment
2. Datasets and methodologies
2.1. Page setup
The dataset images of this study are all selected from the DermNet database, which is a public website with pictures of various skin diseases. This study chose Acne, Actinic Keratosis, Benign tumors, Eczema, and Vitiligo as the experimental subjects. The images are in JPEG format and RGB color space. And the picture pixels are the same for each skin disease type. In addition, the images in the dataset are all from clinical real-life shooting. There are differences in light, angle, skin disease sites, etc. Therefore, this study is also closer to the actual clinical scenario. The following is an introduction to the datasets for each skin disease category.
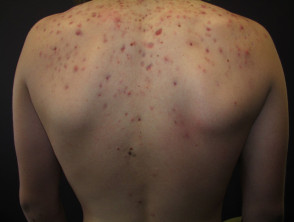
2.1.1. Acne datasets
The Acne datasets have a total of 651 images. Among them, the training set is 588 sheets, and the test set is 63 sheets. The pixels of the pictures are 294×222. As shown in Figure 1.
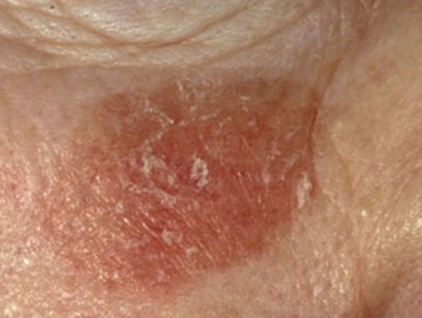
2.1.2. Actinic keratosis datasets
The actinic keratosis datasets consist of a total of 812 images. Among them, the training set is 730 sheets and the test set is 82 sheets. The pixels of the pictures are 294×222. As shown in Figure 2.
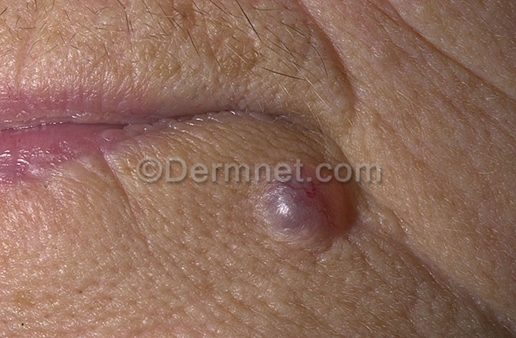
2.1.3. Benign tumors datasets
Benign tumors datasets consist of a total of 1194 images. Among them, the training set is 1073 sheets and the test set is 121 sheets. The pixels of the pictures are 294×222. As shown in Figure 3.
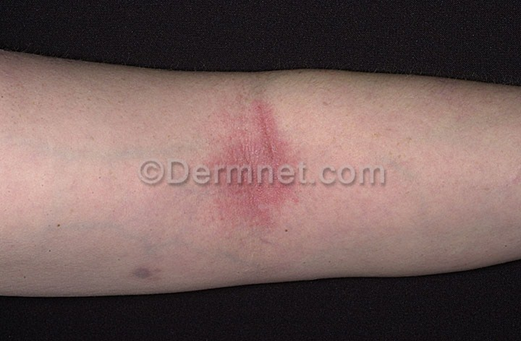
2.1.4. Eczema datasets
The eczema datasets consist of a total of 1039 images. Among them, the training set is 943 sheets and the test set is 96 sheets. The pixels of the pictures are 294×222. As shown in Figure 4.
2.1.5. Vitiligo datasets
Vitiligo datasets consist of a total of 790 images. Among them, the training set is 712 sheets and the test set is 78 sheets. The pixels of the pictures are 612×378. As shown in Figure 5.

2.2. Method
This study used MobileNetV2 (96×96 0.35), MobileNetV2 (160×160 0.75), and EfficientNet. The following is an introduction to the individual models.
2.2.1. Structural features and application focus of MobileNetV2 (96×96 0.35)
MobileNetV2 is a lightweight convolutional neural network that replaces standard convolutions with deep separable volumes, greatly reducing the amount of parameters and computation.MobileNetV2 uses Depthwise Separable Convolution instead of standard convolution, which reduces the amount of computation.
This configuration is extremely small and fast, making it suitable for devices with low storage and power consumption. The disadvantage is that the feature extraction ability is relatively limited, and it may not perform well in fine classification tasks.
2.2.2. Structural features and application focus of MobileNetV2 (160×160 0.75).
This version is consistent with the MobileNetV2(96×96 0.35) architecture mentioned above. But the input resolution increased from 96×96 to 160×160 and the width factor increased from 0.35 to 0.75. Higher input resolution means improved spatial information capture capabilities. A larger width factor means an improvement in the model's feature expression ability.
This model strikes a balance between efficiency and accuracy, making it suitable for deployment on medium-performance devices that require both good performance and accuracy.
2.2.3. Structural features and application focus of efficientnet
Traditional models usually only increase the depth or width of the network or increase the input image resolution when improving accuracy. EfficientNet proposes a composite scaling approach. With a fixed zoom factor φ, zoom in proportionally in three dimensions: depth, width, and resolution. In addition, add an SE attention module to each MBConv module, which can make the network pay more attention to key feature channels and improve the representation ability. Apart from that, using EfficientNet-B0, find the appropriate number of layers and modules to combine through the NAS.
EfficientNet can achieve high accuracy with a small number of parameters, and is suitable for some image classification scenarios that require high classification accuracy and moderate performance.
3. Experiment
3.1. Experimental configuration
3.1.1. MobileNetV2 (96×96 0.35) experimental configuration
The input size is 224×224, compared to 96×96 and 160×160, which a larger input size that is conducive to capturing more picture details. The training period is set to 100 rounds. The learning rate is 0.0005. The training processor is a graphics processing unit (GPU). Compared with using a CPU to train models, GPUs have stronger computing power and higher efficiency at the same time. The final layer consists of 8 neurons 0.1 probability of dropout. In addition, this experiment uses data augmentation. Rotate, flip, crop and other operations on the picture to improve the robustness of training, so that the experimental effect is better and the test effect is better. The validation set accounts for 20%.
3.1.2. MobileNetV2 (160×160 0.75) experimental configuration
The input size is also 224×224. The training period is 100 rounds. The learning rate was 0.0005. The model is also trained using a graphics processing unit (GPU). No final dense layer. 0.1 probability of dropout. This experiment uses data augmentation. The validation set also accounts for 20%.
3.1.3. Efficientnet experimental configuration
The input size is also 224×224. The training period is 100 rounds. Increasing the learning rate to 0.001 accelerates convergence. The training processor still uses the GPU. The EfficientNet model is scaled to 80 - 4M params, 16 MB. Use pretrained weights. The frozen layer ratio is 90%. The final layer consists of 32 neurons.0.1 probability of dropout. This experiment also uses data augmentation. The validation set also accounts for 20%.
3.1.4. Sub subsection titles (style to use: heading 3)
The heading of a sub subsection title should be in 12-point bold with initial letters capitalized, aligned to the left with a linespace single and an additional spacing of 10-point before and 10-point after.
Dot should be included after the sub subsection title number.
3.2. Experimental results
The experimental results of each model, as well as the validation accuracy and test accuracy, are shown in Table 1. It is clear that the EfficientNet model is much higher than the other two MobileNetV2 models in terms of validation accuracy and test accuracy. In addition, the MobileNetV2 96*96 0.35 model has the worst accuracy in the dermatology identification task. The test accuracy of the MobileNetV2 96*96 0.35 model is only 65.0%. The following is the interpretation of the metrics and confusion matrix of each model.
|
Name |
Input |
DSP Blocks |
Learn Blocks |
f32_V_Acc |
f32_T_Acc |
|
MobileNetV2 96*96 0.35 |
224×224 |
Image |
MobileNetV2 96x96 0.35 |
77.5% |
65.0% |
|
MobileNetV2 160*160 0.75 |
224×224 |
Image |
MobileNetV2 160x160 0.75 |
81.5% |
77.7% |
|
EfficientNet |
224×224 |
Image |
EfficientNet |
82.7% |
82.0% |
3.2.1. MobileNetV2 (96×96 0.35) metrics and confusion matrix interpretation
From the overall index in Table 2, the AUC value is 0.94, indicating that the model has a certain discrimination ability (the closer the AUC is to 1, the stronger the discrimination ability). However, the weighted Precision/Recall/F1 score is only 0.75, indicating that the accuracy of the model is poor, prone to misjudgment, and the missed detection is serious, making it difficult to capture the real positive sample. In addition, the model has a weak balance between accuracy and recall, and weak comprehensive performance.
From Table 3, it can be seen that the F1 score of the Vitiligo class is 0.90, which is significantly higher than that of other classes, while the Acne class has the lowest value of only 0.6. It is clear that the Vitiligo class is less confusing than other classes(Acne、Actinic Keratosis、Benign tumors、Eczema). For the uncertain rate for each skin disease, Acne was 30.2%, Actinic Keratosis was 28.0%, and Benign tumors were 25.6%. Eczema was 21.9% indicating that the model is difficult to determine in these categories. The uncertainty of the Vitiligo class is only 3.8%, and the accuracy is 88.5%, which shows that the model can make good judgments on the Vitiligo class.
|
Metric |
Value |
|
Area under ROC Curve |
0.94 |
|
Weighted average Precision |
0.75 |
|
Weighted average Recall |
0.75 |
|
Weighted average F1 score |
0.75 |
|
Acne |
Actinic Keratosis |
Benign tumors |
Eczema |
Vitiligo |
uncertain |
|
|
Acne |
54.0% |
3.2% |
4.8% |
4.8% |
3.2% |
30.2% |
|
Actinic Keratosis |
7.3% |
53.7% |
2.4% |
3.7% |
4.9% |
28.0% |
|
Benign Tumors |
4.1% |
2.5% |
65.3% |
2.5% |
0% |
25.6% |
|
Eczema |
5.2% |
0% |
9.4% |
62.5% |
1.0% |
21.9% |
|
Vitiligo |
1.3% |
2.6% |
1.3% |
2.6% |
88.5% |
3.8% |
|
F1 score |
0.60 |
0.66 |
0.73 |
0.72 |
0.90 |
3.2.2. MobileNetV2(160×160 0.75)metrics and confusion matrix interpretation
It can be seen from Table 4 that the AUC is increased to 0.97, indicating that this model has better discrimination ability than MobileNetV2 (96×96 0.35). The weighted Precision/Recall/F1 score is 0.81, which is a significant improvement over the small model MobileNetV2 (96×96 0.35). It also shows that the accuracy of the model is good, it is not easy to misjudge, and the missed detection is not serious, and it can better capture the real positive sample. In addition, the overall performance is better than the previous model.
Analysis of the F1 score in Table 5 showed that Acne was 0.80, Benign tumors was 0.81, Eczema was 0.75, Actinic Keratosis was 0.76, and Vitiligo was 0.91. It can be seen that the various categories are more balanced, and there are no obvious and confusing categories. The overall uncertainty was significantly lower than that of MobileNetV2 (96×96 0.35), with Acne by 6.3%, Actinic Keratosis by 7.3%, and Eczema by 6.3%. Although Benign tumors are uncertain at 8.3%, which is still difficult, the overall improvement is obvious.
|
Metric |
Value |
|
Area under ROC Curve |
0.97 |
|
Weighted average Precision |
0.81 |
|
Weighted average Recall |
0.81 |
|
Weighted average F1 score |
0.81 |
|
Acne |
Actinic Keratosis |
Benign tumors |
Eczema |
Vitiligo |
uncertain |
|
|
Acne |
81.0% |
0% |
7.9% |
4.8% |
0% |
6.3% |
|
Actinic Keratosis |
8.5% |
67.1% |
7.3% |
7.3% |
2.4% |
7.3% |
|
Benign tumors |
1.7% |
2.5% |
82.6% |
5.0% |
0% |
8.3% |
|
Eczema |
4.2% |
2.1% |
14.6% |
69.8% |
3.1% |
6.3% |
|
Vitiligo |
1.3% |
3.8% |
2.6% |
1.3% |
88.5% |
2.6% |
|
f1 score |
0.80 |
0.76 |
0.81 |
0.75 |
0.91 |
3.2.3. Efficientnet metrics and confusion matrix interpretation
As can be seen from Table 6, the AUC is 0.98, and the weighted Precision/Recall/F1 is 0.86, which is the best of the three models. It shows that the model has excellent discrimination ability, the best comprehensive performance, and the false positive and false negative performance is also the lowest among the three models.
Analysis of the F1 score in Table 7 showed that Acne was 0.84, Benign tumors was 0.86, Eczema was 0.81, Actinic Keratosis was 0.83, and Vitiligo was 0.94. It outperforms the above two MobileNetV2 models in each type of disease, and the gap between classes is smaller. In general, the uncertainty of each class has not changed much. However, the uncertainty of Actinic Keratosis increased to 13.4%. This may be because EfficientNet uses higher resolution inputs, which improves classification performance overall, but may also amplify subtle differences in Actinic keratosis images, increasing uncertain predictions.
|
Metric |
Value |
|
Area under ROC Curve |
0.98 |
|
Weighted average Precision |
0.86 |
|
Weighted average Recall |
0.86 |
|
Weighted average F1 score |
0.86 |
|
Acne |
Actinic Keratosis |
Benign tumors |
Eczema |
Vitiligo |
uncertain |
|
|
Acne |
85.7% |
0% |
6.3% |
1.6% |
0% |
6.3% |
|
Actinic Keratosis |
4.9% |
75.6% |
2.4% |
3.7% |
0% |
13.4% |
|
Benign tumors |
3.3% |
0.8% |
83.5% |
4.1% |
0% |
8.3% |
|
Eczema |
3.1% |
2.1% |
8.3% |
77.1% |
1.0% |
8.3% |
|
Vitiligo |
1.3% |
2.6% |
0% |
3.8% |
89.7% |
2.6% |
|
f1 score |
0.84 |
0.83 |
0.86 |
0.81 |
0.94 |
3.2.4. Train loss and train accuracy curve analysis
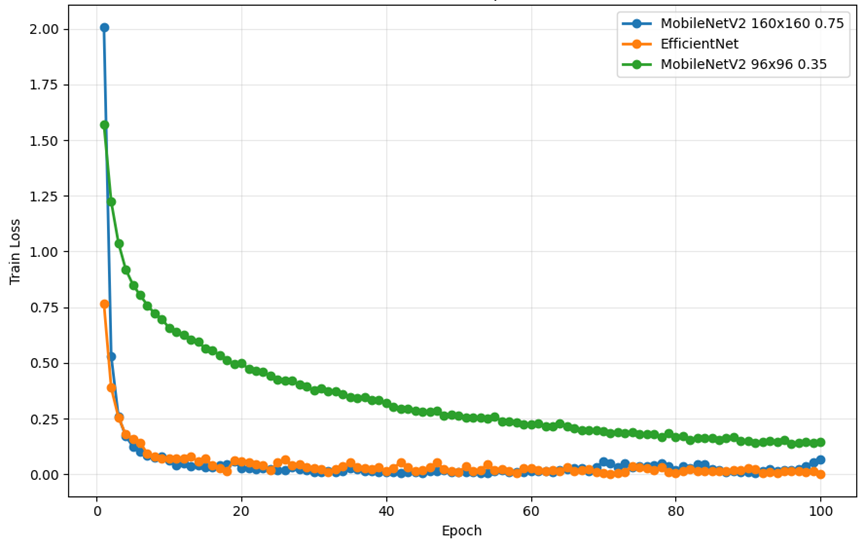
As shown in Figure 6, from the perspective of the changing trend of train loss, all three models show a gradual decline and tend to converge, but there are obvious differences in convergence speed and stability. For MobileNetV2 (96×96 0.35), its training loss decreases rapidly in the early stage. However, the decline slowed down significantly in the middle and late stages, and stabilized at higher loss levels, failing to continue to approach lower loss values. This phenomenon reflects the insufficient capacity of the model and the limited ability of feature extraction, resulting in bottlenecks in deeper feature learning. In MobileNetV2 (160×160 0.75), the decline in training loss was smoother and more amplitude, eventually converging to a lower level. This corresponds to its high verification accuracy. In contrast, the training loss of EfficientNet decreased the fastest and eventually converged at the lowest level, indicating that it had the strongest feature expression ability. In the later stage of convergence, the loss curve fluctuates less, and the overall convergence process is more stable.
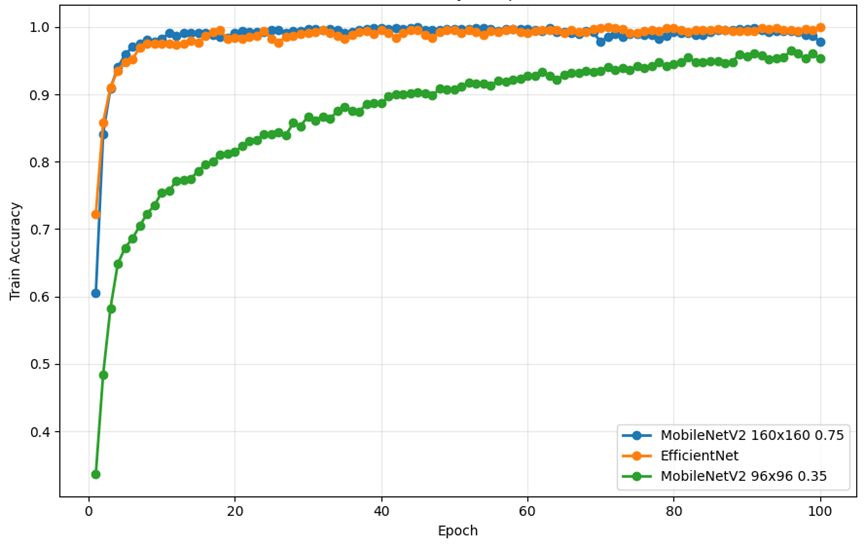
As shown in Figure 7, from the perspective of the change trend of train accuracy, the three models showed gradual improvement and stabilization during the training process, but there was a difference between the improvement and the final level. In MobileNetV2 (96×96 0.35), the training accuracy increased rapidly in the early stage, but the final stability level was significantly lower than that of other models. This shows that although the model can quickly learn some shallow features, it is underfitted and difficult to achieve higher accuracy due to the small input resolution and network capacity, which limits its ability to further capture fine-grained differences. For MobileNetV2 (160×160 0.75), the training accuracy ramp is smoother and reaches higher levels in the later stages. In EfficientNet, training accuracy improves the fastest and stabilizes at the highest level in the late stages of convergence. The curve still maintains a slight upward trend in the convergence stage, indicating that the model continues to learn and adjust to the difficult-to-classify samples. This is consistent with the highest AUC and F1 scores obtained on the validation set, indicating that EfficientNet not only learns efficiently during training, but also maintains strong generalization capabilities.
3.3. Comparative analysis and interpretation of results subsection
MobileNetV2 (96×96 0.35) AUC is 0.94, weighted F1 is 0.75, MobileNetV2 (160×160 0.75) AUC is 0.97, weighted F1 is 0.81, with an EfficientNet AUC of 0.98 and a weighted F1 of 086. With the change of the model, AUC and weighted F1 monotonically increased. This illustrates the importance of higher resolution, higher capacity, and deeper and wider network dermatology classification.
In terms of accuracy and F1 index for all dermatological categories in each model, EfficientNet outperforms the small model MobileNet in all categories. Moreover, the gap between classes is narrowed, the accuracy of various types is significantly increased, and the model performance is very good.
The proportion of "uncertainty" in the small model is significantly higher in multiple categories (e.g., Acne 30.2%, AK 28.0%), and the medium model decreases significantly (mostly in 6–8%), while EfficientNet is more stable overall.
Compared with 96×96, the higher effective resolution of 160×160 and EfficientNet for the texture and edge of the image with fine grainness significantly improves the accuracy of the model.
The reason why EfficientNet clearly performed better in this dermatology detection experiment was the limited scalability of the MobileNet series. When it is necessary to improve performance [MobileNetV2 (96×96 0.35) upgraded to MobileNetV2 (160×160 0.75)], it is often just a simple increase in network depth. However, this leads to a rapid increase in the number of parameters and computational work of the model, and the improvement in accuracy is actually not obvious. EfficientNet uses a composite scaling approach that results in a linear increase in performance with resource consumption. In addition, compared with MobileNet, EfficientNet further optimizes the MBConv module, adding an SE attention mechanism after deep separable convolution, allowing the model to automatically focus on important feature channels and improve feature extraction efficiency. EfficientNet also uses the Swish activation function to retain more gradient information and mitigate the gradient vanishing issue.
4. Conclusion
In this experiment, three skin disease classification systems were constructed based on MobileNetV2 (96××96 0.35), MobileNetV2 (160160 0.75) and EfficientNet, and the performance of these three models was analyzed in the detection of the five skin diseases(Acne, Actinic Keratosis, Benign tumors, Eczema, Vitiligo). The experimental results show that the EfficientNet model is far better than the MobileNetV2 model in terms of accuracy and F1 score in the skin disease classification task. In contrast, the MobileNetV2 (96×96 0.35) model performed far worse than EfficientNet in dermatology classification due to limited scaling capabilities. MobileNetV2 (160×160 0.75). Although it is lower than EfficientNet, it has advantages such as smaller models and good accuracy, making it suitable for small devices such as mobile phones.
In the future, more models suitable for skin disease detection will be tried to improve the accuracy of detection in the system, and try to quantify the model to make it more suitable for small devices such as mobile phones, which is convenient for more people to use.
This experiment demonstrates the practicality and effectiveness of artificial intelligence in the automatic detection of skin diseases, which greatly promotes the development of artificial intelligence in the field of medicine. In the future, as artificial intelligence technology matures, it will not only become a powerful tool to assist doctors in diagnosis, but also help people detect the existence of diseases faster and more accurately.
References
[1]. Reynolds, R.V., Yeung, H., Cheng, E.C., et al. (2024) Guidelines of care for the management of acne vulgaris. Journal of the American Academy of Dermatology, 90(5), 1006.e1-1006.e30.
[2]. Yu, L., Li, J., Lu, Q., et al. (2025) Research Progress on the Relationship Between the Pathogenesis of Vitiligo and Viral Infection. Journal of Dermatology and Venereology, 47(2), 79-82.
[3]. Zhang, X., Wang, C., Bie, D., et al. (2024) Research Progress on the Application of Convolutional Neural Network-Based Artificial Intelligence in Dermatological Diagnosis. Journal of Practical Dermatology, 17(5), 295-298.
[4]. Pang, J., Yu, D., Zhang, Q. (2025) Application of Artificial Intelligence Technology in the Diagnosis and Treatment of Skin Diseases. China Computer & Communication, 37(9), 18-21.
[5]. Zhu, Y., Tan, S., Fu, L., et al. (2025) New Progress in Research on Dermatological Imaging Features of Basal Cell Carcinoma. Chinese Journal of Dermatovenereology, pp. 1-12.
[6]. Feng, L., Liu, L., Dong, J., et al. (2021) Design and Implementation of a Skin Cancer Detection System. Technology Innovation and Application, 11(27), 51-52, 55.
[7]. Wu, S., Guo, Y., Qian, C., et al. (2025) Research Status and Development Trend of Medical Image Recognition Technology. Chinese Journal of Medical Physics, 42(6), 719-729.
[8]. Wang, S., Liu, J., Zhu, C., Shu, S., Zhou, H., Xie, F., Xu, T., Jin, H. (2018) Comparison Between Dermatologists and Deep Convolutional Neural Networks in Diagnosing Dermoscopic Images of Nevus and Seborrheic Keratosis. Chinese Journal of Dermatology, 51(7).
[9]. Yu, S., Wang, H. (2025) Application of Artificial Intelligence in the Diagnosis and Treatment of Vitiligo. Journal of Modern Medicine & Health, 41(2), 522-526.
[10]. Ye, S., Chen, M., Xiao, M. (2023) Application of Artificial Intelligence in the Field of Dermatological Diagnosis. Dermatology Bulletin, 40(4), 438-443.
Cite this article
Wang,Z. (2025). Skin Disease Recognition Based on Computer Vision. Applied and Computational Engineering,191,113-123.
Data availability
The datasets used and/or analyzed during the current study will be available from the authors upon reasonable request.
Disclaimer/Publisher's Note
The statements, opinions and data contained in all publications are solely those of the individual author(s) and contributor(s) and not of EWA Publishing and/or the editor(s). EWA Publishing and/or the editor(s) disclaim responsibility for any injury to people or property resulting from any ideas, methods, instructions or products referred to in the content.
About volume
Volume title: Proceedings of CONF-MLA 2025 Symposium: Intelligent Systems and Automation: AI Models, IoT, and Robotic Algorithms
© 2024 by the author(s). Licensee EWA Publishing, Oxford, UK. This article is an open access article distributed under the terms and
conditions of the Creative Commons Attribution (CC BY) license. Authors who
publish this series agree to the following terms:
1. Authors retain copyright and grant the series right of first publication with the work simultaneously licensed under a Creative Commons
Attribution License that allows others to share the work with an acknowledgment of the work's authorship and initial publication in this
series.
2. Authors are able to enter into separate, additional contractual arrangements for the non-exclusive distribution of the series's published
version of the work (e.g., post it to an institutional repository or publish it in a book), with an acknowledgment of its initial
publication in this series.
3. Authors are permitted and encouraged to post their work online (e.g., in institutional repositories or on their website) prior to and
during the submission process, as it can lead to productive exchanges, as well as earlier and greater citation of published work (See
Open access policy for details).
References
[1]. Reynolds, R.V., Yeung, H., Cheng, E.C., et al. (2024) Guidelines of care for the management of acne vulgaris. Journal of the American Academy of Dermatology, 90(5), 1006.e1-1006.e30.
[2]. Yu, L., Li, J., Lu, Q., et al. (2025) Research Progress on the Relationship Between the Pathogenesis of Vitiligo and Viral Infection. Journal of Dermatology and Venereology, 47(2), 79-82.
[3]. Zhang, X., Wang, C., Bie, D., et al. (2024) Research Progress on the Application of Convolutional Neural Network-Based Artificial Intelligence in Dermatological Diagnosis. Journal of Practical Dermatology, 17(5), 295-298.
[4]. Pang, J., Yu, D., Zhang, Q. (2025) Application of Artificial Intelligence Technology in the Diagnosis and Treatment of Skin Diseases. China Computer & Communication, 37(9), 18-21.
[5]. Zhu, Y., Tan, S., Fu, L., et al. (2025) New Progress in Research on Dermatological Imaging Features of Basal Cell Carcinoma. Chinese Journal of Dermatovenereology, pp. 1-12.
[6]. Feng, L., Liu, L., Dong, J., et al. (2021) Design and Implementation of a Skin Cancer Detection System. Technology Innovation and Application, 11(27), 51-52, 55.
[7]. Wu, S., Guo, Y., Qian, C., et al. (2025) Research Status and Development Trend of Medical Image Recognition Technology. Chinese Journal of Medical Physics, 42(6), 719-729.
[8]. Wang, S., Liu, J., Zhu, C., Shu, S., Zhou, H., Xie, F., Xu, T., Jin, H. (2018) Comparison Between Dermatologists and Deep Convolutional Neural Networks in Diagnosing Dermoscopic Images of Nevus and Seborrheic Keratosis. Chinese Journal of Dermatology, 51(7).
[9]. Yu, S., Wang, H. (2025) Application of Artificial Intelligence in the Diagnosis and Treatment of Vitiligo. Journal of Modern Medicine & Health, 41(2), 522-526.
[10]. Ye, S., Chen, M., Xiao, M. (2023) Application of Artificial Intelligence in the Field of Dermatological Diagnosis. Dermatology Bulletin, 40(4), 438-443.