


1. Introduction
Guangxi, located in southwest China, is one of China’s provinces with the most frequent droughts and floods and relatively high temperatures. Qinzhou, specifically, is in the coastal area south of the Tropic of Cancer, where summer high temperatures are accompanied by concentrated and intense precipitation. Zhou Rui and colleagues identified Guangxi's landscape and concentrated rainfall from May to September as major factors contributing to floods [1]. Studies have shown that floods could bring about infectious diseases such as bacillary dysentery and influenza [2]; on a global scale, a crop production loss from 1982 to 2016 due to floods is estimated at 5.5 billion United States dollars [3]. On the other hand, temperature is another key meteorological indicator that influences plant growth, the ecological system, and human well-being. Thus, forecasting the precipitation and temperature could help safeguard inhabitants' property and health, as well as prevent reductions in grain yield.
Monthly precipitation and average temperature can be treated as time series. Time series forecasting involves constructing a model using past data. Time series forecasting has shown effectiveness in a large range of fields: propagation of diseases [4], meteorology [5], and the stock market [6]. This paper chooses Seasonal Autoregressive Integrated Moving Average (SARIMA) as the forecasting model to predict Qinzhou’s future precipitation and temperature based on past data from the National Oceanic and Atmospheric Administration (NOAA). First proposed by Box and Jenkins in 1976, the SARIMA model is a non-machine learning time series model that effectively captures seasonal patterns in time series with relatively few parameters [7]. Since both precipitation and temperature show strong periodicity (with values significantly higher in summer than in winter), the SARIMA model can aptly account for this pattern. This paper provides a method to forecast monthly average temperature with high accuracy and precipitation with medium accuracy in Qinzhou and points out this method's shortcomings when facing sudden changes in precipitation.
2. Method
2.1. Data collection
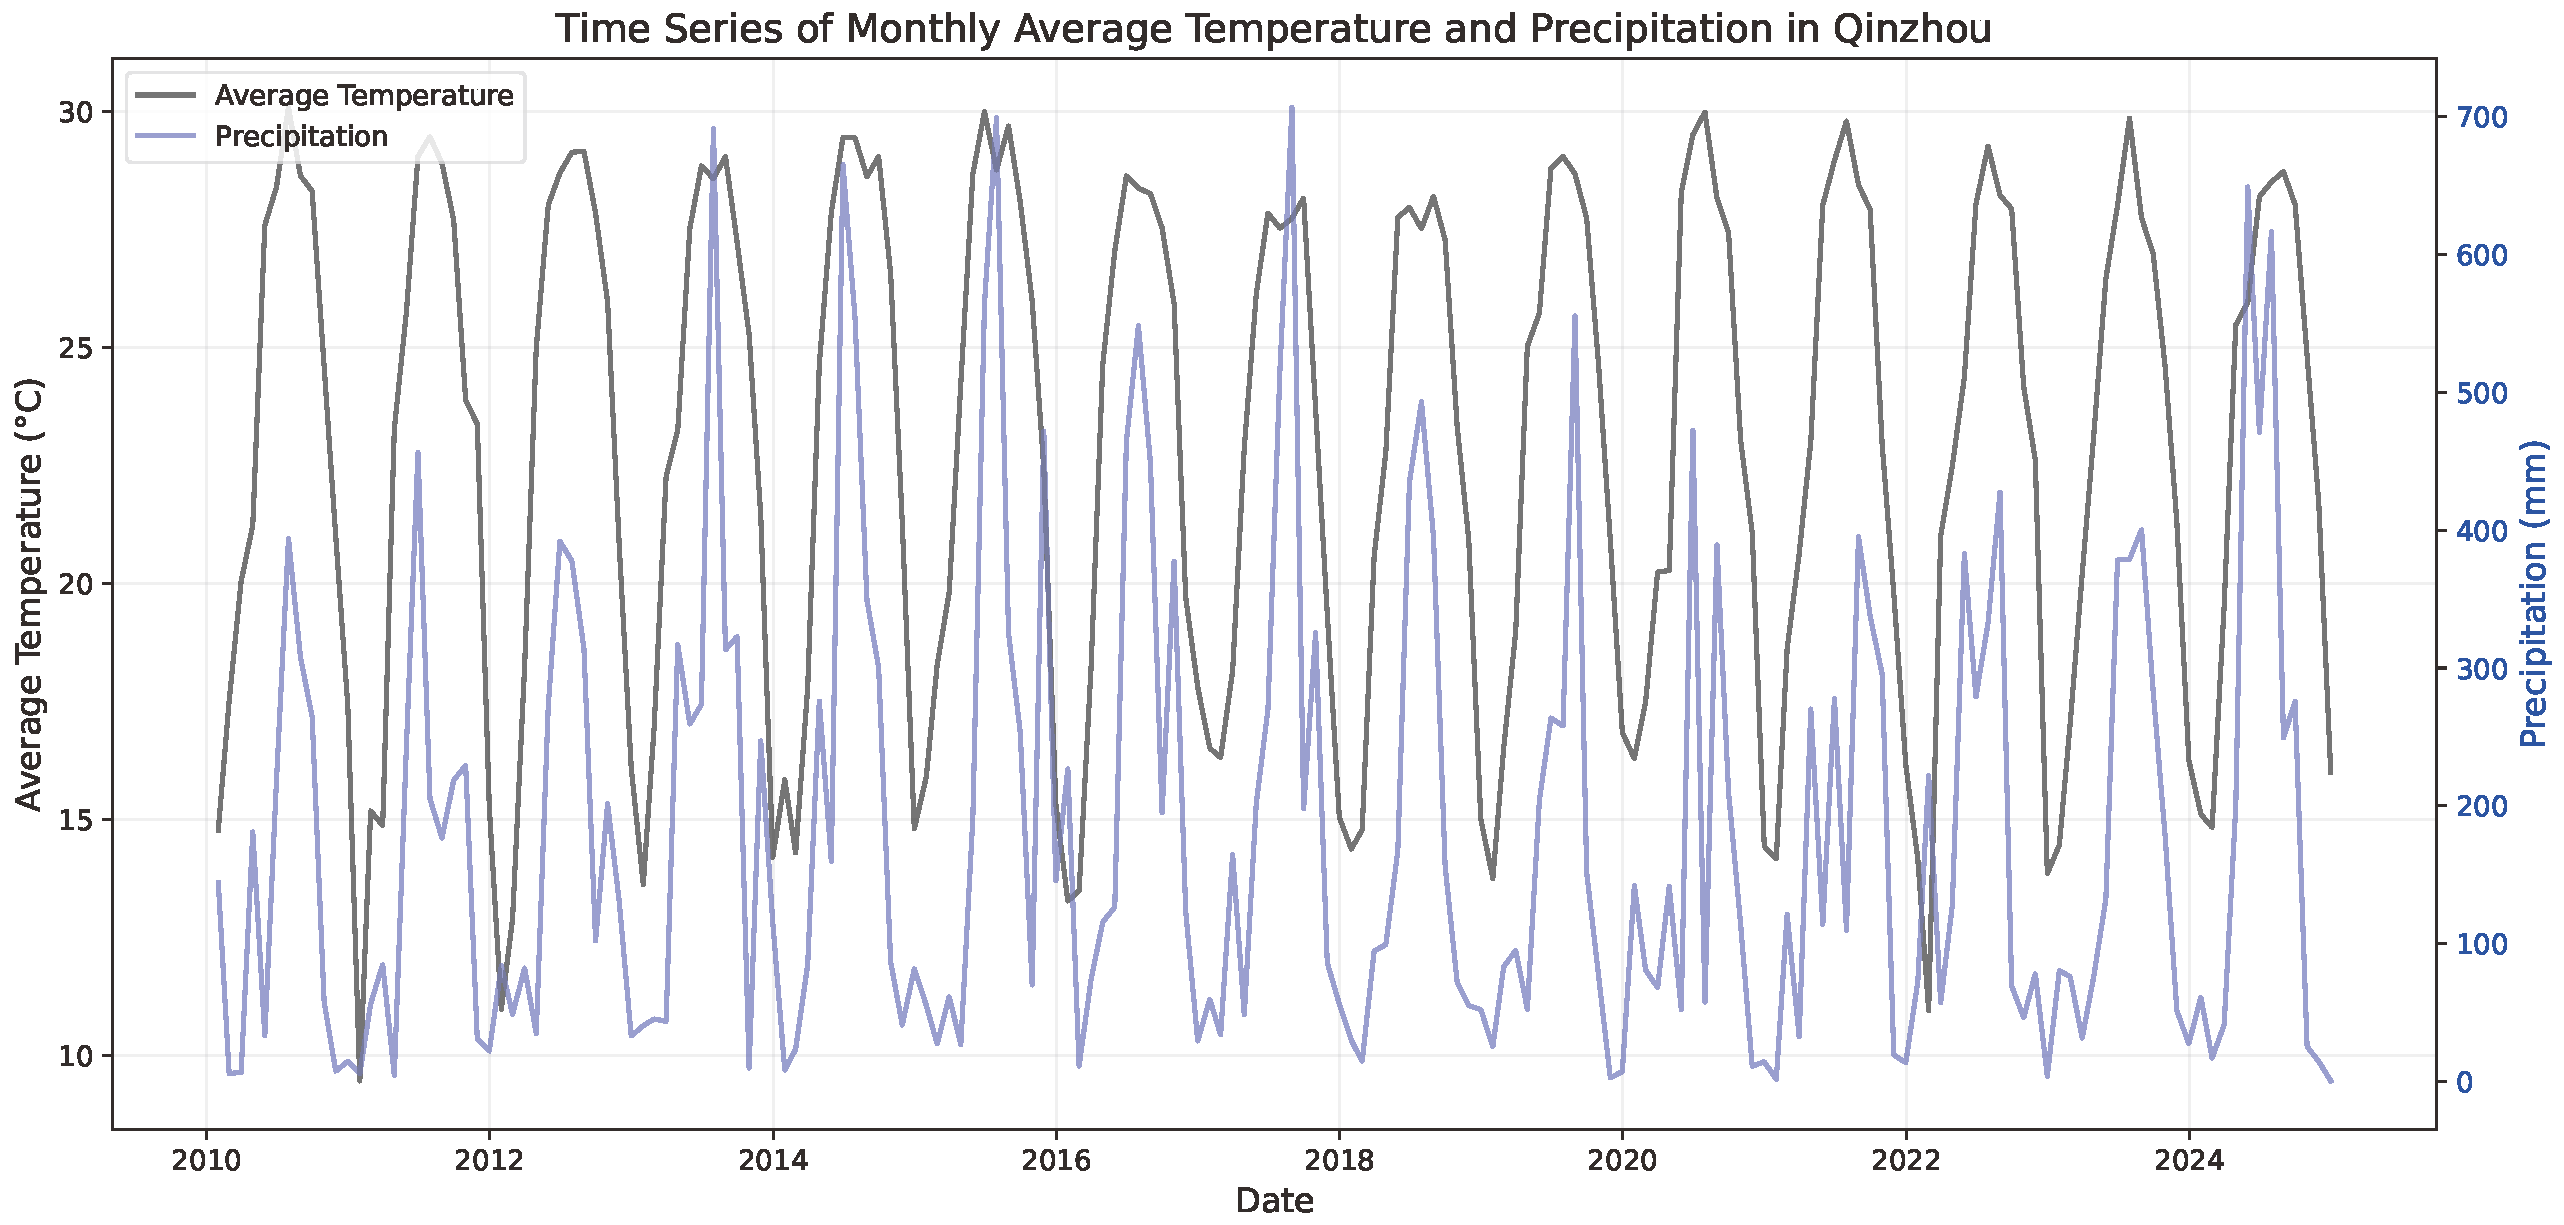
This paper uses public data from the Daily Global Historical Climatology Network (GHCN-DAILY) provided by NOAA [8]. The Qinzhou weather station has station ID CHM00059632. Both daily precipitation (element PRCP) in tenths of millimeters and average temperature (element TAVG) in tenths of degrees Celsius of the station are collected, spanning 2010 to 2024, 14 years in total. Daily precipitation and average temperature are aggregated into monthly data with units converted into millimeters and degrees Celsius, respectively. The time series plot is shown in Figure 1. Both datasets exhibit strong seasonality with a period of 1 year (12 data points), with peaks generally occurring in July. The first 12 years constitute the training set, while the remaining 2 years form the test set.
Compared to the average temperature, monthly precipitation in Qinzhou exhibits stronger fluctuations in summer. Specifically, in 2013, 2014, 2015, 2017, and 2024, the monthly summer precipitation in Qinzhou was significantly higher than that in other years.
2.2. SARIMA
SARIMA model can be written as SARIMA(p,d,q)(P,D,Q)s; (p,d,q) as the non-seasonal order, (P,D,Q) as the seasonal order, and s as the period [7]. For models in this paper, s is set to 12, since monthly average temperature and precipitation of Qinzhou have periods of 12 months. The general formula of SARIMA model is
where
The process of determining the parameters can be summarized as follows: difference the time series until it becomes stationary to determine d, and traverse several parameter combinations, selecting the one that passes the Ljung-box test (LB test) with the smallest Akaike information criterion (AIC) values and good accuracy as indicated by the coefficient of determination (
3. Results and discussion
The Augmented Dickey-Fuller (ADF) test with the null hypothesis of non-stationarity is widely used to determine stationarity of time series. As shown in Table 1, since the ADF test p-values for the original monthly average temperature (0.1282) and precipitation (0.4120) series in Qinzhou are both greater than 0.05, d is set to 1, meaning the original series will be differenced once; the p-values of the differenced series are both 0.0000, confirming that the first-differenced series are stationary. ADF test p-values of both meteorological indicators' seasonal adjusted series are less than 0.05 (0.0008 for temperature and 0.0000 for precipitation). Thus, D is prioritized to be set to 0.
|
Temperature |
Precipitation |
|||
|
Series Type |
ADF Statistics |
p-value |
ADF Statistics |
p-value |
|
Original Series |
-2.4497 |
0.1282 |
-1.7373 |
0.4129 |
|
First Differenced Series |
-10.4115 |
0.0000 |
-9.1434 |
0.0000 |
|
Seasonal Adjusted |
-4.1523 |
0.0008 |
-13.7933 |
0.0000 |
Aiming to find the model with the least AIC value, the parameters p, q, P, and Q were traversed from 0 to 3 for both time series, given that d=1, D=0, and s=12. The three combinations of parameters with the least AIC value are shown in Table 2, where * indicates the finally selected models. Due to the LB test p-value of the SARIMA model for Qinzhou monthly average temperature with the least AIC value being significant (less than 0.05), the SARIMA(2,1,1)(1,0,1)12 model with the second lowest AIC value and an LB test p-value of 0.0704 was selected. It was considered that when D=1, the SARIMA model with
|
SARIMA orders |
AIC |
Ljung-Box p-value |
|
MSE(°C²/mm²) |
RMSE(°C/mm) |
|
Monthly Average Temperature |
|||||
|
(0,1,1)(1,0,2)12 |
617.358 |
0.0000 |
0.9733 |
0.6840 |
0.8270 |
|
(2,1,1)(1,0,1)12* |
619.478 |
0.0704 |
0.9691 |
0.7907 |
0.8892 |
|
(0,1,1)(1,0,3)12 |
620.38 |
0.0000 |
0.9740 |
0.6671 |
0.8168 |
|
Monthly Precipitation |
|||||
|
(3,1,2)(0,0,0)12 |
1961.525 |
0.0425 |
0.0741 |
33974.2181 |
184.3210 |
|
(3,1,0)(1,0,1)12 |
1970.732 |
0.5137 |
0.2360 |
28032.2822 |
167.4284 |
|
(2,1,0)(1,0,1)12 |
1976.996 |
0.5541 |
0.2880 |
26124.7906 |
161.6317 |
|
(0,1,1)(0,1,2)12* |
1782.878 |
0.9638 |
0.5726 |
15682.1595 |
125.2284 |
|
(1,1,2)(0,1,1)12 |
1783.489 |
0.9992 |
0.5251 |
17424.5733 |
132.0022 |
|
(1,1,1)(0,1,2)12 |
1783.501 |
0.9979 |
0.5498 |
16520.4374 |
128.5319 |
The SARIMA(2,1,1)(1,0,1)12 model has
|
|
|
|
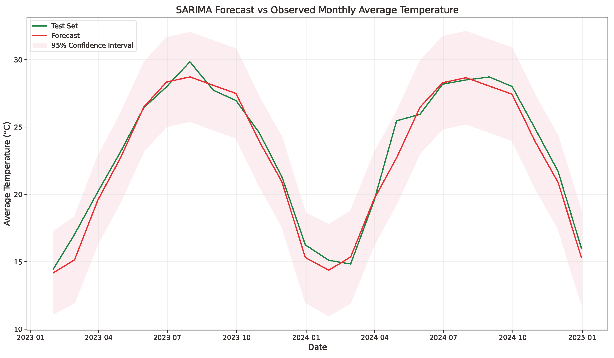
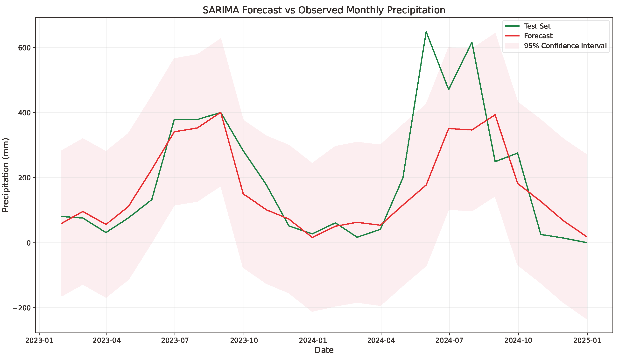
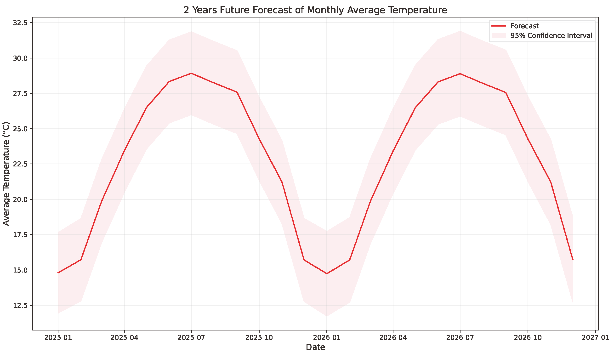
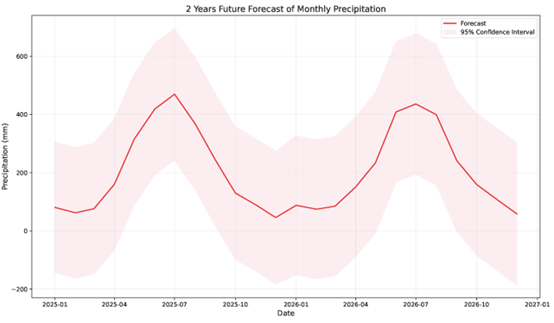
Figure 2. Forecast results
By examining the comparison plot of precipitation forecast and the test set (Figure 2 (b)), it is observed that the 95% confidence interval of forecast values captures the actual data of 2023. Additionally, the forecast values are shown to match the actual data with relatively high accuracy, suggesting that the SARIMA(0,1,1)(0,1,2)12 model effectively predicts the 2023 Qinzhou monthly precipitation; yet, in 2024, the actual data in May and July exceed the 95% confidence interval. As a result, the SARIMA model has an
Compared to temperature, precipitation has features of greater temporal and spatial variations, and less stability, being concentrated in several successive days and susceptible to other meteorological elements such as monsoons, air pressures, and airflow convergences. Thus, precipitation has greater randomness and a higher probability of occurrence of extreme events. In light of these conditions, the SARIMA model exhibits its shortcomings when facing abrupt, extreme values of precipitation. Still, variations in forecast values of the SARIMA models can explain 57.26% of the variations in Qinzhou's monthly precipitation and 96.91% of the variations in Qinzhou's monthly average temperature, in 2023 and 2024. Hence, SARIMA models can provide valuable references for setting up precautionary measures against damage triggered by either high or low precipitation and temperature.
4. Conclusion
This paper selected SARIMA(2,1,1)(1,0,1)12 and SARIMA(0,1,1)(0,1,2)12 to model the monthly average temperature and precipitation in Qinzhou from 2010 to 2022. AIC values and LB test p-values indicate that both models fit well. By comparing with actual data in 2023 and 2024, SARIMA models forecast monthly precipitation in 2023 and monthly average temperature in 2023 and 2024 with high accuracy, but due to external factors, as monthly precipitation in May and July 2024 reached the highest values in the past 7 years, the SARIMA model fails to capture this change. Since SARIMA models forecast based on past data, these results confirm that they are more applicable to time series with fewer abrupt, extreme fluctuations. Future studies could use the SARIMA with exogenous variables (SARIMAX) model by introducing data on atmospheric circulation and typhoons to address the shortcomings of the SARIMA model in forecasting extreme precipitation and achieve higher forecast accuracy.
References
[1]. Rui, Z., Chun-qing, G., Qiu-ju, F., & Lin-yan, P. (2012). Study on the drought and flood disasters formation mechanism in karst regions of middle Guangxi. Procedia Engineering, 28, 277-281.
[2]. Ding, G., Li, X., Li, X., Zhang, B., Jiang, B., Li, D., ... & Hou, H. (2019). A time-trend ecological study for identifying flood-sensitive infectious diseases in Guangxi, China from 2005 to 2012. Environmental Research, 176, 108577.
[3]. Kim, W., Iizumi, T., Hosokawa, N., Tanoue, M., & Hirabayashi, Y. (2023). Flood impacts on global crop production: advances and limitations. Environmental Research Letters, 18(5), 054007.
[4]. Qi, C., Zhang, D., Zhu, Y., Liu, L., Li, C., Wang, Z., & Li, X. (2020). SARFIMA model prediction for infectious diseases: application to hemorrhagic fever with renal syndrome and comparing with SARIMA. BMC medical research methodology, 20(1), 243.
[5]. Yartu, M., Cambra, C., Navarro, M., Rad, C., Arroyo, Á., & Herrero, Á. (2022). Humidity forecasting in a potato plantation using time-series neural models. Journal of Computational Science, 59, 101547.
[6]. Yadav, A., Jha, C. K., & Sharan, A. (2020). Optimizing LSTM for time series prediction in Indian stock market. Procedia Computer Science, 167, 2091-2100.
[7]. Box, G. E., Jenkins, G. M., Reinsel, G. C., & Ljung, G. M. (2015). Time series analysis: forecasting and control. John Wiley & Sons.
[8]. Menne, M. J., Durre, I., Korzeniewski, B., McNeill, S., Thomas, K., Yin, X., Anthony, S., Ray, R., Vose, R. S., Gleason, B. E., & Houston, T. G. (2012). Global Historical Climatology Network - Daily (GHCN-Daily), Version 3.32. NOAA National Climatic Data Center. https: //doi.org/10.7289/V5D21VHZ
[9]. Bao, W., Wei, M., He, X., Liu, G., Zhao, F., & Zhang, X. (2024). Analysis of the causes of the extreme warm-sector rainstorm in Qinzhou on May 19, 2024. Meteorological Research and Application, 45(04), 28-33.
Cite this article
Peng,S.Y.B. (2025). Qinzhou Monthly Precipitation and Average Temperature Forecast — Based on SARIMA Model. Applied and Computational Engineering,196,1-6.
Data availability
The datasets used and/or analyzed during the current study will be available from the authors upon reasonable request.
Disclaimer/Publisher's Note
The statements, opinions and data contained in all publications are solely those of the individual author(s) and contributor(s) and not of EWA Publishing and/or the editor(s). EWA Publishing and/or the editor(s) disclaim responsibility for any injury to people or property resulting from any ideas, methods, instructions or products referred to in the content.
About volume
Volume title: Proceedings of CONF-MLA 2025 Symposium: Intelligent Systems and Automation: AI Models, IoT, and Robotic Algorithms
© 2024 by the author(s). Licensee EWA Publishing, Oxford, UK. This article is an open access article distributed under the terms and
conditions of the Creative Commons Attribution (CC BY) license. Authors who
publish this series agree to the following terms:
1. Authors retain copyright and grant the series right of first publication with the work simultaneously licensed under a Creative Commons
Attribution License that allows others to share the work with an acknowledgment of the work's authorship and initial publication in this
series.
2. Authors are able to enter into separate, additional contractual arrangements for the non-exclusive distribution of the series's published
version of the work (e.g., post it to an institutional repository or publish it in a book), with an acknowledgment of its initial
publication in this series.
3. Authors are permitted and encouraged to post their work online (e.g., in institutional repositories or on their website) prior to and
during the submission process, as it can lead to productive exchanges, as well as earlier and greater citation of published work (See
Open access policy for details).
References
[1]. Rui, Z., Chun-qing, G., Qiu-ju, F., & Lin-yan, P. (2012). Study on the drought and flood disasters formation mechanism in karst regions of middle Guangxi. Procedia Engineering, 28, 277-281.
[2]. Ding, G., Li, X., Li, X., Zhang, B., Jiang, B., Li, D., ... & Hou, H. (2019). A time-trend ecological study for identifying flood-sensitive infectious diseases in Guangxi, China from 2005 to 2012. Environmental Research, 176, 108577.
[3]. Kim, W., Iizumi, T., Hosokawa, N., Tanoue, M., & Hirabayashi, Y. (2023). Flood impacts on global crop production: advances and limitations. Environmental Research Letters, 18(5), 054007.
[4]. Qi, C., Zhang, D., Zhu, Y., Liu, L., Li, C., Wang, Z., & Li, X. (2020). SARFIMA model prediction for infectious diseases: application to hemorrhagic fever with renal syndrome and comparing with SARIMA. BMC medical research methodology, 20(1), 243.
[5]. Yartu, M., Cambra, C., Navarro, M., Rad, C., Arroyo, Á., & Herrero, Á. (2022). Humidity forecasting in a potato plantation using time-series neural models. Journal of Computational Science, 59, 101547.
[6]. Yadav, A., Jha, C. K., & Sharan, A. (2020). Optimizing LSTM for time series prediction in Indian stock market. Procedia Computer Science, 167, 2091-2100.
[7]. Box, G. E., Jenkins, G. M., Reinsel, G. C., & Ljung, G. M. (2015). Time series analysis: forecasting and control. John Wiley & Sons.
[8]. Menne, M. J., Durre, I., Korzeniewski, B., McNeill, S., Thomas, K., Yin, X., Anthony, S., Ray, R., Vose, R. S., Gleason, B. E., & Houston, T. G. (2012). Global Historical Climatology Network - Daily (GHCN-Daily), Version 3.32. NOAA National Climatic Data Center. https: //doi.org/10.7289/V5D21VHZ
[9]. Bao, W., Wei, M., He, X., Liu, G., Zhao, F., & Zhang, X. (2024). Analysis of the causes of the extreme warm-sector rainstorm in Qinzhou on May 19, 2024. Meteorological Research and Application, 45(04), 28-33.