


1. Introduction
Diabetes is a chronic metabolic disease characterized by persistent hyperglycemia and has become a major global public health challenge. According to statistics from the World Health Organization (WHO), the global prevalence of diabetes among adults aged 20-79 has reached 14%, with more than 800 million confirmed cases, a fourfold increase over 1990 [1]. By 2024, global diabetes-related medical expenditure is expected to exceed US $1 trillion, accounting for 12% of global health expenditure, which not only increases the economic burden on patients’ families but also impacts public health systems [2]. Accurate identification of prediabetes and early prediction are core to prevention and control.
Complex factors influence diabetes and rely on assumptions of linearity and variable independence, struggle to capture synergistic effects between features, and have weak multi-dimensional data fusion capabilities. Its missed diagnosis rate can reach 30%, failing to meet the needs of precise screening [3]. It can efficiently integrate multi-dimensional data, explore non-linear correlations between features, and ensure interpretability through feature importance analysis.
Based on this, this study uses the Diabetes Prediction Dataset from Kaggle to explore core influencing factors of prediabetes via machine learning, construct and optimize risk prediction models, select the most interpretable optimal model, and provide a practical tool for early prediabetes screening to reduce the risk of progression to type 2 diabetes [4].
2. Literature review
2.1. Review of previous studies on machine learning algorithms for diabetes prediction
In diabetes prediction research, the evolution of machine learning applications progresses from traditional single models to more sophisticated ensemble methods. Conventional algorithms such as Logistic Regression, Decision Trees, and k-Nearest Neighbors are widely adopted in earlier studies owing to their conceptual simplicity and high interpretability. However, subsequent research reveals notable performance limitations of these individual models. A major issue stems from the inherent characteristics of real-world medical data, which often contain high rates of missing values, noise, and inconsistencies. The absence of critical clinical indicators, such as HbA1c and OGTT, can substantially impair model performance [5]. Traditional statistical methods (e.g., mean imputation) fail to handle complex missing data, limiting model performance.
Ensemble learning effectively addresses these limitations. Voting-based ensemble models, for instance, demonstrate improves prediction accuracy through multi-model fusion [6]. CatBoost excels at automatically processing categorical features, maintaining stable performance in samples with discrete variables, and solving the problem of categorical feature encoding in traditional algorithms. XGBoost further optimizes performance through regularization mechanisms, achieving high accuracy with feature importance rankings consistent with clinical consensus. Zhang et al. further optimized XGBoost by addressing its cumbersome parameter tuning and tendency to fall into local optima: they introduced a genetic algorithm for global parameter search (using MSE as the fitness function), and the optimized model outperforms both traditional algorithms and default-parameter XGBoost [7]. However, large prediction deviations for rare high blood glucose values and room for optimization in runtime should be addressed.
Overall, previous studies share common limitations, including insufficient algorithm comparison, rough data preprocessing, and inadequate integration of medical knowledge. By comparing five algorithms (Logistic Regression, Decision Tree, KNN, CatBoost, XGBoost) and combining strict data cleaning with medical cognition verification, this study aims to construct a more accurate and stable prediction model.
2.2. Supplementary applications of machine learning algorithms in medical prediction
Machine learning excels at processing complex data and capturing correlations. It is widely used for risk prediction in fields such as cardiovascular and cerebrovascular diseases, cancer, and infectious diseases, and performs significantly better than traditional methods.
In chronic kidney disease (CKD) prediction, Liu et al. used CatBoost to forecast 2-year end-stage renal disease (ESRD) risk, achieving high accuracy and clinical utility [8]. For myocardial infarction (MI) risk, XGBoost outperformed traditional methods in identifying high-risk groups and explaining prediction logic [9].
Machine learning offers universal advantages in medical prediction, as it can integrate multiple types of data, capture correlations between indicators, and achieve high accuracy with fewer misjudgments including missed judgments, and erroneous judgments compared to traditional methods.
3. Methodology
3.1. Algorithm principles
3.1.1. K-Nearest Neighbors (KNN)
KNN is an inert supervised learning algorithm based on sample similarity to determine category attribution. It lacks an explicit model training process, relying solely on stored training data for prediction. The approach utilizes Euclidean distance as the standard for similarity quantification, which requires determining the hyperparameter K through cross-validation to balance the ability to capture local features with resistance to noise interference. Finally, the K nearest neighbor samples with the smallest distance are selected from the predicted samples, and their categories are deduced based on the majority voting rule. It is a probability voting process based on the distribution of local samples.
3.1.2. CatBoost
CatBoost is an improved ensemble learning algorithm based on Gradient Boosting Decision Trees (GBDT), optimized for categorical feature processing and bias control. It realizes classification by iteratively constructing a weighted ensemble of CART trees. For non-numeric categorical features, it adopts ordered ranking encoding based on the mean value of the target variable, which completes numerical conversion while preserving logical relationships between categories. Through the “ordered boosting” strategy, it calculates gradients using the complete training set to reduce bias caused by sample splitting in traditional GBDT. Additionally, it suppresses overfitting via three regularization mechanisms: tree complexity restriction, learning rate adjustment, and random subspace sampling. It is suitable for modeling scenarios with small samples and multiple categorical features.
3.1.3. Extreme Gradient Boosting (XGBoost)
XGBoost is a theoretically optimized and engineering-enhanced version of GBDT, focusing on accurate loss function optimization and robustness improvement. It iteratively corrects errors of previous models through an additive model. Breaking the limitation of traditional GBDT using only first-order derivatives, XGBoost introduces second-order derivatives (Hessian) and approximates the loss function as a quadratic Taylor polynomial for more precise error optimization. It can automatically learn the optimal splitting path for missing values during training and improve computational efficiency via feature parallelism and sparse-aware optimization. It is suitable for modeling scenarios with multiple features and missing values.
3.2. Data preprocessing
3.2.1. Data cleaning
Data cleaning focused on correcting outliers and unreasonable values in the original dataset to ensure data consistency with reasonable ranges of physiological indicators and improve data accuracy. Specific operations included:
Correcting abnormal physiological indicator values: Adjusting values exceeding normal physiological ranges for indicators such as urea, creatinine (Cr), high-density lipoprotein (HDL), very low-density lipoprotein (VLDL), and cholesterol (Chol).
Addressing data consistency issues: Calibrating unreasonable values caused by potential input errors (e.g., abnormally high/low values of VLDL and triglycerides [TG]) based on reasonable ranges to avoid interference of extreme values on subsequent analysis.
3.2.2. Data formatting
Data formatting focused on data type conversion, removal of irrelevant variables, and numerical encoding of categorical variables to provide numerical data suitable for subsequent modeling. Specific operations included:
Numerical encoding of categorical variables: Converting character-type categorical variables to numerical variables: Gender (gender): 0 for female (original: F), 1 for male (original: M). CLASS (diabetes status): 0 for Non-diabetic (original: N), 1 for Prediabetic (original: P), 2 for Diabetic (original: Y). This solved the problem that character-type variables cannot be directly used for modeling.
Removing irrelevant identifier variables: Deleting ID and No_Pation columns (both are unique sample identifiers with no correlation to diabetes) to simplify feature dimensions and reduce interference of redundant information on the model.
Ensuring data format consistency: Unifying data types of all features, aligning numerical indicators with encoded categorical variables to lay a foundation for subsequent machine learning model training and statistical analysis.
3.3. Model design
To determine the optimal parameters for the training model, this study uses a grid search method with 5-fold cross-validation [10]. Grid search exhaustively tests all possible hyperparameter combinations by defining the hyperparameters to be adjusted and their possible value ranges, ultimately selecting the combination with the best performance. Accuracy is used as the core evaluation metric for optimal parameter selection during grid search. In the subsequent test phase, this study uses multiple metrics, Accuracy, Recall, Precision, F1, and AUC-ROC for verification. The main adjusted model parameters and their value ranges are shown in Table 1.
|
Model |
Parameters |
Value Range |
|
Logistic Regression |
C (regularization strength) Penalty (regularization method) |
[0.01,0.1,1,10] ['l1’, 'l2’] |
|
Decision Tree |
max_depth (maximum tree depth) min_samples_leaf(min samples per leaf node) criterion (splitting criterion) |
[3,5,7, None] [1,5,10] [gini (Gini coefficient),entropy (information, entropy)] |
|
KNN |
n_neighbors weights p (distance metric) |
[1,3,5,7,9] ['uniform’ (equal weight), 'distance’(distance-weighted)] [1 (Manhattan distance),2 (Euclidean distance)] |
|
CatBoost |
iterations learning_rate depth (tree depth) |
[100,200,1000] [0.01,0.1,0.3] [3,5] |
|
XGBoost |
n_estimators (number of decision trees) learning_rate max_depth |
[100,200,1000] [0.01,0.1,0.3] [3,5,7] |
4. Experiment
4.1. Experimental design
First, the dataset was split using Python’s train_test_split function, with 80% allocated to the training set and 20% to the test set. random_state=42 was set to ensure experimental reproducibility.
Logistic Regression and Decision Tree served as basic prediction methods for result comparison. KNN, CatBoost, and XGBoost were the core research objects, with hyperparameters optimized via grid search (GridSearchCV), with five-fold cross-validation (target: accuracy). Subsequently, the optimal model of each algorithm was evaluated on the test set, and accuracy, macro-averaged recall, macro-averaged precision, macro-averaged F1-score, and multi-class AUC-ROC were calculated. Feature importance was extracted and visualized for four models (Decision Tree, CatBoost, XGBoost, and Logistic Regression). Finally, the optimal prediabetes prediction model was selected based on comprehensive evaluation metrics.
4.2. Analysis of feature importance
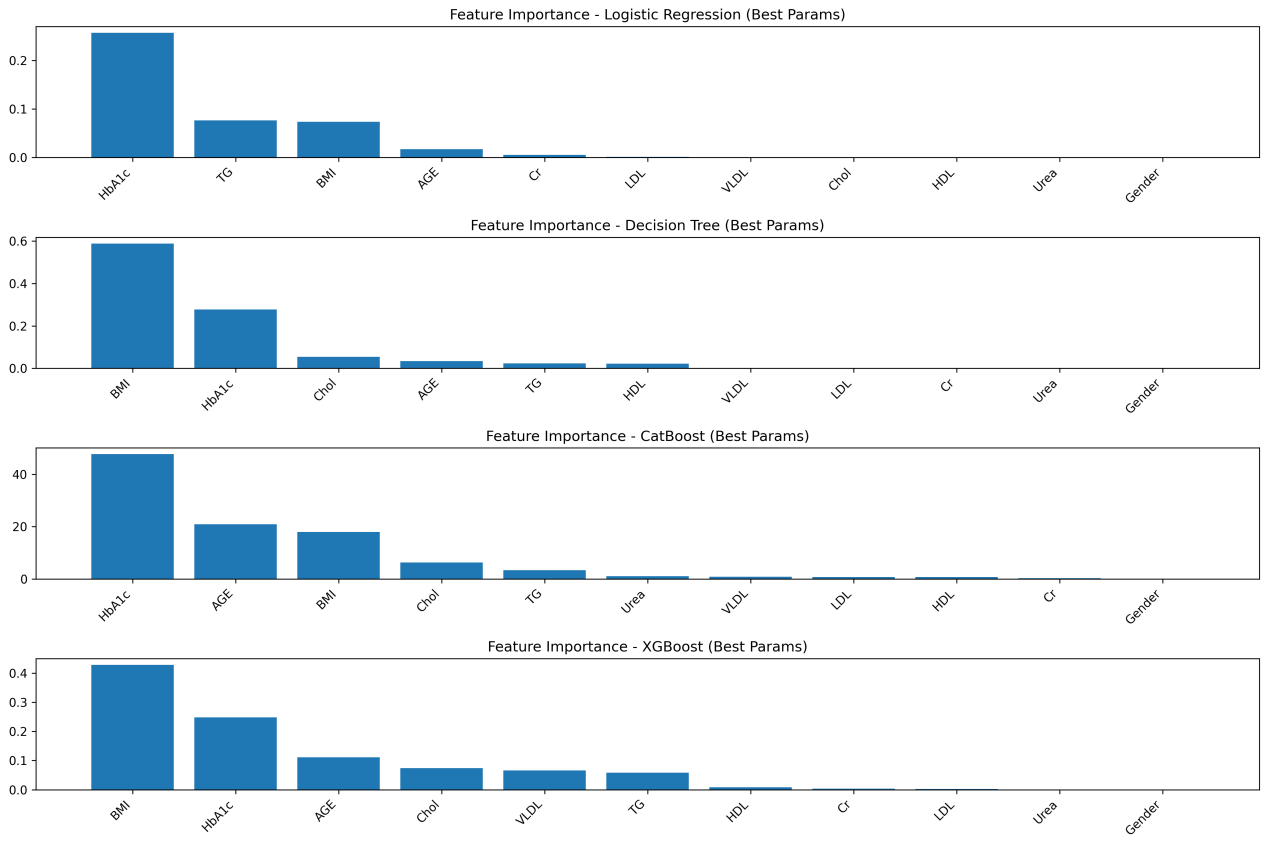
As shown in Figure 1, feature importance rankings across the four models (Logistic Regression, Decision Tree, CatBoost, and XGBoost) exhibit both consistencies and reasonable differences, all of which align closely with clinical knowledge and validate key diabetes risk factors.
HbA1c is consistently identified as the most important predictive feature in all models, reflecting its status as an internationally recognized gold standard for diabetes diagnosis. As it indicates average blood glucose levels over the past 2–3 months, thereby validating the feature selection approach in this study [11].
Beyond HbA1c, the hierarchy of influencing factors reflects clinically relevant patterns. Ensemble models emphasize the significance of age, corroborating the notion that “individuals over 40 belong to the high-risk group for diabetes.” In the Decision Tree model, BMI ranks second in importance, supporting the clinical understanding that obesity-induced insulin resistance is a core mechanism in type 2 diabetes pathogenesis [12]. The importance of blood lipid and renal function indicators varies complementarily across models, illustrating the systemic nature of metabolic dysregulation and the ability of different algorithms to capture distinct correlation patterns.
In contrast, gender is the least important feature in all models, indicating that its influence on diabetes onset is negligible compared to core physiological, metabolic, and demographic factors (age, BMI). This observation is consistent with previous studies that found no significant impact of gender on incidence rates or mortality [13]. Therefore, gender need not be considered a core indicator in diabetes screening. Differences in secondary feature weights, such as linear models focusing on linear correlations of blood lipid indicators and ensemble models emphasizing interactions between age and renal function indicators are inherent to algorithmic principles and do not alter the identification of central risk factors.
4.3. Model performance comparison
Table 2 presents the test set performance metrics of each model under optimal parameter configuration. The models exhibited a clear hierarchy: ensemble learning models (CatBoost,XGBoost) > single-tree model (Decision Tree) > lazy learning model (KNN) > linear model (Logistic Regression). Ensemble learning models performed particularly well in metrics critical to medical scenarios.
|
Model |
Accuracy |
Recall |
Precision |
F1 |
AUC-ROC |
|
Logistic Regression |
0.900 |
0.598 |
0.567 |
0.582 |
0.941 |
|
Decision Tree |
0.975 |
0.967 |
0.967 |
0.967 |
0.970 |
|
KNN |
0.950 |
0.934 |
0.832 |
0.869 |
0.995 |
|
CatBoost |
0.993 |
0.997 |
0.986 |
0.991 |
0.999 |
|
XGBoost |
0.987 |
0.994 |
0.974 |
0.984 |
0.999 |
Among all models, CatBoost stood out: it achieved 0.993 accuracy, 0.997 recall (nearly zero missed diagnosis), 0.986 precision (high prediction credibility), plus the highest macro-averaged F1-score 0.991 and multi-class AUC-ROC 0.999. It fully meets diabetes prediction’s core needs: low missed diagnosis rate, low misdiagnosis rate, and stable classification.
For other models: XGBoost matched CatBoost in AUC-ROC but performed slight worse in core accuracy and recall. Decision Tree, KNN, and Logistic Regression were inferior overall. In particular, Logistic Regression failed to capture non-linear feature correlations, leading to poor performance ( accuracy 0.900, recall 0.598). Notably, AUC-ROC in medical scenarios must be comprehensively judged with specific classification indicators and cannot be used as the sole evaluation criterion. Thus, the CatBoost model is determined to be highly accurate and stable, making it the optimal high-performance prediction model.
5. Discussion
5.1. Limitations
Although this study constructed and selected an optimal diabetes prediction model using multiple algorithms, it has notable limitations in model design and applicability, mainly in two aspects.
Insufficient data support and limited generalization ability. The model relies on single-source data (from Kaggle), which has significant flaws: Lack of labels for region, ethnicity, economic status, and underlying diseases,f ailing to cover population heterogeneity in diabetes onset. This leads to reduced generalization performance of the model in specific populations.
No longitudinal time-series data in the dataset. Feature processing is confined to basic operations, such as variable encoding and redundancy removal, with no construction of clinically meaningful composite features. Moreover, feature selection relies entirely on the built-in mechanisms of algorithms, without prior screening based on clinical guidelines. This results in insufficient clinical integrity of the feature system and inaccurate characterization of diabetes pathogenesis.
5.2. Future directions
Future research can advance in four key directions. First, expand multi-source longitudinal data by incorporating population heterogeneity features and dynamic monitoring indicators [14]. Second, construct composite indicators based on clinical needs, optimize feature dimensions, develop population-specific sub-models and improve interpretability. Thirs, adopts methods such as knowledge-guided graph attention networks to enhance disease prediction and incorporate medical knowledge graphs to help infer missing values through graph-based representation learning [15]. Ultimately, promote clinical translation by integrating models into medical systems, developing lightweight tools, and conducting prospective verification to support diabetes prevention and control, ultimately reducing disease burden.
6. Conclusion
Using the Diabetes Prediction Dataset from Kaggle, this study first corrected outliers in physiological indicators, encoded categorical variables, and removed irrelevant variables. Then, five algorithms (Logistic Regression, Decision Tree, KNN, CatBoost, XGBoost) were used for modeling, with hyperparameters optimized via five-fold cross-validation combined with grid search. The model’ performance was evaluated using multiple metrics. Results showed that the ensemble learning model, CatBoost, performed best, with an accuracy of 0.993 and AUC-ROC of 0.999 on the test set—outperforming other model types. HbA1c was the primary predictor of diabetes risk, while the gender had the least impact in the model. This study overcomes the limitations of traditional linear statistics, provide an efficient technical tool for early diabetes screening and risk assessment, and clarified the predictive priority of clinical indicators.
This research also has limitations in terms of data support, feature engineering, and model interpretability. In the future, improvements can be implemented in the following aspects. First, collecting multicenter longitudinal data and balancing sample distribution to enhance the model’s generalization ability. Second, integrating clinical knowledge to construct composite features, screen indicators based on guidelines, and refine the feature system. Third, leveraging tools such as SHAP values to quantify the mechanism underlying feature action and improve the model’s interpretability.
References
[1]. Zhou, B., et al. (2023) Worldwide trends in diabetes prevalence and treatment from 1990 to 2022: A pooled analysis of 1108 population-representative studies with 141 million participants. The Lancet, 404(10467), 2077 - 2093
[2]. International Diabetes Federation (IDF). (2025). IDF Diabetes Atlas. https: //diabetesatlas.org/
[3]. Office for National Statistics (ONS). (2024). Risk factors for pre-diabetes and undiagnosed type 2 diabetes in England: 2013 to 2019. https: //www.ons.gov.uk/
[4]. Marshal, P. (2025). Diabetes Prediction Dataset. Kaggle. https: //www.kaggle.com/datasets/marshalpatel3558/diabetes-prediction-dataset-legit-dataset
[5]. Luo, F., et al. (2022). Missing Value Imputation for Diabetes Prediction. In 2022 International Joint Conference on Neural Networks (IJCNN), (pp. 1-8) Padua, Italy. https: //doi.org/10.1109/IJCNN55064.2022.9892398
[6]. Zhang, Y., He, S., & You, S. (2019). Application of Ensemble Learning in Diabetes Prediction [J]. Intelligent Computer and Applications, 9(5): 176–179.
[7]. Zhang, C. F., Wang, S., & Wu, Y. D. (2020). Diabetes Risk Prediction Based on GA-Xgboost Model. Computer Engineering, 46(3): 315–320.
[8]. Haque, M. E., Islam, S. M. J., Maliha, J., Sumon, M. S. H., Sharmin, R., & Rokoni, S. (2025). Improving Chronic Kidney Disease Detection Efficiency: Fine Tuned CatBoost and Nature-Inspired Algorithms with Explainable AI. In 2025 IEEE 14th International Conference on Communication Systems and Network Technologies (CSNT). Bhopal, India, pp. 811-818.
[9]. Moore, A., & Bell, M. (2022). XGBoost, A Novel Explainable AI Technique in the Prediction of Myocardial Infarction: A UK Biobank Cohort Study. Clinical Medicine Insights. Cardiology, 16, 11795468221133611.
[10]. Ahmad, G. N., Fatima, H., Ullah, S., Saidi, A. S., & Imdadullah. (2022). Efficient Medical Diagnosis of Human Heart Diseases Using Machine Learning Techniques With and Without GridSearchCV. IEEE Access, 10, 80151-80173.
[11]. World Health Organization. (2011). Use of glycated haemoglobin (HbA1c) in the diagnosis of diabetes mellitus: Abbreviated report of a WHO consultation.
[12]. Ruze, R., Liu, T., Zou, X., Song, J., Chen, Y., Xu, R., Yin, X., & Xu, Q. (2023). Obesity and type 2 diabetes mellitus: Connections in epidemiology, pathogenesis, and treatments. Frontiers in Endocrinology, 14, 1161521. https: //doi.org/10.3389/fendo.2023.1161521
[13]. Singh-Manoux, A., et al. (2008). Gender differences in the association between morbidity and mortality among middle-aged men and women. American Journal of Public Health, 98(12), 2251–2257. https: //doi.org/10.2105/AJPH.2006.107912
[14]. Rodriguez-Leon, C., Aviles-Perez, M. D., Banos, O., Quesada-Charneco, M., Lopez-Ibarra Lozano, P. J., Villalonga, C., & Munoz-Torres, M. (2023). T1DiabetesGranada: a longitudinal multi-modal dataset of type 1 diabetes mellitus. Scientific Data, 10, 916. https: //doi.org/10.1038/s41597-023-02737-4
[15]. Zhao, Q., Li, J., Zhao, L., & Zhu, Z. (2023). Knowledge guided feature aggregation for the prediction of chronic obstructive pulmonary disease with Chinese EMRs. IEEE/ACM Transactions on Computational Biology and Bioinformatics, 20(6), 3343-3352. https: //doi.org/10.1109/TCBB.2022.3198798
Cite this article
Peng,K. (2025). Construction of a Diabetes Prediction Model Based on Machine Learning. Applied and Computational Engineering,202,39-46.
Data availability
The datasets used and/or analyzed during the current study will be available from the authors upon reasonable request.
Disclaimer/Publisher's Note
The statements, opinions and data contained in all publications are solely those of the individual author(s) and contributor(s) and not of EWA Publishing and/or the editor(s). EWA Publishing and/or the editor(s) disclaim responsibility for any injury to people or property resulting from any ideas, methods, instructions or products referred to in the content.
About volume
Volume title: Proceedings of CONF-MLA 2025 Symposium: Intelligent Systems and Automation: AI Models, IoT, and Robotic Algorithms
© 2024 by the author(s). Licensee EWA Publishing, Oxford, UK. This article is an open access article distributed under the terms and
conditions of the Creative Commons Attribution (CC BY) license. Authors who
publish this series agree to the following terms:
1. Authors retain copyright and grant the series right of first publication with the work simultaneously licensed under a Creative Commons
Attribution License that allows others to share the work with an acknowledgment of the work's authorship and initial publication in this
series.
2. Authors are able to enter into separate, additional contractual arrangements for the non-exclusive distribution of the series's published
version of the work (e.g., post it to an institutional repository or publish it in a book), with an acknowledgment of its initial
publication in this series.
3. Authors are permitted and encouraged to post their work online (e.g., in institutional repositories or on their website) prior to and
during the submission process, as it can lead to productive exchanges, as well as earlier and greater citation of published work (See
Open access policy for details).
References
[1]. Zhou, B., et al. (2023) Worldwide trends in diabetes prevalence and treatment from 1990 to 2022: A pooled analysis of 1108 population-representative studies with 141 million participants. The Lancet, 404(10467), 2077 - 2093
[2]. International Diabetes Federation (IDF). (2025). IDF Diabetes Atlas. https: //diabetesatlas.org/
[3]. Office for National Statistics (ONS). (2024). Risk factors for pre-diabetes and undiagnosed type 2 diabetes in England: 2013 to 2019. https: //www.ons.gov.uk/
[4]. Marshal, P. (2025). Diabetes Prediction Dataset. Kaggle. https: //www.kaggle.com/datasets/marshalpatel3558/diabetes-prediction-dataset-legit-dataset
[5]. Luo, F., et al. (2022). Missing Value Imputation for Diabetes Prediction. In 2022 International Joint Conference on Neural Networks (IJCNN), (pp. 1-8) Padua, Italy. https: //doi.org/10.1109/IJCNN55064.2022.9892398
[6]. Zhang, Y., He, S., & You, S. (2019). Application of Ensemble Learning in Diabetes Prediction [J]. Intelligent Computer and Applications, 9(5): 176–179.
[7]. Zhang, C. F., Wang, S., & Wu, Y. D. (2020). Diabetes Risk Prediction Based on GA-Xgboost Model. Computer Engineering, 46(3): 315–320.
[8]. Haque, M. E., Islam, S. M. J., Maliha, J., Sumon, M. S. H., Sharmin, R., & Rokoni, S. (2025). Improving Chronic Kidney Disease Detection Efficiency: Fine Tuned CatBoost and Nature-Inspired Algorithms with Explainable AI. In 2025 IEEE 14th International Conference on Communication Systems and Network Technologies (CSNT). Bhopal, India, pp. 811-818.
[9]. Moore, A., & Bell, M. (2022). XGBoost, A Novel Explainable AI Technique in the Prediction of Myocardial Infarction: A UK Biobank Cohort Study. Clinical Medicine Insights. Cardiology, 16, 11795468221133611.
[10]. Ahmad, G. N., Fatima, H., Ullah, S., Saidi, A. S., & Imdadullah. (2022). Efficient Medical Diagnosis of Human Heart Diseases Using Machine Learning Techniques With and Without GridSearchCV. IEEE Access, 10, 80151-80173.
[11]. World Health Organization. (2011). Use of glycated haemoglobin (HbA1c) in the diagnosis of diabetes mellitus: Abbreviated report of a WHO consultation.
[12]. Ruze, R., Liu, T., Zou, X., Song, J., Chen, Y., Xu, R., Yin, X., & Xu, Q. (2023). Obesity and type 2 diabetes mellitus: Connections in epidemiology, pathogenesis, and treatments. Frontiers in Endocrinology, 14, 1161521. https: //doi.org/10.3389/fendo.2023.1161521
[13]. Singh-Manoux, A., et al. (2008). Gender differences in the association between morbidity and mortality among middle-aged men and women. American Journal of Public Health, 98(12), 2251–2257. https: //doi.org/10.2105/AJPH.2006.107912
[14]. Rodriguez-Leon, C., Aviles-Perez, M. D., Banos, O., Quesada-Charneco, M., Lopez-Ibarra Lozano, P. J., Villalonga, C., & Munoz-Torres, M. (2023). T1DiabetesGranada: a longitudinal multi-modal dataset of type 1 diabetes mellitus. Scientific Data, 10, 916. https: //doi.org/10.1038/s41597-023-02737-4
[15]. Zhao, Q., Li, J., Zhao, L., & Zhu, Z. (2023). Knowledge guided feature aggregation for the prediction of chronic obstructive pulmonary disease with Chinese EMRs. IEEE/ACM Transactions on Computational Biology and Bioinformatics, 20(6), 3343-3352. https: //doi.org/10.1109/TCBB.2022.3198798